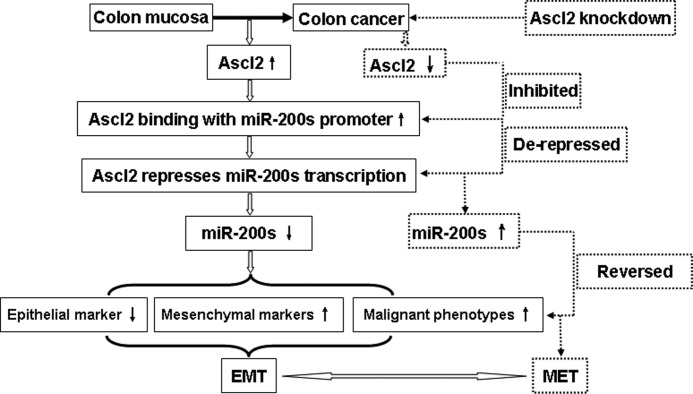
Background: Ascl2 regulates the plasticity of EMT-MET programs in colon cancer cells.
Results: Ascl2 loss of function in colon cancer cells promoted MET by derepressing miR-200 expression through a direct transcriptional mechanism.
Conclusion: Ascl2 promotes EMT occurrence in part via miR-200s.
Significance: This study sheds new light on preventing EMT in colon cancer.
Keywords: Colon Cancer, Colorectal Cancer, Epithelial-Mesenchymal Transition (EMT), MicroRNA (miRNA), Transcription Regulation, Wnt Signaling
Abstract
Ascl2, a basic helix-loop-helix transcription factor, is a downstream target of WNT signaling that controls the fate of intestinal cryptic stem cells and colon cancer progenitor cells. However, its involvement in colon cancer and downstream molecular events is largely undefined; in particular, the mechanism by which Ascl2 regulates the plasticity of epithelial-mesenchymal transition (EMT) and mesenchymal-epithelial transition (MET) programs in colon cancer cells remains unknown. In this study, we systematically demonstrate that Ascl2 loss of function in colon cancer cells promotes MET by derepressing the expression of microRNA (miR)-200s (i.e. miR-200b, miR-200a, miR-429, miR-200c, and miR-141) and further activating their expression through a transcriptional mechanism that involves direct binding to the most proximal E-box (E-box2) in the miR-200b-a-429 promoter. Activation of miR-200s due to Ascl2 deficiency led to the inhibition of ZEB1/2 expression and the alteration of epithelial and mesenchymal features. Transfection of miR-200b, miR-200a, and miR-429 inhibitors into Ascl2-deficient colon cancer cells promoted the epithelial-mesenchymal transition in a reversible manner. Transfection of miR-200a or miR-429 inhibitors into Ascl2-deficient colon cancer cells increased cellular proliferation and migration. Ascl2 mRNA levels and the miR-200a, miR-200b, miR-200c, miR-141, or miR-429 levels in the colon cancerous samples were inversely correlated. These results provide the first evidence of a link between Ascl2 and miR-200s in the regulation of EMT-MET plasticity in colon cancer.
Introduction
Several studies have investigated the genes and encoded proteins that participate in the maintenance of stemness and in the EMT4 in colon cancer cells, which contain a population of colon cancer progenitor cells (1–3). Indeed, it is important to identify the regulatory mechanisms and signaling pathways involved in colon cancer cells to develop novel reagents that reverse the mesenchymal phenotype to the epithelial phenotype (4).
Achaete scute-like 2 (Ascl2), a basic helix-loop-helix transcription factor, is a downstream target of WNT signaling in intestinal stem cells. In situ hybridization demonstrates that Ascl2 is expressed at the base of small and large intestinal crypts and in the placenta but not in other normal tissues (5). The combined results from such gain- and loss-of-function experiments indicate that Ascl2 controls the fate of intestinal stem cells (6). Several groups have demonstrated that Ascl2 is overexpressed in colorectal cancer (5, 7, 8). In addition, Ascl2 overexpression has the potential to shift the hierarchy of stem and progenitor cells within liver metastases, resulting in self-renewal rather than differentiation and potentially affecting the clinical behavior of these tumors (8). Thus, Ascl2 may be a regulatory factor that controls the fate of colon cancer cells. However, the precise role of Ascl2 in colon cancer cells remains unknown.
MicroRNAs (miRNAs) are crucial post-transcriptional regulators of gene expression that participate in several biological functions, including cellular proliferation, differentiation, apoptosis, maintenance of stemness in both embryonic stem cells and cancer stem cells, and regulation of the EMT (9). The miR-200 family members miR-155 and miR-31 are important in specifying an epithelial or a mesenchymal state not only during embryonic development but also during tumorigenesis. These miRNAs contribute to the regulation of the plasticity between epithelial and mesenchymal features (10–12).
The plasticity between epithelial and mesenchymal features involves the EMT and the reverse process, MET, which are key programs in the regulation of embryogenesis and tumorigenesis (13). Although recent studies illustrate a link between EMT in normal and neoplastic cell populations and miR-200s (14–16), the molecular mechanisms that regulate the miR-200 family remain largely unknown.
We have reported that Ascl2 is strongly expressed in colon cancer tissues and cell lines (HT-29 cells and LS174T cells) and that Ascl2 expression is significantly inhibited due to RNA interference in both shRNA-Ascl2/LS174T cells and shRNA-Ascl2/HT-29 cells. The selective blockade of Ascl2 led to the inhibition of their proliferation, invasion, and migration and xenograft tumor growth. In addition, a miRNA microarray comparing Ascl2 interference in HT-29 cells and LS174T cells with control cells identified two types of differentially expressed miRNAs. One comprised “stemness”-related miRNAs, and we confirmed that the selective blockade of Ascl2 expression in HT-29 cells and LS174T cells resulted in tumor growth arrest via the miR-302b-related inhibition of colon cancer progenitor cells (17). The other type is “EMT”-related miRNAs, including the significantly up-regulated expression of miR-200b, miR-200a, miR-429, miR-200c, and miR-141 (17). The fact that the selective blockade of Ascl2 can induce miR-200 family expression urged us to investigate whether and how Ascl2 regulates EMT-MET plasticity.
In this report, we demonstrate the first evidence that the Ascl2/miR-200/ZEB axis can modulate the plasticity between epithelial and mesenchymal features in colon cancer cells. Additionally, the Ascl2/miR-200/ZEB axis could be a potential target in colon cancer cells for the development of novel therapies for the reverse of mesenchymal features.
MATERIALS AND METHODS
Cell Culture
The HT-29 and LS174T human colonic adenocarcinoma cell lines were obtained from Chinese Academy of Sciences Cell Bank of Type Culture Collection (Shanghai, China) and maintained at 37 °C and 5% CO2 in McCoy's 5A medium (Sigma) containing 10% fetal bovine serum (FBS) (HyClone). The shRNA-Ctr/HT-29 cells, shRNA-Ascl2/HT-29 cells, shRNA-Ctr/LS174T cells, and shRNA-Ascl2/LS174T cells were described previously and maintained in our laboratory (17).
Proliferation Assay, Colony Formation Assay, in Vitro Invasion Assay, and Migration Assay
These assays were performed as described previously (17).
Tissue Samples
Patients with colorectal cancer who were scheduled for colonoscopy or surgical resection were enrolled in the study. The cancerous samples and their pericancerous mucosa were collected by biopsy or from the resection samples. The fresh samples were immediately stored in liquid nitrogen for further quantitation of Ascl2 mRNA and miR-200 members using quantitative real time RT-PCR analysis. Age, gender, tumor size, tumor differentiation, clinical stages, and pathological data, such as depth of invasion and presence of lymph node metastasis, of all 50 patients were obtained from hospital records. Clinical stages were based on the international standard tumor-node-metastasis (TNM) method (according to the World Health Organization). The study was approved by the local clinical research ethics committee. All of the subjects provided informed consent before their colonoscopy or resection surgery.
Real Time PCR Analysis
To determine the -fold changes for each gene, real time PCR was performed using first strand cDNA, forward and reverse primers, and the SYBR Premix Ex TaqTM Green II (Takara, Japan) (17). The primer sequences are summarized in Table 1. Reactions and signal detection were measured using a real time PCR system (Bio-Rad). Expression levels were calculated as the relative expression ratio compared with β-actin or GAPDH. The real time PCRs were performed independently and in triplicate. Relative mRNA expression levels were calculated by the formula 2−ΔΔCt using SDS software (Applied Biosystems).
TABLE 1.
The primer sequences used in the real time PCR experiment
| Gene names | Forward | Reverse |
|---|---|---|
| Ascl2 | 5′-CGTGAAGCTGGTGAACTTGG-3′ | 5′-GGATGTACTCCACGGCTGAG-3′ |
| N-cadherin | 5′-GAAGGAGGTGGGGAGGAAGATA-3′ | 5′-GGTGGTCTCTGACGAGGTAAACA-3′ |
| Snail | 5′-AGTTTACCTTCCAGCAGCCCTAC-3′ | 5′-GACAGAGTCCCAGATGAGCATT-3′ |
| Slug | 5′-CAGCGAACTGGACACATACAG-3′ | 5′-GTGGAATGGAGCAGCGGTAGT-3′ |
| ZEB1 | 5′-CCTGAGTCCTATGTTTCATCAGC-3′ | 5′-AGCTCTTCTGCACTTGGTTGTG-3′ |
| ZEB2 | 5′-AGCCGTTAGCTCCCAACAGTAAC-3′ | 5′-GTTAGCCTGAGAGGATCACA-3′ |
| E-cadherin | 5′-TACACTGCCCAGGAGCCAGA-3′ | 5′-TGGCACCAGTGTCCGGATTA-3′ |
| GAPDH | 5′-CATCAAGAAGGTGGTGAAGCAG-3′ | 5′-AAAGGTGGAGGAGTGGGTGTC-3′ |
| β-Actin | 5′-TGGCACCCAGCACAATGAA-3′ | 5′-CTAAGTCATAGTCCGCCTAGAAGCA-3′ |
Western Blotting Assay
Cell lysates or homogenized tissues from tumor xenografts dissolved in SDS sample buffer were separated by SDS-PAGE and transferred to a nitrocellulose membrane. β-Actin was used as a control. The membrane was probed overnight at 4 °C with a specific primary antibody. The primary antibodies used in this study are summarized in Table 2. The detailed Western blotting procedure was described previously (17).
TABLE 2.
The primary antibodies used in the experiment
WB, Western blotting; IHC, immunohistochemistry; ChIP, chromatin immunoprecipitation assay.
| Primary antibody | Protein molecular mass | Company | Dilution |
|---|---|---|---|
| kDa | |||
| Mouse monoclonal IgG to Ascl2 | 20 | Millipore (MAB4417) | WB, 1:1000 |
| Mouse polyclonal IgG to Ascl2 | 20 | Abcam (ab107046) | IHC, 1:100; WB, 1:500 |
| Mouse monoclonal IgG to Ascl2 | 20 | Millipore (MAB4418) | ChIP |
| Mouse monoclonal IgG to E-cadherin | 130 | Abcam (ab1416) | WB, 1:1000 |
| Rabbit polyclonal IgG to N-cadherin | 130 | Santa Cruz Biotechnology (sc7939) | WB, 1:500 |
| Rabbit polyclonal IgG to snail | 34 | Santa Cruz Biotechnology (sc28199) | WB, 1:500 |
| Rabbit polyclonal IgG to slug | 34 | Santa Cruz Biotechnology (sc15391) | WB, 1:500 |
| Rabbit polyclonal IgG to ZEB1 | 190 | Abcam (ab64098) | WB, 1:500 |
| Mouse monoclonal IgG to ZEB2 | 157 | Santa Cruz Biotechnology (sc271984) | WB, 1:500 |
| Mouse monoclonal antibody to actin | 42 | Beyotime Institute of Biotechnology (AA128) | WB, 1:1000 |
miRNA Quantification Using Quantitative Real Time PCR
The sequences of the RT primers and PCR primers used for real time quantitative RT-PCR validation of the identified miRNAs are summarized in Tables 3 and 4. RNA isolation, quality control, cDNA synthesis, and quantitative real time PCR in shRNA-Ctr/LS174T cells and shRNA-Ascl2/LS174T cells were performed at Shanghai KANCHENG Biochip Co. according to the company's protocols. miRNA expression quantification in tissue samples was performed by us and was evaluated using the comparative cycle threshold (CT) method. The raw data are presented as the relative quantity of target miRNA as normalized with respect to U6. Each sample was examined in triplicate. Relative miRNA expression levels were calculated by the formula 2−ΔΔCt using SDS software. The mean gene expression ±S.D. was calculated from independent experiments.
TABLE 3.
The RT primers used in the reverse transcription of microRNA quantitative real time PCR
| Gene names | RT primers |
|---|---|
| U6 | 5′-CGCTTCACGAATTTGCGTGTCAT-3′ |
| hsa-miR-200a | 5′-GTCGTATCCAGTGCGTGTCGTGGAGTCGGCAATTGCACTGGATACGACACATCGT-3′ |
| hsa-miR-200b | 5′-GTCGTATCCAGTGCGTGTCGTGGAGTCGGCAATTGCACTGGATACGACTCATCAT-3′ |
| hsa-miR-200c | 5′-GTCGTATCCAGTGCGTGTCGTGGAGTCGGCAATTGCACTGGATACGACTCCATC-3′ |
| hsa-miR-141 | 5′-GTCGTATCCAGTGCGTGTCGTGGAGTCGGCAATTGCACTGGATACGACCCATCT-3′ |
| hsa-miR-429 | 5′-GTCGTATCCAGTGCGTGTCGTGGAGTCGGCAATTGCACTGGATACGACACGGTTT-3′ |
TABLE 4.
The primer sequences used in the microRNA quantitative real time PCR
F, forward primer; R, reverse primer.
| Gene names | Primer pairs | Annealing temperatures | Product length |
|---|---|---|---|
| °C | bp | ||
| U6 | F: 5′-GCTTCGGCAGCACATATACTAAAAT-3′ | 60 | 89 |
| R: 5′-CGCTTCACGAATTTGCGTGTCAT-3′ | |||
| hsa-miR-200a | F: 5′-GGGGTAACACTGTCTGGTAG-3′ | 60 | 63 |
| R: 5′-TGCGTGTCGTGGAGTC-3′ | |||
| hsa-miR-200b | F: 5′-GGGGTAATACTGCCTGGT-3′ | 60 | 63 |
| R: 5′-TGCGTGTCGTGGAGTC-3′ | |||
| hsa-miR-200c | F: 5′-GGTAATACTGCCGGGTAAT-3′ | 60 | 65 |
| R: 5′-CAGTGCGTGTCGTGGAGT-3′ | |||
| hsa-miR-141 | F: 5′-GGGGTAACACTGTCTGGTAA-3′ | 60 | 63 |
| R: 5′-TGCGTGTCGTGGAGTC-3′ | |||
| hsa-miR-429 | F: 5′-GGGGGTAATACTGTCTGGT-3′ | 60 | 64 |
| R: 5′-TGCGTGTCGTGGAGTC-3′ |
Transfections and Luciferase Assays
pGL3-Basic vector containing the −1574 to +120-bp region of the miR-200b-a-429 promoter and its truncated mutants was kindly supplied by Gregory J. Goodall (18). pGL3-Basic vector containing the miR-200c-141 promoter, the putative p53-response elements (WT-Luc), and its p53-response element mutant (Mut-Luc) was kindly supplied by Mien-Chie Hung (14). The pGL3-Basic vector containing the miR-200b-a-429 promoter (−158 to +19 bp) and two E-box sites (CACCTG) served as a wild-type construct for the generation of the miR-200b-a-429-Luc construct, which harbors mutations in the two E-box sites (CACCGG) via PCR-based site-directed mutagenesis. Transfection of the luciferase reporters with different miR-200 promoters and luciferase assays were performed as described in our previous report (19).
Chromatin Immunoprecipitation (ChIP) Assay
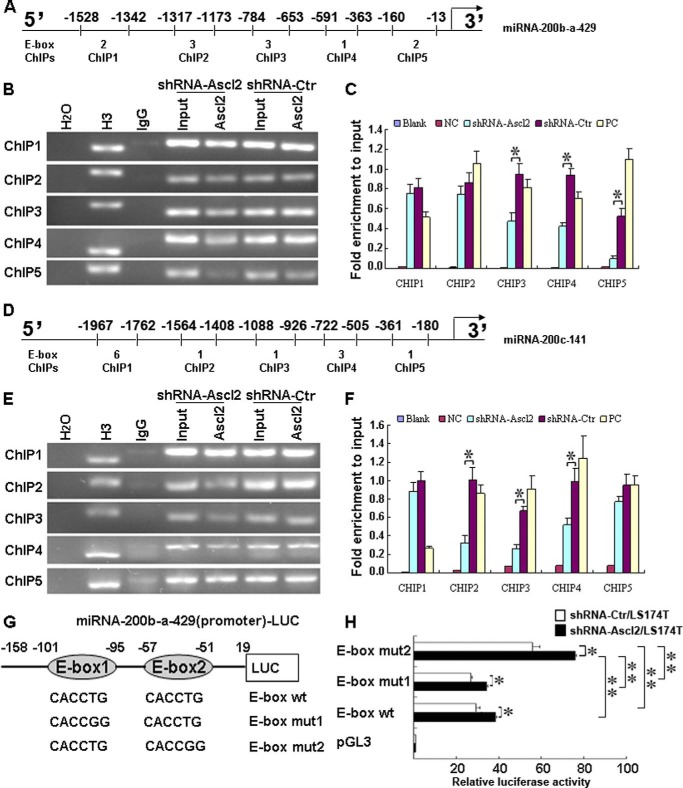
ChIP assays were performed using a ChIP assay kit (Upstate Biotechnology, Lake Placid, NY) according to the manufacturer's instructions. Soluble chromatin was prepared from shRNA-Ascl2/LS174T cells or shRNA-Ctr/LS174T cells. Chromatin was immunoprecipitated with an antibody against Ascl2. The final DNA extracts were amplified by PCR using primer pairs that included different numbers of the E-box consensus sequence in the human miR-200b-a-429 promoter or the miR-200c-141 promoter (see Fig. 4, A and D). The primer sequences and the length of the amplified PCR products are presented in Tables 5 and 6.
FIGURE 4.
Ascl2 bound to human miR-200b-a-429 or miR-200c-141 promoter in response to Ascl2 knockdown. Chromatin isolated from shRNA-Ascl2/LS174T cells or shRNA-Ctr/LS174T cells was subjected to immunoprecipitation using H2O (negative control), an IgG antibody (negative control), an anti-histone H3 antibody (mAb) (positive control), and a mouse monoclonal IgG against Ascl2 (Millipore, MAB4418). The Input represents 10% of the DNA used in the immunoprecipitation. Five sites in the miR-200b-a-429 and miR-200c-141 promoters with different numbers of E-box elements (ChIP1–5) were tested (A and D). The final DNA extracts were PCR-amplified using primers (B and E). In C and F, the enrichment of the indicated genomic DNA fragments (ChIP1–5), the intergenic control (PC), or unspecific binding (blank and negative control (NC)) was determined relative to the diluted input in three independent experiments. G, schematic representation of the miR-200b-a-429 promoter-Luc construct (−158 to +19), which contains two E-boxes, and its mutants. shRNA-Ascl2/LS174T cells or shRNA-Ctr/LS174T cells were transfected with the miR-200b-a-429 promoter-Luc construct (−158 to +19) and its mutants to identify the sites of transcriptional regulation by Ascl2 (H) (*, p < 0.05; **, p < 0.01). Error bars represent S.D.
TABLE 5.
The primer sequences used in the ChIP experiment of miR-200b-a-429 promoter
| ChIP | Primer pairs | Length of products |
|---|---|---|
| bp | ||
| ChIP1 | Forward: 5′-AGCCCCAGGGAAGCTTGACT-3′ | 187 |
| Reverse: 5′-CCCACTACCCGCACGC-3′ | ||
| ChIP2 | Forward: 5′-AGCCTTCTCCCACTTGGATG-3′ | 145 |
| Reverse: 5′-TGCCCACTCAGGTGTCTGT-3′ | ||
| ChIP3 | Forward: 5′-CCAGGGGCTCCAAAGTAACC-3′ | 132 |
| Reverse: 5′-CACAGCTGGGGGAATGAGG-3′ | ||
| ChIP4 | Forward: 5′-CGAGCCCCTGGCGAGGAG-3′ | 229 |
| Reverse: 5′-GCCTTAGAAGCGGGTAGGGT-3′ | ||
| ChIP5 | Forward: 5′-GGGCCTGCGTCACCGTCACT-3′ | 148 |
| Reverse: 5′-GGGGCTCGCCTTACAAGGA-3′ | ||
| ChIP for positive control (GAPDH) | Forward: 5′-TACTAGCGGTTTTACGGGCG-3′ | 166 |
| Reverse: 5′-TCGAACAGGAGGAGCAGAGAGCGA-3′ |
TABLE 6.
The primer sequences used in the ChIP experiment of miR-200c-141 promoter
| ChIP | Primer pairs | Length of products |
|---|---|---|
| bp | ||
| ChIP1 | Forward: 5′-CTGGAGTGGAGCAAGCGATG-3′ | 206 |
| Reverse: 5′-CTGTCGGGACCGCTGTG-3′ | ||
| ChIP2 | Forward: 5′-CTTTTCGCCGAGACTGG-3′ | 157 |
| Reverse: 5′-AGGGGCACTGAGGAGCATTG-3′ | ||
| ChIP3 | Forward: 5′-CGTCCCCCACTACAGTGTAA-3′ | 163 |
| Reverse: 5′-TCGGAATTTGGAGGTATCGG-3′ | ||
| ChIP4 | Forward: 5′-CCCCTTGTCCATACCTG-3′ | 218 |
| Reverse: 5′-TGGCAAGGTCAACAGCTAAG-3′ | ||
| ChIP5 | Forward: 5′-CCCTGGATCTTCCCGTCAGC-3′ | 182 |
| Reverse: 5′-CAGGCAAGGGCGAGGAC-3′ | ||
| ChIP for positive control (GAPDH) | Forward: 5′-TACTAGCGGTTTTACGGGCG-3′ | 166 |
| Reverse: 5′-TCGAACAGGAGGAGCAGAGAGCGA-3′ |
Transfection of miRNA Inhibitors into shRNA-Ascl2/LS174T Cells
The shRNA-Ascl2/LS174T cells were transfected 24 h after being seeded in 6-well plates. miRNA inhibitors (200 pmol) (Guangzhou Ribobio Co., Ltd. Guangzhou, China) were suspended in 250 μl of serum-free, antibiotic-free medium; mixed with 5 μl of Lipofectamine 2000 transfection reagent (Invitrogen) that was dissolved in 245 μl of the same medium; and allowed to stand at room temperature for 20 min. The resulting 500-μl transfection solutions were added to each well, which contained 1.5 ml of medium. Six hours later, the medium was removed from each well and replaced with 2 ml of fresh medium supplemented with 10% FBS. After an additional 48 h of incubation, the transiently transfected cells were collected for further experiments, including real time PCR, Western blot analysis, colony formation assays, invasion assays, and migration analysis. shRNA-Ascl2/LS174T cells transiently transfected with the miRNA inhibitor negative control (200 pmol) were used as a control.
Statistical Analysis
For continuous variables, the data are expressed as the mean ± S.D. Differences between groups were estimated using Student's t test and repeated measures analysis of variance analysis. All differences were deemed significant when p was <0.05 and very significant when p was <0.01. The correlation between Ascl2 mRNA levels and miR-200a, miR-200b, miR-200c, miR-141, or miR-429 levels in the cancerous samples was calculated by Spearman's rank correlation test. The statistical analyses were performed using the SPSS 13.0 for Windows software package.
RESULTS
Ascl2 Interference Led to the Reversal of EMT
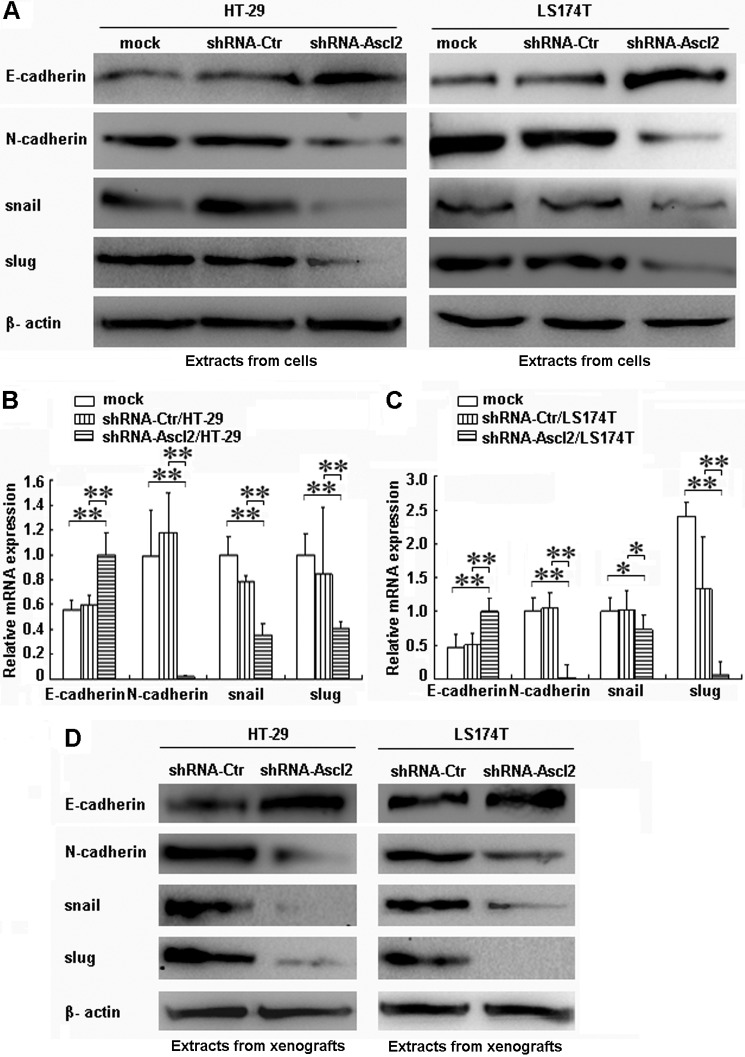
Compared with control cells, Ascl2 knockdown in both HT-29 cells and LS174T cells increased the protein and mRNA levels of E-cadherin, a known epithelial marker (p < 0.01) (Fig. 1, A–C), and decreased the protein and mRNA levels of N-cadherin, snail, and slug, which are known mesenchymal markers (p < 0.01) (Fig. 1, A–C). The protein level of the epithelial marker E-cadherin was increased, but the mesenchymal markers N-cadherin, snail, and slug were reduced in tumor xenografts developed from shRNA-Ascl2/HT-29 or shRNA-Ascl2/LS174T cells compared with tumor xenografts developed from shRNA-Ctr/HT-29 cells or shRNA-Ctr/LS174T cells (Fig. 1D).
FIGURE 1.
The induction of E-cadherin and the repression of N-cadherin, snail, and slug in shRNA-Ascl2/HT-29 cells or shRNA-Ascl2/LS174T cells and their tumor xenografts indicate the reversal of EMT. Ascl2 knockdown in HT-29 cells or LS174T cells increased the protein and mRNA levels of E-cadherin and reduced the protein and mRNA levels of N-cadherin, snail, and slug (A–C). The protein and/or mRNA levels in the tumor xenografts developed from shRNA-Ascl2/HT-29 cells or shRNA-Ascl2/LS174T cells displayed changes similar to those observed in the corresponding cells (D). β-Actin was used as a loading control (*, p < 0.05; **, p < 0.01). Error bars represent S.D.
Ascl2 Knockdown Affected miRNA Expression Profiles in Colon Cancer Cells
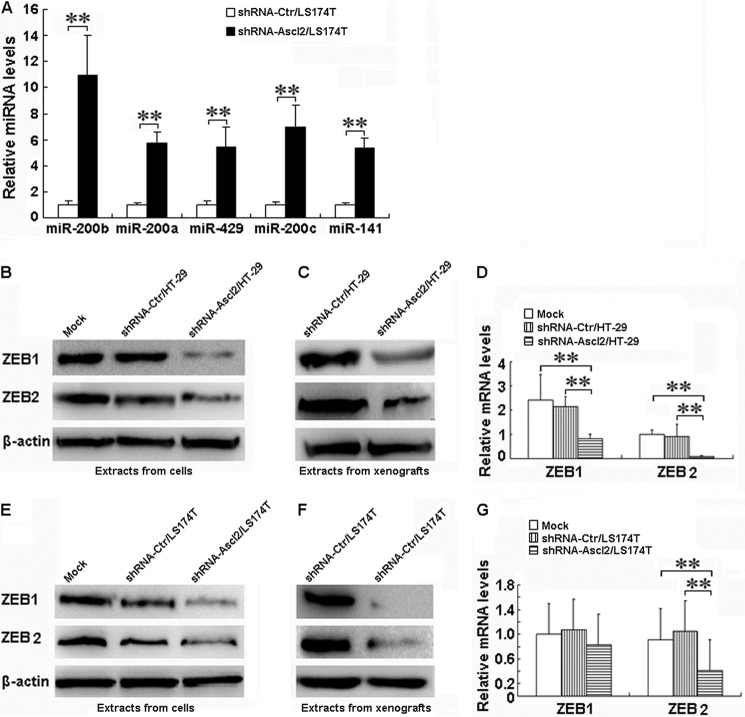
We have shown previously that miR-200b, miR-200a, miR-429, miR-200c, and miR-141 (17), which are involved in EMT modulation, are significantly 5–10-fold up-regulated based on an miRNA array in shRNA-Ascl2/LS174T cells (Gene Expression Omnibus (GEO) accession number GSE34926). To confirm that Ascl2 mediated the up-regulation of miRNA diversity, the expression levels of miR-200b, miR-200a, miR-429, miR-200c, and miR-141 were quantified using quantitative real time PCR analysis. As shown in Fig. 2A, the levels of miR-200b, miR-200a, miR-429, miR-200c, and miR-141 relative to the control (U6) were significantly higher in the shRNA-Ascl2/LS174T cells than in the shRNA-Ctr/LS174T cells (p < 0.01).
FIGURE 2.
Ascl2 knockdown in LS174T cells increased miR-200 family expression and reduced ZEB1 and ZEB2 levels in both shRNA-Ascl2/HT-29 cells and shRNA-Ascl2/LS174T cells. The quantitative real time PCR experiments demonstrated an increase in the expression of miR-200 family members in shRNA-Ascl2/LS174T cells compared with shRNA-Ctr/LS174T cells (**, p < 0.01) (A). The protein levels of ZEB1 and ZEB2 in both shRNA-Ascl2/HT-29 cells (B) and shRNA-Ascl2/LS174T cells (E) were reduced compared with control cells; ZEB1 and ZEB2 proteins in tumor xenografts developed from shRNA-Ascl2/HT-29 cells (C) and shRNA-Ascl2/LS174T cells (F) were reduced compared with the control. The mRNA levels of ZEB2 in both shRNA-Ascl2/HT-29 cells and shRNA-Ascl2/LS174T cells were significantly reduced compared with control cells (p < 0.01), and the mRNA level of ZEB1 in shRNA-Ascl2/HT-29 cells was significantly reduced compared with control cells (p < 0.01) (D and G). Error bars represent S.D.
Ascl2 Knockdown Inhibits ZEB1/ZEB2 Expression in Colon Cancer Cells
The miR-200s/ZEB double negative feedback loop was recently implicated in the modulation of EMT (18). Furthermore, we confirmed that the protein levels of ZEB1 and ZEB2 in both shRNA-Ascl2/HT-29 cells and shRNA-Ascl2/LS174T cells were significantly reduced compared with control cells (Fig. 2, B and E). Similarly, the protein levels of ZEB1 and ZEB2 in tumor xenografts developed from shRNA-Ascl2/HT-29 cells or shRNA-Ascl2/LS174T cells were significantly reduced compared with tumor xenografts developed from shRNA-Ctr/HT-29 cells or shRNA-Ctr/LS174T cells (Fig. 2, C and F), the mRNA levels of ZEB2 in both shRNA-Ascl2/HT-29 cells and shRNA-Ascl2/LS174T cells were significantly reduced compared with control cells (p < 0.01), and the mRNA level of ZEB1 in shRNA-Ascl2/HT-29 cells was significantly reduced compared with control cells (p < 0.01). However, no significant difference of ZEB1 mRNA expression among the shRNA-Ascl2/LS174T cells, shRNA-Ctr/LS174T cells, and LS174T cells was found (p > 0.05) (Fig. 2, D and G).
Ascl2 Knockdown Transcriptionally Activated miR-200b-a-429 and miR-200c-141
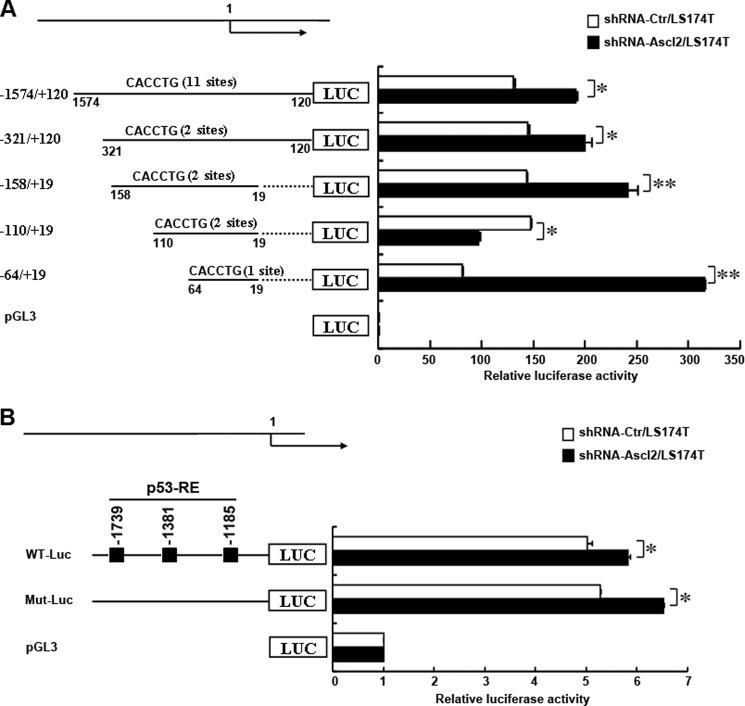
It remains unclear whether Ascl2 knockdown-activated miR-200b-a-429 and miR-200c-141 gene expression occurs via a transcriptional mechanism. Thus, we analyzed a cohort of transcription factor response elements located within the 1574-bp region upstream of the transcription start site of the human miR-200b-a-429 gene using promoter analysis. As we found that up-regulation of miR-200 family members occurred mainly in shRNA-Ascl2/LS174T cells (Fig. 2B), that LS174T cells demonstrated neoplastic properties by producing high levels of carcinoembryonic antigen, and that carcinoembryonic antigen production by LS174T cells released 900 times more carcinoembryonic antigen per cell into the culture medium and bore 30 times more cell-associated material than HT-29 cells, we performed further experiments using only shRNA-Ascl2/LS174T cells (20). As shown in Fig. 3A, we compared the ability of truncated promoters to drive human miR-200b-a-429 expression in shRNA-Ascl2/LS174T cells and shRNA-Ctr/LS174T cells using the pGL3-Basic firefly luciferase reporter containing different truncated versions of the human miR-200b-a-429 promoter encompassing −1574 to +19 relative to the putative TSS. Compared with shRNA-Ctr/LS174T cells, significantly higher luciferase activity was observed in shRNA-Ascl2/LS174T cells when using the pGL3-miR-200b-a-429 promoter encompassing −1574 to +120 relative to the putative TSS (p < 0.05), the pGL3-miR-200b-a-429 promoter encompassing −321 to +120 relative to the putative TSS (p < 0.05), the pGL3-miR-200b-a-429 promoter encompassing −158 to +19 relative to the putative TSS (p < 0.01), and the pGL3-miR-200b-a-429 promoter encompassing −64 to +19 relative to the putative TSS (p < 0.05). These results indicated that multiple elements located between −1574 and −321, between −321 and −158, between −158 and −110, and between −64 and +19 contributed to the activity of the miR-200b-a-429 promoter in shRNA-Ascl2/LS174T cells relative to shRNA-Ctr/LS174T cells. The findings suggest that Ascl2 functions as a transcriptional repressor for miR-200b-a-429 expression in colon cancer cells. In contrast, the elements between −110 and −64 negatively affected the activity of the miR-200b-a-429 promoter in shRNA-Ascl2/LS174T cells relative to shRNA-Ctr/LS174T cells.
FIGURE 3.
Transcriptional regulation of human miR-200b-a-429 and miR-200c-141 by Ascl2. A, schematic representation of the human miR-200b-a-429 promoter constructs that were transfected into shRNA-Ascl2/LS174T cells or shRNA-Ctr/LS174T cells in this study. Four promoter deletion-luciferase constructs were generated to identify the sites of transcriptional regulation within the human miR-200b-a-429 promoter that respond to Ascl2 knockdown (A). B, schematic representation of the human miR-200c-141 promoter construct (WT-Luc) and the p53-response element mutant construct (Mut-Luc) transfected into shRNA-Ascl2/LS174T cells or shRNA-Ctr/LS174T cells to identify the sites of transcriptional regulation within the human miR-200c-141 promoter that respond to Ascl2 knockdown. The cells were harvested after 48 h, and the relative luciferase activity was determined using the Dual-Luciferase reporter assay system with a single sample luminometer. The data represent the mean ± S.E. of three independent experiments (*, p < 0.05; **, p < 0.01). Error bars represent S.D.
The luciferase reporter driven by the wild-type human miR-200c-141 promoter or the p53-response element mutant generated a significantly higher level of luciferase activity in shRNA-Ascl2/LS174T cells than in shRNA-Ctr/LS174T cells (Fig. 3B). This finding suggests that Ascl2 functions as a transcriptional repressor for miR-200c-141 expression in colon cancer cells independently of p53-response elements within the human miR-200c-141 promoter.
ChIP Assays Indicated That Ascl2 Bound to the miR-200b-a-429 and miR-200c-141 Promoters and That Binding Was Reduced in shRNA-Ascl2/LS174T Cells Compared with shRNA-Ctr/LS174T Cells
We performed ChIP assays to determine whether Ascl2 could bind directly to the potential binding sites in the miR-200b-a-429 or miR-200c-141 promoter and whether Ascl2 binding decreased due to Ascl2 interference in LS174T cells. As shown in Fig. 4, A and D, there are different numbers of E-boxes in the proximal promoters of the miR-200b-a-429 and miR-200c-141 genes. The binding of Ascl2 to the proximal promoters of the miR-200b-a-429 and miR-200c-141 genes was determined compared with negative controls with clear evidence of Ascl2 binding to these proximal promoters based on ChIP1–5 experiments (Fig. 4B). Experiments ChIP3–5 indicated that the binding of Ascl2 to its potential binding sites in the miR-200b-a-429 promoter was reduced in shRNA-Ascl2/LS174T cells compared with shRNA-Ctr/LS174T cells (Fig. 4E). Similarly, experiments ChIP2–4 indicated that the binding of Ascl2 to its potential binding sites in the miR-200c-141 promoter was reduced in shRNA-Ascl2/LS174T cells compared with shRNA-Ctr/LS174T cells (Fig. 4, E and F).
Mutation of the Most Proximal E-box in the miR-200b-a-429 Promoter Enhanced Its Transcription
Ascl1, a homolog of Ascl2, was previously reported to form hetero-oligomers with E12, a transcriptional regulator, and to bind to the muscle creatine kinase E-box with high affinity in vitro (21). This study inspired us to determine whether Ascl2 transcriptionally regulates the expression of miR-200 family members by binding to the E-boxes in their promoters. We chose to use the miR-200b-a-429 promoter-Luc construct (−158 to +19) in which there are two E-boxes to produce single E-box mutants (Fig. 4G). shRNA-Ascl2/LS174T cells or shRNA-Ctr/LS174T cells were transfected with the wild-type miR-200b-a-429 promoter-Luc construct (−158 to +19) and mutant constructs to identify the sites of transcriptional regulation by Ascl2. Cells expressing the luciferase reporter driven by the wild-type miR-200b-a-429 promoter-Luc construct (−158 to +19) and the mutant constructs had a significantly higher level of luciferase activity in shRNA-Ascl2/LS174T cells compared with shRNA-Ctr/LS174T cells. The construct with a mutation in the most proximal E-box (E-box mut2) showed significantly increased luciferase activity in shRNA-Ascl2/LS174T cells compared with the E-box WT and E-box mut1 constructs (p < 0.01). In contrast, a mutation in the other E-box (E-box mut1) did not affect luciferase activity in shRNA-Ascl2/LS174T cells or shRNA-Ctr/LS174T cells compared with E-box WT (Fig. 4H). This experiment indicates that the most proximal E-box (E-box mut2) in the proximal promoter of miR-200b-a-429 functions as a binding site for Ascl2 and that Ascl2 binding transcriptionally represses miR-200 family expression.
miR-200b, miR-200a, or miR-429 Inhibitor Led to EMT in shRNA-Ascl2/LS174T Cells
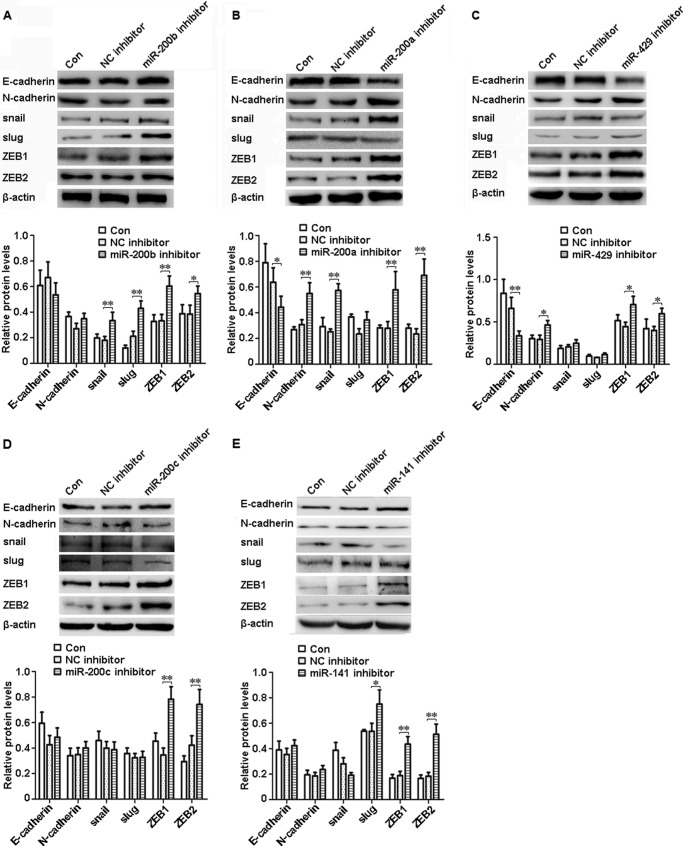
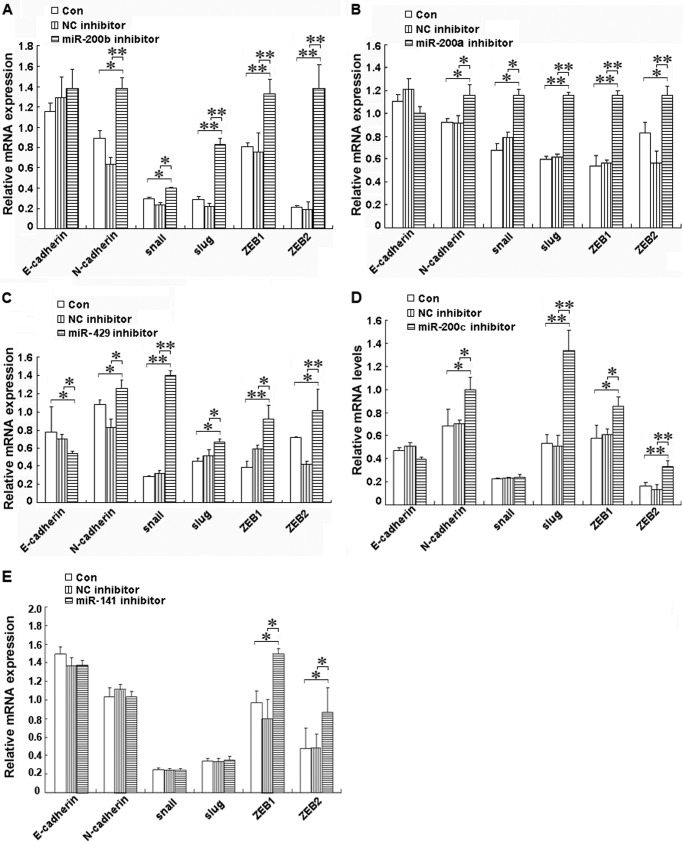
To determine how the miR-200s/ZEB double negative feedback loop mediates the role of Ascl2 in EMT-MET plasticity, we transfected miR-200b, miR-200a, or miR-429 inhibitor into shRNA-Ascl2/LS174T cells and observed whether EMT occurred. The protein levels of mesenchymal markers, including snail, slug, ZEB1, and ZEB2, were increased in the shRNA-Ascl2/LS174T cells transfected with the miR-200b inhibitor compared with the negative controls (Fig. 5A) (p < 0.05 or p < 0.01). The mRNA levels of these mesenchymal markers and N-cadherin were also significantly increased in these cells transfected with the miR-200b inhibitor compared with the negative controls (Fig. 6A) (p < 0.05 or p < 0.01). Conversely, the protein level of epithelial marker E-cadherin was reduced in shRNA-Ascl2/LS174T cells transfected with the miR-200a inhibitor compared with negative controls (p < 0.05). The protein levels of N-cadherin, snail, ZEB1, and ZEB2 (Fig. 5B) and the mRNA levels of N-cadherin, snail, slug, ZEB1, and ZEB2 (Fig. 6B) were significantly increased in the shRNA-Ascl2/LS174T cells transfected with the miR-200a inhibitor compared with the negative controls (p < 0.05 or p < 0.01). The miR-429 inhibitor-transfected shRNA-Ascl2/LS174T cells had reduced E-cadherin protein and mRNA levels and increased N-cadherin, snail, slug, ZEB1, and ZEB2 protein and mRNA levels (Figs. 5C and 6C) (p < 0.05 or p < 0.01).
FIGURE 5.
Transfection of shRNA-Ascl2/LS174T cells with miR-200 family member inhibitors increased the expression of mesenchymal markers or reduced the expression of epithelial markers as indicated by Western blotting. The protein levels of E-cadherin, N-cadherin, snail, slug, ZEB1, and ZEB2 in shRNA-Ascl2/LS174T cells transfected with the miR-200b inhibitor (A), miR-200a inhibitor (B), miR-429 inhibitor (C), miR-200c inhibitor (D), miR-141 inhibitor (E) or negative control, (NC) inhibitors and untransfected shRNA-Ascl2/LS174T cells (Con) were determined via Western blotting and further densitometric analysis. β-Actin was used as the control (*, p < 0.05; **, p < 0.01). Error bars represent S.D.
FIGURE 6.
Transient transfection of shRNA-Ascl2/LS174T cells with miR-200 family member inhibitors increased the expression of mesenchymal markers or reduced the expression of epithelial markers as indicated by quantitative real time PCR. The mRNA levels of E-cadherin, N-cadherin, snail, slug, ZEB1, and ZEB2 in shRNA-Ascl2/LS174T cells transfected with the miR-200b inhibitor (A), miR-200a inhibitor (B), miR-429 inhibitor (C), miR-200c inhibitor (D), miR-141 inhibitor (E), or negative control (NC) inhibitors and untransfected shRNA-Ascl2/LS174T cells (Con) were determined via real time PCR in three independent experiments. β-Actin was used as the control (*, p < 0.05; **, p < 0.01). Error bars represent S.D.
miR-200c or miR-141 Inhibitor Led to the Partial Reversal of MET in shRNA-Ascl2/LS174T Cells
The miR-200c inhibitor-transfected shRNA-Ascl2/LS174T cells showed increased ZEB1 and ZEB2 protein levels and increased N-cadherin, slug, ZEB1, and ZEB2 mRNA levels compared with the control cells (Figs. 5D and 6D) (p < 0.05 or p < 0.01). The miR-141 inhibitor-transfected shRNA-Ascl2/LS174T cells had increased slug, ZEB1, and ZEB2 protein levels and ZEB1 and ZEB2 mRNA levels compared with the control cells (Figs. 5E and 6E) (p < 0.05 or p < 0.01).
miR-200a or miR-429 Inhibitor Increased the Proliferation and Migration Abilities of shRNA-Ascl2/LS174T Cells
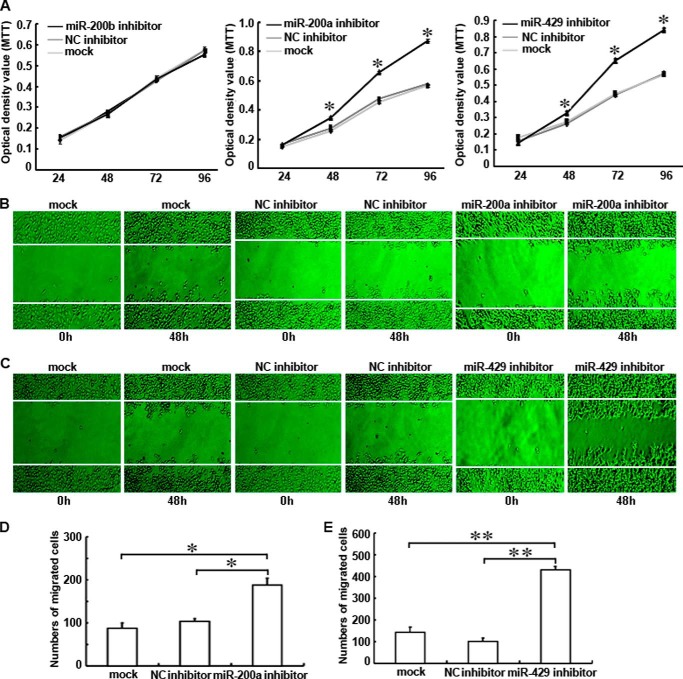
The transfections of shRNA-Ascl2/LS174T cells with miR-200a or miR-429 inhibitor significantly increased their proliferation between 48 and 96 h post-transfection compared with negative control inhibitors (Fig. 7A). However, no difference in proliferation was observed after the transfection of these cells with the miR-200b inhibitor. The number of cells migrating across a scraped edge was significantly higher for the shRNA-Ascl2/LS174T cells transfected with the miR-200a inhibitor than the untransfected shRNA-Ascl2/LS174T cells and shRNA-Ascl2/LS174T cells transfected with the negative control inhibitor (Fig. 7, B and D). The number of cells migrating across the scraped edge was significantly higher for the shRNA-Ascl2/LS174T cells transfected with the miR-429 inhibitor than the untransfected shRNA-Ascl2/LS174T cells and shRNA-Ascl2/LS174T cells transfected with the negative control inhibitor (Fig. 7, C and E). No difference was observed between the shRNA-Ascl2/LS174T cells transfected with the miR-200c or miR-141 inhibitor and their control cells (data not shown).
FIGURE 7.
Transient transfection of shRNA-Ascl2/LS174T cells with the miR-200a or miR-429 inhibitor increased the proliferation and migration of shRNA-Ascl2/LS174T cells. Transient transfection of the miR-200a inhibitor or the miR-429 inhibitor into shRNA-Ascl2/LS174T cells significantly increased proliferation between 48 and 96 h post-transfection compared with untreated shRNA-Ascl2/LS174T cells or negative control (NC) inhibitor-transfected shRNA-Ascl2/LS174T cells. Transfection of the miR-200b inhibitor into shRNA-Ascl2/LS174T cells did not have any effect on proliferation (A). The number of cells migrating across the scraped edge under magnification (200×) in shRNA-Ascl2/LS174T cultures transfected with the miR-200a inhibitor or the miR-429 inhibitor was significantly higher than that observed for untransfected shRNA-Ascl2/LS174T cells and negative control inhibitor-transfected shRNA-Ascl2/LS174T cells (B–E). Error bars represent S.D. MTT, 3-(4,5-dimethylthiazol-2-yl)-2,5-diphenyltetrazolium bromide.
Ascl2 Expression in Colorectal Cancer Was Related to Inhibition of miR-200 Cluster Expression
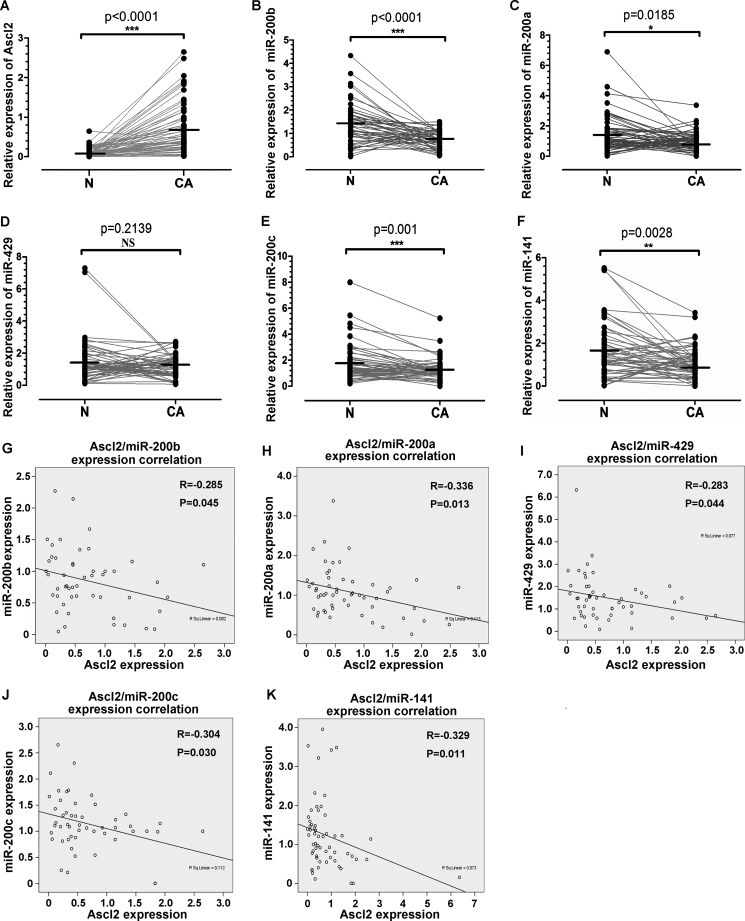
To verify whether Ascl2 can repress miR-200 cluster expression in human colorectal cancer, quantitative real time PCR was used to quantitate Ascl2 mRNA levels and miR-200 members in 50 colorectal cancer samples and their corresponding pericancerous mucosa obtained from colorectal cancer patients who underwent biopsy via colonoscopy (n = 34) or surgical resection (n = 16). We then analyzed the relationship between the level of Ascl2 mRNA and the levels of miR-200 members. The Ascl2 mRNA levels in the colon cancer samples were significantly higher than in the pericancerous mucosa (Fig. 8A) (p < 0.0001), whereas the expression levels of miR-200b (p < 0.0001), miR-200a (p = 0.0185), miR-200c (p = 0.001), and miR-141 (p = 0.0028) in the colon cancer samples were lower than in the pericancerous mucosa (Fig. 8, B, C, E, and F). The expression level of miR-429 in colon cancer was similar to that in pericancerous mucosa (Fig. 8D). Furthermore, the Ascl2 expression level in the colon cancer tissues was inversely correlated with the expression levels of miR-200b (p = 0.045), miR-200a (p = 0.013), miR-429 (p = 0.044), miR-200c (p = 0.030), and miR-141 (p = 0.011) (Fig. 8, G–K).
FIGURE 8.
Correlation between Ascl2 mRNA level and miR-200 family member levels in human colorectal carcinoma tissues. Quantitative real time PCR was performed in colon cancer tissues (CA) and their pericancerous mucosa (N) to quantitate Ascl2 mRNA levels and miR-200 family member levels. Ascl2 expression was higher in colon cancer samples (A), whereas miR-200b (B), miR-200a (C), miR-200c (E), and miR-141 (F) expression was lower in colon cancer samples; miR-429 (D) expression was at similar levels in colon cancer samples when compared with that in pericancerous mucosa. Ascl2 expression in colon cancer tissues was inversely correlated with miR-200b (G), miR-200a (H), miR-429 (I), miR-200c (J), or miR-141 (K) expression (*, p < 0.05; **, p < 0.01; ***, p < 0.001; NS, not significant).
Ascl2 Expression Level in Colon Cancer Was Related to the Clinicopathological Features of Patients
We compared the clinicopathological features in patients with a high Ascl2 mRNA expression level (relative Ascl2 expression level >0.455) and patients with a low Ascl2 mRNA expression level (relative Ascl2 expression level ≤0.455) in the cancerous tissues. The result indicated that more patients with a high Ascl2 mRNA level in the cancerous tissues had lymph node metastasis (p = 0.011) and were at the late stages (III-IV) (p = 0.025) when compared with the patients with a low Ascl2 mRNA level in the cancerous tissues. But there was no relationship between the Ascl2 mRNA level in the cancerous tissues and patients' age, gender, tumor size, tumor differentiation, invasion depth, and distal metastasis (Table 7).
TABLE 7.
Relationship between Ascl2 expression level in colon cancer tissues and the patients' clinicopathological features
| Variables | Numbers | Low Ascl2 level (≤0.455) | High Ascl2 level (>0.455) |
|---|---|---|---|
| Age | |||
| <65 | 30 | 13 | 17 |
| ≥65 | 20 | 11 | 9 |
| p value | 0.419 | ||
| Gender | |||
| Male | 28 | 12 | 16 |
| Female | 22 | 12 | 20 |
| p value | 0.673 | ||
| Tumor size | |||
| <5 cm | 30 | 16 | 14 |
| ≥5 cm | 20 | 8 | 12 |
| p value | 0.355 | ||
| Differentiation | |||
| Low | 10 | 3 | 7 |
| Well/moderate | 40 | 21 | 19 |
| p value | 0.358 | ||
| Depth of invasion | |||
| T1 + T2 | 6 | 3 | 3 |
| T3 + T4 | 44 | 21 | 23 |
| p value | 1 | ||
| Lymph node metastasis | |||
| Absent | 24 | 16 | 8 |
| Present | 26 | 8 | 18 |
| p value | 0.011 | ||
| Distal metastasis | |||
| Absent | 43 | 22 | 21 |
| Present | 7 | 2 | 5 |
| p value | 0.483 | ||
| Clinical stages | |||
| I-II | 23 | 15 | 8 |
| III-IV | 27 | 9 | 18 |
| p value | 0.025 | ||
DISCUSSION
Ascl2 is a transcription factor responsible for the differentiation of the trophoblast lineage in normal placenta (22). van der Flier et al. (6) first reported that Ascl2 is specifically expressed in Lgr5-positive stem cells in the crypt base and that Ascl2 controls the fate of these cells. Additionally, in vitro data suggest that decreased expression of Ascl2 in HT-29 cells via Ascl2 interference results in arrest at the G2/M cell cycle checkpoint (6). We previously demonstrated that the selective blockade of Ascl2 expression in HT-29 cells and LS174T cells results in tumor growth arrest both in vitro and in vivo possibly via the miR-302b-related inhibition of colon cancer progenitor cells (17).
In this study, we first demonstrated that the selective blockade of Ascl2 expression in HT-29 cells and LS174T cells led to EMT reversal, induced miR-200 family member expression, and inhibited ZEB1 and ZEB2 expression. We performed a promoter analysis, ChIP experiments, and E-box mutagenesis experiments on the miR-200b-a-429 promoter to identify the mechanism by which Ascl2 regulates the transcription of the miR-200 family. In addition, we systematically investigated inhibitors of the miR-200 family in shRNA-Ascl2/LS174 cells within the context of EMT and MET induced by Ascl2 interference (Fig. 9). To our knowledge, this is the first study to directly analyze the transcriptional regulation of the miR-200 family by Ascl2 and to investigate the link between this process and the regulation of plasticity between epithelial and mesenchymal features in colon cancer cells (Fig. 9).
FIGURE 9.
Schematic representation of Ascl2 functions in colon cancer cells. The left part shown in solid lines indicates the mechanism in which the up-regulated Ascl2 in colon cancer leads to EMT; the right part shown in dashed lines indicates the mechanism in which the knockdown of Ascl2 in colon cancer cells leads to MET.
In clinical studies, higher levels of Ascl2 expression are associated with liver metastasis in colon cancer patients (8). Several Ascl2 target genes were found to be up-regulated in this subgroup of liver metastasis, including the intestinal stem cell marker OLFM4 (8). de Sousa E Melo et al. found that promoter methylation of WNT target genes, including Ascl2, is a strong predictor of the recurrence of colorectal cancer and suggested that cancer stem cell gene signatures, rather than reflecting cancer stem cell numbers, may reflect the differentiation status of the malignant tissue (4). Aberrant up-regulation of Ascl2 via promoter demethylation promotes growth and resistance to 5-fluorouracil in gastric cancer cells. In contrast, ectopic Ascl2 overexpression does not accelerate tumorigenesis in Apc(Min) mice (23). In vitro data suggest that Ascl2 promotes progression through the G2/M cell cycle checkpoint and that Ascl2 is a regulator of proliferation that is overexpressed in intestinal neoplasia (6). Although these findings were recently reported within the context of the oncogenesis of colorectal cancer, the biological roles of Ascl2 and its regulation remain largely unclear.
Ascl2 knockdown in colon cancer cells dramatically increased miR-200 family member expression, including miR-200a, -200b, -200c, -141, and -429 (17). miRNAs are important regulators of mRNAs at the post-transcriptional level and act by targeting mRNAs for cleavage or translational repression (24), and they have emerged as important developmental regulators that control critical processes, such as cell fate determination and cell death. For example, miR-200s inhibit EMT in several cancers by inhibiting the transcription factors ZEB1 and ZEB2 (25, 26). In this report, the knockdown of Ascl2 in colon cancer cell lines inhibited the expression of both ZEB1 and ZEB2. According to the previously identified ZEB/miR-200 feedback loop, ZEB1 and ZEB2 inhibition could be mediated by the up-regulation of miR-200 family members due to Ascl2 knockdown (27).
Importantly, we are the first to demonstrate that Ascl2 can bind directly to the E-box element present in the promoters of miR-200b-a-429 and miR-200c-141. Ascl2 likely binds to the most proximal E-box (i.e. E-box2) in the promoter of miR-200b-a-429 and significantly represses miR-200b-a-429 and miR-200c-141 transcriptional expression. Thus, in Ascl2 interfered LS174T cells, miR-200 family members are activated due to the loss of Ascl2-related transcriptional repression, further inhibiting ZEB1 and ZEB2 expression and resulting in the reversal of EMT. It has been reported recently that the miR-200/ZEB double negative feedback loop controls EMT and MET programs in both development and tumorigenesis and that the miR-200/ZEB loop is an integral part of the signaling pathways that are mutationally activated at early (e.g. WNT, RAS, and Notch) or late (e.g. TGFβ, p53, and Retinoblastoma (Rb) protein) stages of tumor growth (28). Most recently, several factors have been found to regulate miR-200 expression. For example, p53 regulates miR-200c-141 expression and mediates EMT-MET and stemness plasticity (14, 28). Samd3, WASF3, DCAMKL-1, and PELP1/HDAC2 regulate EMT via a miR-200-dependent mechanism (29–33). Ascl2 plays critical roles in regulating EMT-MET plasticity via the transcriptional regulation of miR-200 expression.
We demonstrated the importance of the Ascl2/miR-200/ZEB axis in modulating EMT-MET plasticity of colon cancer cells. Ascl2 interfered colon cancer cells were exposed to commercial miR-200 inhibitors to target induced miR-200 family members, the mesenchymal features of colon cancer cells, including mesenchymal markers and cellular behavior, reversibly appeared. We propose a consolidated model for the events that orchestrate the carcinogenesis of colon cancer. This model highlights the potential roles of Ascl2/miR-200/ZEB in regulating symmetrical molecular events during sequential EMT and MET processes (Fig. 9).
Furthermore, we discovered that Ascl2 was increasingly expressed in colon cancer samples and that miR-200b, miR-200a, miR-200c, and miR-141 were decreasingly expressed in colon cancer samples when compared with pericancerous colon mucosa. Interestingly, Ascl2 expression in colon cancer tissues was inversely correlated with the expression of miR-200 family members, a result that was consistent with the observations in cell lines. And relative Ascl2 mRNA expression levels in colon cancer tissues were related to the lymph node metastasis and clinical stages of patients.
Taken together, these results suggest that targeting Ascl2 may help to reverse EMT, thereby preventing cancer progression. Future investigations are needed to evaluate the efficacy of Ascl2 inhibitors in the prevention of colon cancer metastasis and recurrence.
Acknowledgments
We thank Mien-Chie Hung and Dr. Gregory J. Goodall for the pGL3-Basic vectors containing the miR-200 promoters.
This work was supported by National Natural Science Foundation of China Grants 81201685 (to R. Z.), 81200268 (to J. Z.), and 81170340 and 81372557 (to R. W.) and the Program for Changjiang Scholars and Innovative Research Team at the Third Military Medical University (Grant IRT 13050).
- EMT
- epithelial-mesenchymal transition
- Ascl
- Achaete scute-like
- MET
- mesenchymal-epithelial transition
- miRNA
- microRNA, miR, miRNA
- TSS
- transcription start site
- Luc
- luciferase.
REFERENCES
- 1. Gangemi R. M., Griffero F., Marubbi D., Perera M., Capra M. C., Malatesta P., Ravetti G. L., Zona G. L., Daga A., Corte G. (2009) SOX2 silencing in glioblastoma tumor-initiating cells causes stop of proliferation and loss of tumorigenicity. Stem Cells 27, 40–48 [DOI] [PubMed] [Google Scholar]
- 2. Todaro M., Alea M. P., Di Stefano A. B., Cammareri P., Vermeulen L., Iovino F., Tripodo C., Russo A., Gulotta G., Medema J. P., Stassi G. (2007) Colon cancer stem cells dictate tumor growth and resist cell death by production of interleukin-4. Cell Stem Cell 1, 389–402 [DOI] [PubMed] [Google Scholar]
- 3. Clevers H. (2011) The cancer stem cell: premises, promises and challenges. Nat. Med. 17, 313–319 [DOI] [PubMed] [Google Scholar]
- 4. de Sousa E Melo F., Colak S., Buikhuisen J., Koster J., Cameron K., de Jong J. H., Tuynman J. B., Prasetyanti P. R., Fessler E., van den Bergh S. P., Rodermond H., Dekker E., van der Loos C. M., Pals S. T., van de Vijver M. J., Versteeg R., Richel D. J., Vermeulen L., Medema J. P. (2011) Methylation of cancer-stem-cell-associated Wnt target genes predicts poor prognosis in colorectal cancer patients. Cell Stem Cell 9, 476–485 [DOI] [PubMed] [Google Scholar]
- 5. Jubb A. M., Chalasani S., Frantz G. D., Smits R., Grabsch H. I., Kavi V., Maughan N. J., Hillan K. J., Quirke P., Koeppen H. (2006) Achaete-scute like 2 (ascl2) is a target of Wnt signalling and is upregulated in intestinal neoplasia. Oncogene 25, 3445–3457 [DOI] [PubMed] [Google Scholar]
- 6. van der Flier L. G., van Gijn M. E., Hatzis P., Kujala P., Haegebarth A., Stange D. E., Begthel H., van den Born M., Guryev V., Oving I., van Es J. H., Barker N., Peters P. J., van de Wetering M., Clevers H. (2009) Transcription factor achaete scute-like 2 controls intestinal stem cell fate. Cell 136, 903–912 [DOI] [PubMed] [Google Scholar]
- 7. Jubb A. M., Hoeflich K. P., Haverty P. M., Wang J., Koeppen H. (2011) Ascl2 and 11p15.5 amplification in colorectal cancer. Gut 60, 1606–1607 [DOI] [PubMed] [Google Scholar]
- 8. Stange D. E., Engel F., Longerich T., Koo B. K., Koch M., Delhomme N., Aigner M., Toedt G., Schirmacher P., Lichter P., Weitz J., Radlwimmer B. (2010) Expression of an ASCL2 related stem cell signature and IGF2 in colorectal cancer liver metastases with 11p15.5 gain. Gut 59, 1236–1244 [DOI] [PubMed] [Google Scholar]
- 9. Nicoloso M. S., Spizzo R., Shimizu M., Rossi S., Calin G. A. (2009) MicroRNAs—the micro steering wheel of tumour metastases. Nat. Rev. Cancer 9, 293–302 [DOI] [PubMed] [Google Scholar]
- 10. Grassian A. R., Lin F., Barrett R., Liu Y., Jiang W., Korpal M., Astley H., Gitterman D., Henley T., Howes R., Levell J., Korn J. M., Pagliarini R. (2012) Isocitrate dehydrogenase (IDH) mutations promote a reversible ZEB1/microRNA (miR)-200-dependent epithelial-mesenchymal transition (EMT). J. Biol. Chem. 287, 42180–42194 [DOI] [PMC free article] [PubMed] [Google Scholar]
- 11. Cottonham C. L., Kaneko S., Xu L. (2010) miR-21 and miR-31 converge on TIAM1 to regulate migration and invasion of colon carcinoma cells. J. Biol. Chem. 285, 35293–35302 [DOI] [PMC free article] [PubMed] [Google Scholar]
- 12. Xiang X., Zhuang X., Ju S., Zhang S., Jiang H., Mu J., Zhang L., Miller D., Grizzle W., Zhang H. G. (2011) miR-155 promotes macroscopic tumor formation yet inhibits tumor dissemination from mammary fat pads to the lung by preventing EMT. Oncogene 30, 3440–3453 [DOI] [PMC free article] [PubMed] [Google Scholar]
- 13. Thiery J. P., Sleeman J. P. (2006) Complex networks orchestrate epithelial-mesenchymal transitions. Nat. Rev. Mol. Cell Biol. 7, 131–142 [DOI] [PubMed] [Google Scholar]
- 14. Chang C. J., Chao C. H., Xia W., Yang J. Y., Xiong Y., Li C. W., Yu W. H., Rehman S. K., Hsu J. L., Lee H. H., Liu M., Chen C. T., Yu D., Hung M. C. (2011) p53 regulates epithelial-mesenchymal transition and stem cell properties through modulating miRNAs. Nat. Cell Biol. 13, 317–323 [DOI] [PMC free article] [PubMed] [Google Scholar]
- 15. Hur K., Toiyama Y., Takahashi M., Balaguer F., Nagasaka T., Koike J., Hemmi H., Koi M., Boland C. R., Goel A. (2013) MicroRNA-200c modulates epithelial-to-mesenchymal transition (EMT) in human colorectal cancer metastasis. Gut 62, 1315–1326 [DOI] [PMC free article] [PubMed] [Google Scholar]
- 16. Edvardsson K., Nguyen-Vu T., Kalasekar S. M., Pontén F., Gustafsson J. Å., Williams C. (2013) Estrogen receptor beta expression induces changes in the microRNA pool in human colon cancer cells. Carcinogenesis 34, 1431–1441 [DOI] [PubMed] [Google Scholar]
- 17. Zhu R., Yang Y., Tian Y., Bai J., Zhang X., Li X., Peng Z., He Y., Chen L., Pan Q., Fang D., Chen W., Qian C., Bian X., Wang R. (2012) Ascl2 knockdown results in tumor growth arrest by miRNA-302b-related inhibition of colon cancer progenitor cells. PLoS One 7, e32170. [DOI] [PMC free article] [PubMed] [Google Scholar]
- 18. Bracken C. P., Gregory P. A., Kolesnikoff N., Bert A. G., Wang J., Shannon M. F., Goodall G. J. (2008) A double-negative feedback loop between ZEB1-SIP1 and the microRNA-200 family regulates epithelial-mesenchymal transition. Cancer Res. 68, 7846–7854 [DOI] [PubMed] [Google Scholar]
- 19. Pan Q., Tian Y., Li X., Ye J., Liu Y., Song L., Yang Y., Zhu R., He Y., Chen L., Chen W., Mao X., Peng Z., Wang R. (2013) Enhanced membrane-tethered mucin 3 (MUC3) expression by a tetrameric branched peptide with a conserved TFLK motif inhibits bacteria adherence. J. Biol. Chem. 288, 5407–5416 [DOI] [PMC free article] [PubMed] [Google Scholar]
- 20. Tom B. H., Rutzky L. P., Jakstys M. M., Oyasu R., Kaye C. I., Kahan B. D. (1976) Human colonic adenocarcinoma cells. I. Establishment and description of a new line. In Vitro 12, 180–191 [DOI] [PubMed] [Google Scholar]
- 21. Johnson J. E., Birren S. J., Saito T., Anderson D. J. (1992) DNA binding and transcriptional regulatory activity of mammalian achaete-scute homologous (MASH) proteins revealed by interaction with a muscle-specific enhancer. Proc. Natl. Acad. Sci. U.S.A. 89, 3596–3600 [DOI] [PMC free article] [PubMed] [Google Scholar]
- 22. Guillemot F., Nagy A., Auerbach A., Rossant J., Joyner A. L. (1994) Essential role of Mash-2 in extraembryonic development. Nature 371, 333–336 [DOI] [PubMed] [Google Scholar]
- 23. Reed K. R., Tunster S. J., Young M., Carrico A., John R. M., Clarke A. R. (2012) Entopic overexpression of Ascl2 does not accelerate tumourigenesis in ApcMin mice. Gut 61, 1435–1438 [DOI] [PubMed] [Google Scholar]
- 24. Bartel D. P. (2004) MicroRNAs: genomics, biogenesis, mechanism, and function. Cell 116, 281–297 [DOI] [PubMed] [Google Scholar]
- 25. Korpal M., Lee E. S., Hu G., Kang Y. (2008) The miR-200 family inhibits epithelial-mesenchymal transition and cancer cell migration by direct targeting of E-cadherin transcriptional repressors ZEB1 and ZEB2. J. Biol. Chem. 283, 14910–14914 [DOI] [PMC free article] [PubMed] [Google Scholar]
- 26. Gregory P. A., Bracken C. P., Smith E., Bert A. G., Wright J. A., Roslan S., Morris M., Wyatt L., Farshid G., Lim Y. Y., Lindeman G. J., Shannon M. F., Drew P. A., Khew-Goodall Y., Goodall G. J. (2011) An autocrine TGF-β/ZEB/miR-200 signaling network regulates establishment and maintenance of epithelial-mesenchymal transition. Mol. Biol. Cell 22, 1686–1698 [DOI] [PMC free article] [PubMed] [Google Scholar]
- 27. Hill L., Browne G., Tulchinsky E. (2013) ZEB/miR-200 feedback loop: at the crossroads of signal transduction in cancer. Int. J. Cancer 132, 745–754 [DOI] [PubMed] [Google Scholar]
- 28. Kim T., Veronese A., Pichiorri F., Lee T. J., Jeon Y. J., Volinia S., Pineau P., Marchio A., Palatini J., Suh S. S., Alder H., Liu C. G., Dejean A., Croce C. M. (2011) p53 regulates epithelial-mesenchymal transition through microRNAs targeting ZEB1 and ZEB2. J. Exp. Med. 208, 875–883 [DOI] [PMC free article] [PubMed] [Google Scholar]
- 29. Sureban S. M., May R., Lightfoot S. A., Hoskins A. B., Lerner M., Brackett D. J., Postier R. G., Ramanujam R., Mohammed A., Rao C. V., Wyche J. H., Anant S., Houchen C. W. (2011) DCAMKL-1 regulates epithelial-mesenchymal transition in human pancreatic cells through a miR-200a-dependent mechanism. Cancer Res. 71, 2328–2338 [DOI] [PMC free article] [PubMed] [Google Scholar]
- 30. Ziskin J. L., Dunlap D., Yaylaoglu M., Fodor I. K., Forrest W. F., Patel R., Ge N., Hutchins G. G., Pine J. K., Quirke P., Koeppen H., Jubb A. M. (2013) In situ validation of an intestinal stem cell signature in colorectal cancer. Gut 62, 1012–1023 [DOI] [PubMed] [Google Scholar]
- 31. Ahn S. M., Cha J. Y., Kim J., Kim D., Trang H. T., Kim Y. M., Cho Y. H., Park D., Hong S. (2012) Smad3 regulates E-cadherin via miRNA-200 pathway. Oncogene 31, 3051–3059 [DOI] [PubMed] [Google Scholar]
- 32. Roy S. S., Gonugunta V. K., Bandyopadhyay A., Rao M. K., Goodall G. J., Sun L. Z., Tekmal R. R., Vadlamudi R. K. (2014) Significance of PELP1/HDAC2/miR-200 regulatory network in EMT and metastasis of breast cancer. Oncogene 33, 3707–3716 [DOI] [PMC free article] [PubMed] [Google Scholar]
- 33. Teng Y., Mei Y., Hawthorn L., Cowell J. K. (2014) WASF3 regulates miR-200 inactivation by ZEB1 through suppression of KISS1 leading to increased invasiveness in breast cancer cells. Oncogene 33, 203–211 [DOI] [PMC free article] [PubMed] [Google Scholar]


