

Background: FGF2 isoforms have differential effects on bone and phosphate homeostasis.
Results: Knock-out of HMWFGF2 increased bone density and reduced bone Fgf23, Sost mRNA, and serum sclerostin.
Conclusion: HMWKO mice display increased bone mineralization and normal serum phosphate due to modulation of bone-related genes.
Significance: Modulation of HMWFGF2 could possibly be utilized in development of therapeutic targets to treat osteomalacia and phosphate disorders.
Keywords: Bone, Fibroblast Growth Factor (FGF), RNA, Transcription Regulation, Wnt Signaling
Abstract
We previously reported that targeted overexpression of the fibroblast growth factor 2 (FGF2) high molecular weight (HMW) isoforms in osteoblastic lineage cells in mice resulted in phenotypic changes, including dwarfism, rickets, osteomalacia, hypophosphatemia, increased serum parathyroid hormone, and increased levels of the phosphatonin FGF23 in serum and bone. This study examined the effects of genetically knocking out the FGF2HMW isoforms (HMWKO) on bone and phosphate homeostasis. HMWKO mice were not dwarfed and had significantly increased bone mineral density and bone mineral content in femurs and lumbar vertebrae when compared with the wild-type (WT) littermates. Micro-computed tomography analysis of femurs revealed increased trabecular bone volume, thickness, number, and connective tissue density with decreased trabecular spacing compared with WT. In addition, there was significantly decreased cortical porosity and increased cortical thickness and sub-periosteal area in femurs of HMWKO. Histomorphometric analysis demonstrated increased osteoblast activity and diminished osteoclast activity in the HMWKO. In vitro bone marrow stromal cell cultures showed there was a significant increase in alkaline phosphatase-positive colony number at 1 week in HMWKO. At 3 weeks of culture, the mineralized area was also significantly increased. There was increased expression of osteoblast differentiation marker genes and reduced expression of genes associated with impaired mineralization, including a significant reduction in Fgf23 and Sost mRNA. Normal serum phosphate and parathyroid hormone were observed in HMWKO mice. This study demonstrates a significant negative impact of HMWFGF2 on biological functions in bone and phosphate homeostasis in mice.
Introduction
Fibroblast growth factor 2 (FGF2), which is expressed in osteoblasts and stromal cells and then stored in the surrounding extracellular matrix (1), has a significant impact on bone formation through modulation of distinct signaling pathways that regulate osteoblast differentiation, matrix mineralization, and phosphate (Pi) homeostasis in mice. In humans, there are several FGF2 protein isoforms as follows: high molecular weight (HMW)3 isoforms (22, 22.5, and 24 kDa) and a low molecular weight (LMW/18 kDa) isoform (2). The LMW isoform is initiated from a traditional AUG start codon, whereas the HMW isoforms are translated from individual nonconventional CUG codons upstream of the LMW start site (3). In rodents, there are three isoforms as follows: two HMW isoforms (20.5 and 21 kDa) as well as a LMW isoform (17.5 kDa) (4). The HMW and LMW isoforms have differing biological functions in regulating bone homeostasis. The LMW isoform is transported out of the cell and functions as an autocrine/paracrine growth factor (5). When all of the FGF2 isoforms are overexpressed in mice, the mice displayed a dwarf phenotype (6) and had decreased bone mass and bone mineral density (BMD) (7). Interestingly, transgenic mice overexpressing only the LMW isoform in osteoblastic lineage cells had a significantly increased BMD and bone mass with normal serum phosphate (8). HMW isoforms have a nuclear localization sequence and remain in the nucleus to function as an intracrine factor (9). In contrast to LMWTg mice, HMWTg mice, overexpressing the HMW FGF2 isoforms in osteoblastic lineage, were significantly hypophosphatemic and had significantly decreased BMD and bone mass (10). Mechanistically, these differences were shown to be due, in part, to modulation of the Fgf23/Klotho signaling pathway (10). In vitro bone formation studies using bone marrow stromal cells (BMSCs) from HMWTg mice demonstrated a significant decrease in pro-osteoblast differentiation and mineralization gene expressions such as osterix, osteocalcin, and dentin matrix acidic phosphoprotein 1 (DMP1) as well as a significant increase in inhibitory matrix Gla protein (Mgp) and Fgf23 (11).
The phosphatonin, FGF23, plays an important role in bone and Pi homeostasis, is secreted by osteoblasts/osteocytes, and acts both locally (paracrine) and systemically (endocrine) (10, 12). As an endocrine hormone, FGF23 is released into the bloodstream, increases Pi wasting, and modulates vitamin D homeostasis via its effects on the kidneys (13). FGF23 signals in the kidney by interacting with Klotho (14), an anti-aging protein that is not found in bone, and FGF receptor(s) (15–17) to activate downstream signaling pathways, including the MAPK/ERK pathway (11). This in turn inhibits the expression of the sodium-phosphate transporter 2a (Npt2a) (18). The decrease in Npt2a results in reduced Pi reabsorption in the renal proximal tubules (19) resulting in both phosphaturia and hypophosphatemia. This results in less Pi being available for bone homeostasis and repair because phosphate is necessary to form hydroxyapatite, which is the mineral in bone (20). Pi balance is critical for proper bone formation. Overexpression of HMW FGF2, and consequently FGF23, lessens the body's ability to efficiently produce and repair bone tissue (10). FGF23, when overexpressed, has also been reported to negatively regulate bone formation independently of the Klotho pathway, which modulates Pi homeostasis (21). Therefore, the HMW FGF2 isoform may have a greater impact on bone homeostasis than on serum Pi levels.
The aims of our study were to characterize the phenotype of a murine model in which only the HMW isoforms of FGF2 were deleted and to more precisely determine the role of HMW FGF2 in bone formation and phosphate regulation. As stated previously and similar to humans, mice have both HMW and LMW isoforms of FGF2, although mice only have two HMW isoforms (21 and 22 kDa) (22). Of potential clinical relevance, we previously reported that the HMW isoforms were increased in bones of the Hyp mouse (10), a murine model of human X-linked hypophosphatemic rickets. Therefore, this study examined whether there were changes in the expression patterns of genes that are related to bone matrix abnormalities in human disorders such as X-linked hypophosphatemic rickets, as well as autosomal dominant and recessive hypophosphatemic rickets/osteomalacia, in the presence or absence of the HMW FGF2 isoforms. Mouse models of human phosphate wasting disorders include the Hyp mouse in which Phex gene is knocked out (X-linked hypophosphatemic rickets) (23), Dmp1 KO (autosomal recessive hypophosphatemic rickets) (24), and FGF23Tg (autosomal dominant hypophosphatemic rickets) (25) that mimic the human skeletal conditions. Phex, Dmp1, and Fgf23 all play important roles in the bone-renal axis (26). Dmp1 is a SIBLING (short integrin-binding ligand-interacting glycoprotein) that has an ASARM (acidic serine aspartate-rich MEPE-associated) motif, which interacts with Phex to down-regulate expression of Fgf23 (27). The MEPE-ASARM protein has been shown to competitively bind Phex, inhibiting Dmp1 activation (26). We also examined whether Mgp, the calcification inhibitor (28), was altered in bones of HMWKO mice, since we previously observed significantly elevated levels in bones of HMWTg mice (10). The results of this novel study show that mice in which the HMW isoforms are knocked out present with normal serum phosphate, significantly increased BMD and bone mineral content (BMC), as well as increased expression of bone mineralization factors and decreased expression of inhibitors of bone formation.
EXPERIMENTAL PROCEDURES
HMWFgf2KO Mice
The HMWKO mice were generated at the GEMM Core at the University of Arizona by gene-targeted introduction of polymorphisms to remove the alternative CUG codon start sites required to translate the HMW isoforms of FGF2 (29). Heterozygote HMWFgf2+/− mice that are maintained on a Black/Swiss/129 Sv background were bred and housed in the transgenic facility in the Center for Laboratory Animal Care at the University of Connecticut Health Center. Genotyping of mice was performed using a method described previously (29). The University of Connecticut Health Center, Institutional Animal Care and Use Committee, approved all animal procedures. Two-month-old male HMWKO mice and their WT littermates were used for this study. The mice were sacrificed utilizing the approved CO2 method of euthanasia.
Biochemistry
Blood was collected from euthanized animals by cardiac puncture. After clotting, the blood was spun, and serum was collected. Serum phosphate and calcium were measured using the Phosphorus Liqui-UV (StanBio Laboratory, TX) and CALCIUM (CPC) REAGENT SET (Eagle Diagnostics, Cedar Hill, TX), respectively. Serum FGF23 was measured using a kit purchased from Immunotopics Inc. (Carlsbad, CA), and serum PTH was determined using a mouse intact PTH enzyme-linked immunosorbent assay kit (Immunotopics) according to the manufacturer's instructions.
Faxitron X-ray
X-ray pictures of the whole mouse were taken using a SYSTEM MX 20 from Faxitron X-ray Corp. (Wheeling, IL). X-ray images were taken under constant conditions (25 kV, 20-s exposure at 4.5 magnification).
Dual Beam X-ray Absorptiometry
Dual beam x-ray absorptiometry imaging was performed using the LunarPIXImus2 (GE Medical Systems) densitometer to measure bone mineral density and bone mineral content for both in vivo and excised bones.
Micro-Computed Tomography (Micro-CT) Scanning of Femurs
Analysis of the metaphyseal cancellous bones of the distal femurs was performed as described previously (30) with micro-CT instrumentation (μCT20, Scanco Medical AG, Bassersdorf, Switzerland). Using two-dimensional data from scanned slices, three-dimensional analysis was conducted to calculate morphometric parameters defining micro-architecture, including bone volume density, bone volume (BV)/total volume (TV), trabecular number, trabecular thickness, trabecular spacing, connective tissue density, degree of anisotropy, sub-periosteal area, cortical mask, cortical porosity, and cortical thickness.
Bone Histomorphometry
Mice were labeled with calcein 7 days and xylenol orange 2 days prior to sacrifice, respectively. Femurs were isolated and fixed in 10% formalin. Bones were then placed overnight in 30% sucrose dissolved in PBS and embedded in Cryomatrix. The Cryomatrix block containing each undecalcified femur was oriented in the block holder to obtain a 7-μm longitudinal central section that includes the central vein. Sections were collected on a special cold adhesive tape Cryofilm type IIC (FINETEC Co. Ltd., Japan). Unstained tapes with samples were soaked in PBS for half an hour and then mounted in 50% glycerol in PBS for dynamic parameter analysis. Additional sections were stained for tartrate-resistant acid phosphatase to visualize osteoclasts and counterstained with hematoxylin. Histomorphometric measurements were made in a blinded, nonbiased manner using the OsteoMeasure image analysis system (R & M Biometrics, Nashville, TN) interfaced with a Nikon E400 microscope (Nikon Inc., Melville, NY). The terminology and units used are those recommended by the Histomorphometry Nomenclature Committee of the American Society for Bone and Mineral Research (31). Mineralizing surface/bone surface (MS/BS), the bone formation rate (BFR/BS), interlabel thickness, mineral apposition rate (MAR, μm/day), bone volume fraction (BV/TV), percent osteoblast surface, osteoclast surface, and osteoclast number/BS were measured. Osteoblasts were identified as cuboidal cells lining the trabecular bone. Osteoclasts were identified as multinucleated cells with more than three nuclei on the trabecular bone surface.
For cortical dynamic histomorphometry, longitudinal sections were used. Periosteal and endosteal parameters were measured along 1 mm, beginning 600 μm below the chondro-osseous junction on both lateral and medial sides of the distal femur (32). Parameters measured include MS/BS, MAR, BFR/BS.
BMSCs Culture
BMSCs were extracted from excised tibial bones as described previously (11). BMSCs were plated in 6-well dishes at 2 million/well with 2 ml of minimum essential medium α (Invitrogen) + 10% FBS + penicillin/streptomycin. On day 3, the media were changed to minimum essential medium α + 10% FBS + 50 μm ascorbic acid + 4 mm β-glycerophosphate. The medium was changed every other day. These cells were cultured for 7, 14, or 21 days before takedown. The fixed cultures were stained with alkaline phosphatase (ALP) according to the manufacturer's instructions. After plates were scanned, the plates were counter-stained for mineral by von Kossa stains. The HMWKO and WT wells were compared and analyzed using ImageJ (version 1.61, National Institutes of Health, Bethesda).
RNA Isolation and Real Time PCR
Total RNA was extracted from the flushed tibial bones using TRIzol reagent (Invitrogen). For real time quantitative RT-PCR analysis, RNA was reverse-transcribed by the Super-ScriptTM first-strand synthesis system. Quantitative PCR was carried out using the QuantiTectTM SYBR Green PCR kit (Qiagen) on a MyiQTM instrument (Bio-Rad). β-Actin was used as an internal reference for each sample. mRNA was normalized to the β-actin mRNA level and expressed as the fold-change relative to the first sample for each experimental group. Relative mRNA expression was calculated using a formula reported previously (33). The primers for the genes of interest are listed in Table 1.
TABLE 1.
Primers used in qRT-PCR
| β-Actin | 5′-ATGGCTGGGGTGTTGAAGGT-3′ | 5′-ATCTGGCACCACACCTTCTACAA-3′ |
| Fgf23 | 5′-ACTTGTCGCAGAAGCATC-3′ | 5′-GTGGGCGAACAGTGTAGAA-3′ |
| Fgf2 | 5′-GTCACGGAAATACTCCAGTTGGT-3′ | 5′-CCCGTTTTGGATCCGAGTTT-3′ |
| Fgfr1 | 5′-GACTGCTGGAGTTAATACCA-3′ | 5′-CTGGTCTCTCTTCCAGGGCT-3′ |
| Fgfr3 | 5′-GTTCTCTCTTTGTAGACTGC-3′ | 5′-AGTACCTGGCAGCACCA-3′ |
| Ocn | 5′-GAGGGCAATAAGGTAGTGAACAGA-3′ | 5′-AAGCCATACTGGTTTGATAGCTCG-3′ |
| Op | 5′-CCAGGTTTCTGATGAACAGTATCC-3′ | 5′-ACTTGACTCATGGCTGCCCTTT-3′ |
| Opg | 5′-CACCATCAGCTGAAGATAGT-3′ | 5′-CCAAGATCTCTAACATGACG-3′ |
| Dmp1 | 5′-CAACTGGCTTTTCTGTGGCAA-3′ | 5′-TGGGTGCGCTGATGTTTGCT-3′ |
| Mgp | 5′-GTGGCGAGCTAAAGCCCAA-3′ | 5′-CGTAGCGCTCACACAGCTTG-3′ |
| Sost | 5′-CCTCCTCCTGAGAACAACCA-3′ | 5′-GCCGGAGCACACCAACTC-3′ |
| Osterix | 5′-ACTGGCTAGGTGGTGGTCAG-3′ | 5′-GGTAGGGAGCTGGGTTAAGG-3′ |
| Runx2 | 5′-ACAAACAACCACAGAACCACAAAGT-3′ | 5′-GTCTCGGTGGCTGGTAGTGA-3′ |
| Col1 | 5′-GGTCCTCGTGGTGCTGCT-3′ | 5′-ACCTTTGCCCCCTTCTTTG-3′ |
| Lrp4 | 5′-TCTGCGCACACGGAATAG-3′ | 5′-GCGCTCACCGCACATGT-3′ |
| Lrp5 | 5′-ACCCGCTGGACAAGTTCATC-3′ | 5′-TCTGGGCTCAGGCTTTGG-3′ |
| Lrp6 | 5′-GGTGTCAAAGAAGCCTCTGC-3′ | 5′-ACCTCAATGCGATTTGTTCC-3′ |
| Rankl | 5′-CACCATCAGCTGAAGATAGT-3′ | 5′-CCAAGATCTCTAACATGACG-3′ |
| Phex | 5′-ATTAGGTGCCGAGAGGAAGA-3′ | 5′-TCCCCACAACATATGGGAGT-3′ |
| Mepe | 5′-ACTATCCACAAGTGGCCTCG-3′ | 5′-CCGCTGTGACATCCCTTTAT-3′ |
| Dkk1 | 5′-ACTACCAGCCCTACCCTTGC-3′ | 5′-CTTGGACCAGAAGTGTCTTGC-3′ |
| Sprty1 | 5′-TGTGTTCTTTGTGGCAGAGC-3′ | 5′-CGGCTATTCCAAGCTCACTC-3′ |
| Sprty2 | 5′-ACATCGCTGGAAGAAGAGGA-3′ | 5′-CTGGGTAAGGGCATCTCTTG-3′ |
| Sprty3 | 5′-GGGGGAGGGTGTGAGATAAT-3′ | 5′-TTGCCATGACAGCCATAAAA-3′ |
| Sprty4 | 5′-TCTAGCTCTGGCGGAGCTGT-3′ | 5′-GTGAATCCCAGCTCAGTCAT-3′ |
| Sef | 5′-AACAGCGGACTGCACAACAT-3′ | 5′-GCAAGCGTACTGGCTGATG-3′ |
| Wnt10b | 5′-TTCTCTCGGGETTTCTTGGATTC-3′ | 5′-CCATGTGTCTCCCACGGACTGGCAG-3′ |
| Npt2a | 5′-CTGATTGTGGGTGCCCAACATGATG-3′ | 5′-TGCACTTCCGCTTCAGGTTTTC-5′ |
Western Blot Analysis
Protein was extracted from whole hearts using 1× RIPA buffer (Cell Signaling). Protein concentrations were measured with BCA protein assay reagent (Pierce). Tibial protein was purified utilizing protein A/G PLUS-agarose immunoprecipitation reagent, sc-2003 (Santa Cruz Biotechnology), according to the manufacturer's instructions. Protein was fractionated (tibia 250 μg and heart 300 μg) on SDS-polyacrylamide gel and transferred onto a PVDF membrane (Bio-Rad). Membrane was blocked for 1 h with 5% nonfat dry milk and then incubated overnight at 4 °C with anti-FGF2 (1:1000 Santa Cruz Biotechnology). Membranes were incubated with appropriate secondary antibody 1:20,000 (Amersham Bioscience) at room temperature for 1 h. Blots were developed with ECL plus reagents (Amersham Bioscience). Finally, blots were reprobed with actin antibody (Santa Cruz Biotechnology).
Statistical Analyses
Experimental values were reported as means ± S.E. t test or analysis of variance followed by least significant difference for post hoc multiple comparisons were used. SPSS software was used for statistical analysis, and the results were considered significantly different at p < 0.05.
RESULTS
HMWFGF2KO Mouse Phenotype
Body weight was similar in HMWKO and WT littermates (data not shown). Radiographic examination (Fig. 1A) revealed no dwarfism or shortening of the limbs, in contrast to what was observed in the HMWTg mice (10).
FIGURE 1.

X-ray images show no differences in HMWKO versus WT mice and dual beam x-ray absorptiometry analysis of excised femurs and vertebrae display increased BMD/BMC in HMWKO. A, x-ray images of WT and HMWKO mice. Dual beam x-ray measurements are as follows: B, femur BMD; C, femur BMC; D, L1–5 BMD; E, L1–5 BMC. Values are the mean ± S.E. (n = 15–27) * indicates significantly different from WT group (p < 0.05).
Dual Beam X-ray Absorptiometry
To examine the effect of knock-out of the HMW isoforms on bone mass and the effect on different bone compartments, BMD and BMC were measured both in vivo and after bones were excised. In vivo whole body BMD was significantly increased by 11.3% (p < 0.05) and BMC by 23.2% (p < 0.05) in the HMWKO compared with WT (data not shown). In vivo BMD of the femurs was significantly increased by 9% (p < 0.05) and BMC by 18% (p < 0.05) (data not shown). In vivo BMD of the HMWKO L1 to L5 vertebrae was significantly increased by 10% (p < 0.05), and the BMC significantly increased by 15% (p < 0.05) compared with the WT (data not shown). BMD of excised femurs (Fig. 1B) was significantly increased by 5.9% (p < 0.05) and BMC (Fig. 1C) by 14.3% (p < 0.05) from the HMWKO. There was also a significant increase of BMD (Fig. 1D) and BMC (Fig. 1E) in excised L1 to L5 vertebrae of 5 and 10%, respectively (p < 0.05), in HMWKO when compared with WT littermates. The bone area of the femurs was slightly increased in the HMWKO but was not significantly different from the WT mice (data not shown). The excised measurements further support the increased bone mass phenotype observed in the HMWKO in vivo. These data suggest that KO of HMW increases bone mass in mice.
Micro-CT
Micro-CT was utilized to analyze the micro-architecture of the trabecular and cortical bone of the femurs of the HMWKO mice and WT littermates (Fig. 2A). In HMWKO, trabecular bone volume (BV/TV) (Fig. 2B) was significantly increased by 75.8% (p < 0.05), trabecular thickness (Fig. 2C) by 17.65% (p < 0.05), and trabecular number (Fig. 2D) by 16.6% (p < 0.05) compared with WT. As shown in Fig. 2E, trabecular spacing was significantly reduced by 14.8% (p < 0.05) in HMWKO. Connective tissue density (Fig. 2F) was significantly increased by 103% (p < 0.05) in the HMWKO.
FIGURE 2.

Micro-CT analysis revealed increased trabecular bone measurements in HMWKO mice. A, representative micro-CT three-dimensional trabecular structure of femurs of 2-month-old male mice. Three-dimensional trabecular microstructural parameters were calculated using two-dimensional data obtained from micro-CT, with calculated morphometric indices included. B, bone volume density; C, trabecular thickness; D, trabecular number; E, trabecular spacing; and F, connective (Conn.) tissue density. (n = 6) * indicates significantly different from WT group (p < 0.05).
Micro-CT analysis of femur cortical bone (Fig. 3A) showed that the sub-periosteal area (Fig. 3B) was significantly increased by 25.1% (p < 0.05) in HMWKO. Cortical thickness (Fig. 3C) was also significantly increased by 20.4% (p < 0.05) in HMWKO. Cortical mask (Fig. 3D) was significantly increased by 32.7% (p < 0.05), and cortical porosity (Fig. 3E) was significantly reduced by 27.8% (p < 0.05). The volume of the bones was slightly increased in the HMWKO but was not significantly different from the WT (data not shown). The results from the micro-CT indicate that HMWKO have more structurally sound microarchitecture, and they also display increased bone mass in both the trabecular and cortical compartments.
FIGURE 3.

HMWKO mice have increased cortical bone measurements when compared with WT mice by micro-CT. A, representative micro-CT images of cortical bone. Cortical bone measurements are as follows: B, sub-periosteal area; C, cortical thickness; D, cortical mask; E, cortical porosity (n = 6). * indicates significantly different from WT (p < 0.05).
Bone Histomorphometry
To determine whether increased bone mass in HMWKO was due to increased bone formation or decreased bone resorption, histomorphometric analysis was conducted on the femurs. Static histomorphometric analysis (Fig. 4A) revealed less tartrate-resistant acid phosphatase staining in the HMWKO versus the WT. Osteomeasure analysis (Fig. 4B) showed a significant increase of 80% BV/TV (p < 0.05) in the HMWKO. Osteoblast surface/bone surface (Fig. 4C) was significantly increased by 88% (p < 0.05) in the HMWKO. There was a significant reduction, 25% (p < 0.05), of osteoclast surface (Fig. 4D) and a 22% reduction (p < 0.05) in osteoclast number/BS (Fig. 4E) in HMWKO compared with WT.
FIGURE 4.

Static bone histomorphometric analysis of trabecular bone in femurs showed HMWKO mice osteoblast/osteoclast activity favor bone mineralization. A, ×10 representative images of tartrate-resistant acid phosphatase. B, BV/TV. C, percent osteoblast surface (%ObS). D, percent osteoclast surface (%OcS); E, osteoclast number/bone surface (OcNo/BS) (n = 7–10). * indicates significantly different from WT (p < 0.05).
Dynamic histomorphometry was performed on trabecular bone of undecalcified femurs. Representative images of labeling are shown (Fig. 5A). The inter-label thickness (Fig. 5B) was significantly increased by 38.3% (p < 0.05) in the HMWKO compared with the WT. MAR (Fig. 5C) was significantly increased by 35.9% (p < 0.05) in HMWKO. The mineralizing surface per bone surface (MS/BS) (Fig. 5D) was significantly increased by 30.7% (p < 0.05) in HMWKO, and BFR/BS (Fig. 5E) was significantly increased by 89% in the HMWKO (p < 0.05). Taken together, these data show that knock-out of the HMW isoforms of FGF2 resulted in increased osteoblast activity and decreased osteoclast activity leading to a higher bone mass phenotype.
FIGURE 5.

Dynamic histomorphometric analysis of trabecular bone in femurs demonstrates increased bone mineralization rate in HMWKO mice. A, fluorescent imaging of calcein and xylenol orange from representative WT and HMWKO mice utilizing a ×5 lens. Smaller image uses a ×20 lens. Dynamic histomorphometry measurements are as follows: B, inter-label thickness. C, mineral apposition rate (MAR). D, mineralizing surface/bone surface (MS/BS), and E, bone formation rate/bone surface (BFR/BS) (n = 9–10). * indicates significantly different from WT (p < 0.05).
Dynamic histomorphometry of cortical bone is shown in Fig. 6. MAR, an index of osteoblast activity, in the periosteum was significantly increased by 79% in HMWKO mice (p < 0.05) compared with WT. MS/BS, an index of currently active mineralization, was significantly increased by 62% in HMWKO mice (p < 0.05) compared with WT. BFR/BS was significantly increased by 209% in HMWKO mice compared with WT (p < 0.05). There was no significant difference in MAR, MS/BS, and BFR/BS between WT and HMWKO in the cortical endosteum. Taken together, these data suggest that increased cortical bone is mediated by increased periosteal osteoblast function.
FIGURE 6.
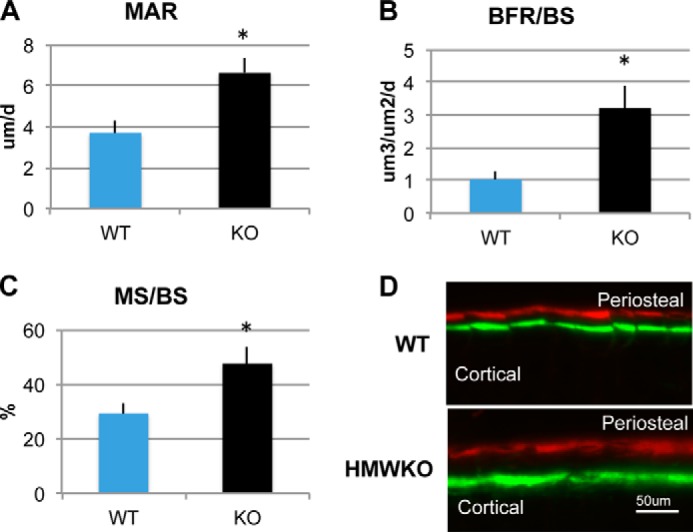
Dynamic histomorphometric analysis of cortical bone of femurs from WT and HMWKO mice. Dynamic histomorphometry measurements are as follows: A, mineral apposition rate (MAR); B, bone formation rate/bone surface (BFR/BS); and C, mineralizing surface/bone surface (MS/BS) in periosteal layer. * indicates significantly different from WT (p < 0.05). n = 9. D, fluorescent imaging of calcein and xylenol orange labeling in periosteum from representative WT and HMWKO mice.
Alkaline Phosphatase-positive Colonies and Mineralized Nodules in Bone Marrow Cultures of WT and HMWKO Mice
We assessed whether HMWKO increased bone nodule formation in vitro. ALP-positive colonies were determined at days 7, 14, and 21 after initial culture. As shown in Fig. 7A, there was a greater increase in ALP-positive colonies in HMWKO cultures at 7, 14 and 21 days, and von Kossa staining showed that there was a greater increase in mineralized colonies at 21 days in HMWKO (Fig. 7B) compared with WT. At day 7, ALP+ colony number (Fig. 7C) was significantly increased by 52.6% in HMWKO (p < 0.05) when compared with the WT. The total ALP colony area was also calculated at 7, 14, and 21 days after initial culture (Fig. 7D) and was significantly increased (p < 0.05) in HMWKO at all time points. As shown in Fig. 7E, quantification of von Kossa-stained mineralized colony area was similar in HMWKO and WT on days 7 and 14; however, on day 21 the colony area was significantly increased by 94.9% (p < 0.05) compared with the WT. The increased ALP and von Kossa staining in HMWKO BMSC cultures is consistent with both enhanced proliferative and mineralization abilities, respectively.
FIGURE 7.

Increased alkaline phosphatase-positive colonies and mineralized nodules in bone marrow cultures from HMWKO mice versus WT cultures. A, representative images of ALP-positive colonies at days 7, 14, and 21 of culture. B, representative images of von Kossa staining at days 7, 14, and 21 of culture. C, quantitative analysis of ALP-positive colony number; D, ALP-positive colony area measured by ImageJ software (National Institutes of Health). Number of wells measured at day 7 (n = 15 for WT and KO), day 14 (WT, n = 15; KO, n = 21), and day 21 (WT, n = 17; KO, n = 21). E, quantitative analysis of von Kossa-positive colony area utilizing ImageJ software. Number of wells measured at day 7 (n = 15 for WT and KO), day 14 (WT, n = 14; KO, n = 20), and day 21 (WT, n = 16; KO, n = 21). * indicates significantly different from WT (p < 0.05).
Differential Bone Marker Gene Expression
To further investigate the bone phenotype observed in the HMWKO, mRNA expression levels of genes involved in osteoblast differentiation, matrix mineralization, and resorption were measured in the flushed tibias of HMWKO and WT mice (Fig. 8). In the HMWKO type 1 collagen (Col1a1) (Fig. 8A), mRNA was significantly increased by 131% (p < 0.05). Genes important in osteoblast differentiation such as Runt-related transcription factor 2 (Runx2) (Fig. 8B) were significantly increased by 39.6% (p < 0.05); osterix (Fig. 8C) was significantly increased by 48.1% (p < 0.05); and osteocalcin (Oc) (Fig. 8D) by 213% (p < 0.05) and osteopontin (Op) (Fig. 8E) by 118% (p < 0.05), compared with WT. Dentin matrix phosphoprotein-1 (Dmp1) (Fig. 8F) was significantly increased by 41.8% (p < 0.05) in HMWKO. Phosphate-regulating neutral endopeptidase, X-linked gene (Phex) (Fig. 8G), was increased by 48.2% in the HMWKO compared with WT, but this was not statistically significant. The expression of several matrix inhibitory genes was also measured. In contrast to our observation in bones of HMWTg mice, where there was a marked increase in inhibitory Mgp (10), mRNA expression was similar in WT and HMWKO (Fig. 8H). Matrix extracellular phosphoglycoprotein (Mepe) mRNA (Fig. 8J) was similar in WT and HMWKO.
FIGURE 8.

Transcriptional regulation in HMWKO mice favors expression of genes that promote osteoblast differentiation and matrix mineralization in bone. Shown is real time RT-PCR analysis of Col1a1 (A), Runx2 (B), osterix (C), OC (D), Op (E), Dmp1 (F), Phex (G), Mgp (H), Dkk1 (I), and Mepe (J) mRNA expression in flushed tibial bones (n = 7–13). * indicates significantly different from WT (p < 0.05).
The effect of HMWKO on several components of the Wnt signaling pathway important in osteoblast differentiation was also examined. The receptors for Sost, low density lipoprotein receptor-related protein 4 (Lrp4), Lrp5, and Lrp6 were not significantly different in the HMWKO compared with WT (data not shown). Dickkopf-related protein 1 (Dkk1), canonical Wnt signaling antagonist (34), was also measured, and there was a decrease in HMWKO, but it was not significantly different (Fig. 8I). Wnt10b, a Wnt ligand, also revealed no significant difference between the two groups (data not shown).
We also determined whether selective HMWKO modulated the mRNA levels for Fgf2 and Fgf23 (Fig. 9). Fgf2 mRNA (Fig. 9A) was significantly reduced by 64.6% (p < 0.05). Fgf23 (Fig. 9B) mRNA was significantly decreased by 35.4% (p < 0.05) in the HMWKO compared with WT. The mRNA levels of Sprouty 1–4 genes and Sef, negative feedback regulators of Fgf2 signaling through FGFRs (35), were not significantly different (data not shown). The quantitative PCR analysis of osteoclast-related genes, receptor activator of Nfkb (Rankl), and osteoprotegerin (Opg) revealed a decrease in the receptor activator of NF-κB ligand/OPG ratio in the HMWKO, which was not significant (data not shown).
FIGURE 9.
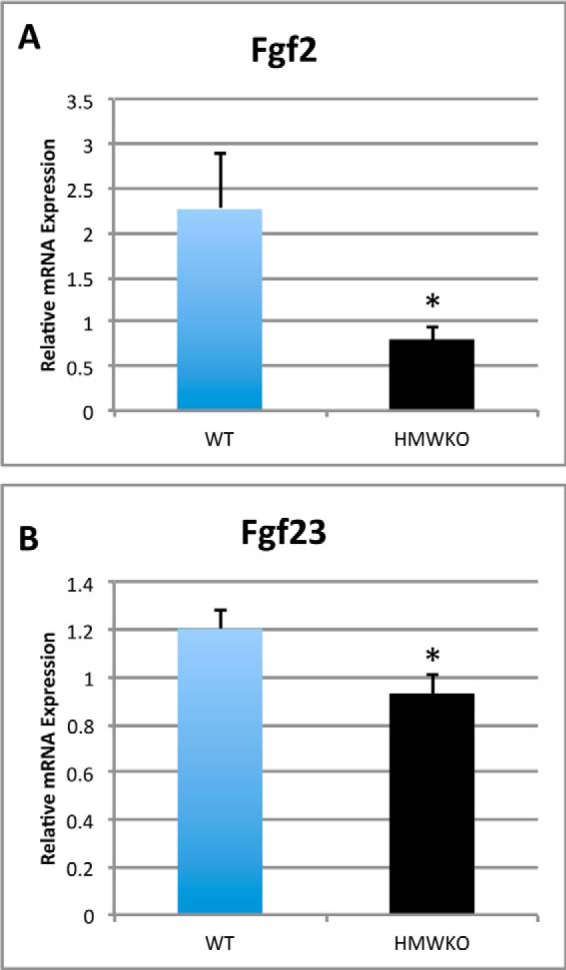
Modulation of Fgf2 and Fgf23 mRNA in HMWKO bones. Shown is real time RT-PCR analysis of Fgf2 (A) and Fgf23 (B) mRNA expression in flushed tibial bones (n = 7–11). * indicates significantly different from WT (p < 0.05).
We also examined the effect of HMWKO on the sodium-phosphate transporter gene Npt2a in the kidneys. The mRNA levels of Npt2a in the kidneys of HMWKO mice were not significantly different from WT mice (data not shown).
Biochemistry
Serum levels of FGF23, PTH, calcium, and phosphate were determined as described under “Experimental Procedures.” Serum FGF23 level in HMWKO mice was not significantly different from WT (Fig. 10A). Serum calcium was also similar in WT and HMWKO (Fig. 10B). Interestingly in contrast to HMWTg mice in which serum PTH was significantly increased and serum Pi was significantly decreased (10), we observed levels of serum PTH (Fig. 10C) and serum Pi (Fig. 10D) in HMWKO that were similar to WT.
FIGURE 10.

Serum FGF23, calcium, PTH, and phosphate levels were not significantly different in WT and HMWKO. A, serum FGF23. B, serum calcium. C, serum PTH. D, serum phosphate. Serum FGF23 and PTH (n = 8–10). Serum calcium and Pi (n = 16–19).
We examined SOST/sclerostin expression in serum and bones of WT and HMWKO mice. Serum sclerostin was significantly decreased in the HMWKO compared with the WT (Fig. 11A). As shown in Fig. 11B, there was a significant reduction of 65% (p < 0.05) in Sost mRNA in bones from HMWKO. Immunofluorescent representative images of sclerostin protein in femurs from WT and HMWKO (Fig. 11C) are shown. Reduced sclerostin immunofluorescence labeling is seen in osteocytes of HMWKO.
FIGURE 11.

Decreased serum sclerostin and decreased Sost mRNA and protein in bones of HMWKO mice compared with WT. A, serum sclerostin. B, RT-PCR Sost mRNA. C, representative immunofluorescent images for sclerostin expression in femurs. Decreased sclerostin expression (red) in osteocytes of cortical bone in HMWKO compared with WT. Nuclei were counterstained with DAPI (blue) (serum n = 10–11). * indicates significantly different from WT (p < 0.05).
Western Blot Analysis
To confirm that HMW protein isoforms were not expressed in the HMWKO mouse model, Western blots of heart and tibia protein were utilized to confirm the absence of the HMW FGF2 protein isoforms (data not shown). Both HMW and LMW isoforms were expressed in WT. However in the HMWKO only the LMW isoform was expressed.
DISCUSSION
This study demonstrates that mice with selective deletion of nuclear HMW FGF2 isoforms have a phenotype characterized by lack of dwarfism, increased BMD and BMC, as well as normal serum Pi and PTH. The increase in BMD and BMC, increased structural and functional parameters of bone as determined by micro-CT, and static and dynamic histomorphometry indicate increased bone mass and promotion of bone mineralization in the absence of the HMW isoforms of FGF2. In vitro osteogenic cultures also support the conclusion that knock-out of the HMWFGF2 isoforms results in increased differentiation and mineralization phenotype. Taken together, the data support the conclusion that HMWFGF2 isoforms negatively regulate osteoblast activity and bone mineralization.
Micro-CT and BMD demonstrated increased bone thickness and density in HMWKO. They have improved structural integrity demonstrated by significantly increased trabecular number, increased trabecular thickness, and significantly decreased trabecular spacing. Cortical thickness was also improved, which contributes to bone strength (36). These data indicate improvement of bone integrity and formation in both the trabecular and cortical compartments. All of these structural measurements indicate that HMWKO mice have improved bone structural integrity and might have decreased potential for fractures.
It is known that HMWFGF2 modulates bone formation and Pi homeostasis by causing increases in Fgf23 mRNA and protein levels in HMWTg mice (10). HMWFGF2 can function as intracrine signals through FGF receptors that translocate into the nucleus via importin-β-mediated transport (37). When bound to FGF2 ligands, the complexes can function as transcriptional activators (37) to regulate Fgf23 (11). FGF23 produced by osteoblasts/osteocytes is released into the circulation to affect Pi homeostasis via the kidney. In the absence of HMWFGF2 isoforms, the increased bone mass and structural integrity could partially be accounted for by the decrease in Fgf23 expression in bone and improved phosphate reabsorption by Npt2a in the kidney, leading to normal serum levels of phosphate. However, this alone may not be responsible for the increased bone mass phenotype in the HMWKO because modulation of osteoblast-related genes could contribute to the increased bone mass phenotype. Specifically, in contrast to the HMWTg mice (10, 11) in which a number of osteoblast differentiation promoting genes such as Runx2, osterix, and OC and pro-mineralization genes such as Phex and Dmp1 were decreased and inhibitory genes such as Mgp and Sost were increased, we observed increased expression of Runx2, osterix, OC, and Dmp1, normal expression of Mgp, and markedly reduced expression of Sost in the bones of HMWKO mice. The level of Col1a1 mRNA expression was significantly increased in the HMWKO mouse model, but it was significantly decreased in the HMWTg mice previously studied (10). The reduced expression of Col1a1 in the HMWTg could limit the available scaffolding area for bone formation, contributing to the observed reduced bone mass phenotype.
Expression levels of Mgp, a calcification inhibitor (28), were identical when HMWKO and WT were compared in this study. However, in our previous study, Mgp mRNA was increased by 446% in tibial bones of HMWTg mice when compared with the vector (10). These data indicate that the nuclear isoforms of FGF2 may directly affect the promotion of the expression of the calcification inhibitor Mgp. The HMW isoform of FGF2 may only mediate this effect of Mgp when its own expression is increased beyond the baseline. The ability of the cell to rapidly increase Mgp expression could be vital when attempting to slow bone mineralization during normal bone development or under conditions such as fracture repair.
In addition to Mgp, sclerostin, the product of the Sost gene also inhibits osteoblast differentiation and bone formation via binding of Lrp4/5/6, which blocks canonical Wnt signaling in osteoblasts (38–40). Sost mRNA expression was significantly decreased in HMWKO mice and increased in the HMWTg (10). Sclerostin was also significantly decreased in the serum of HMWKO mice. Sclerostin also functions to inhibit bone formation through modulation of the Phex/Mepe ASARM pathway (38) by increasing Mepe-ASARM protein that competitively binds with Phex inhibiting activation of Dmp1 (26). Activated Dmp1 is able to nucleate hydroxyapatite crystals during the initiation of bone formation (39). Thus, modulation of Sost could be a main pathway by which HMWFGF2 modulates bone homeostasis.
Enhanced Wnt signaling in HMWKO due to reduced Sost could over a period of time possibly promote tumor development, but this has not been observed in the HMWKO mice that have been aged.
In addition to its effects on osteoblast differentiation and matrix mineralization, HMW also appear to affect osteoclast number and function, because we observed reduced OCL parameters by histomorphometry in HMWKO. We also observed normal serum PTH. This result is of interest because PTH increases osteoclastic bone resorption and Pi wasting. Normal serum PTH and reduced osteoclast number and activity in HMWKO mice are in contrast to our observations in the HMWTg where we reported significantly increased OCL number and OCL surface by histomorphometry as well increased serum PTH and serum carboxyl-terminal collagen cross-links, a marker of increased bone turnover (10). Thus, decreased osteoclast activity could contribute to the increased bone mass phenotype in HMWKO mice. The role of PTH in the normalization of serum Pi in HMWKO is further intriguing because we previously reported that PTH increased HMWFGF2 nuclear accumulation in osteoblastic MC3T3-E1 cells and transcriptionally regulated Fgf2 promoter luciferase activity (42). These novel findings, when combined with the previously published data (10, 11), suggest that the HMW isoforms of FGF2 have inhibitory action on bone formation that are in addition to their ability to suppress mineralization by increasing Fgf23 expression and enhancing phosphate wasting.
In addition to the novel data that mice without the nuclear isoforms of FGF2 have increased bone mineral density and structural integrity, our previous studies investigated the overexpression of either the HMW or LMW isoforms of FGF2. When the results of all of these studies are taken into account, the data suggest that HMW nuclear isoforms of FGF2 may have some dominant function over the LMW isoform, the latter of which promotes bone formation, in a wild-type mouse when both are expressed. In mice that have all isoforms of FGF2 knocked out, there is a decrease in BMD and BMC (43). When only the LMW isoform is transgenically overexpressed, there is a dramatic increase in BMD and BMC (8). When the LMW isoform is knocked out, the mice present with significantly lower BMD and BMC than their WT littermates (8). HMWTg mice display a phenotype of decreased BMD and BMC (10). When all FGF2 isoforms are globally overexpressed, the mice display defective bone mineralization and osteopenia (6, 7). To account for these differential effects, the HMW isoforms could modulate the expression of the LMW isoform by promoting transcription of the HMWFGF2 from the unconventional CUG start codons upstream from the conventional start codon of the LMW isoform. Another possible mechanism for the dominant function of the HMW isoforms could be through competitive binding of the nuclear FGFR1 affecting the signaling ability of the LMW isoform (44). HMWFGF2 could also function as a negative feedback loop to halt bone formation after fracture repair by stimulating osteoclast bone resorption and Mgp calcification inhibition.
In summary, HMWFGF2 isoforms modulate bone and phosphate homeostasis via multiple pathways related to bone formation, osteoblast differentiation, and Wnt and Fgf2 signaling. The major players in this mechanism may be Sost and Fgf23, which is also linked to left ventricular hypertrophy (41, 45). The relationship of the isoforms of FGF2 to bone and phosphate homeostasis is beginning to be understood. Once the complete mechanisms of function are determined, proper manipulation of the Fgf2 pathways may prove to be beneficial in a clinical setting.
Acknowledgments
We thank Dr. Joseph A. Lorenzo for valuable critique of the manuscript and Dr. Douglas Adams for micro-CT analysis.
This work was supported, in whole or in part, by National Institutes of Health Grant DK098566-01-A1 (to M. M. H. and L. X.).
- HMW
- high molecular weight
- PTH
- parathyroid hormone
- LMW
- low molecular weight
- Tg
- transgenic
- BMSC
- bone marrow stromal cell
- BV
- bone volume
- TV
- total volume
- MAR
- mineral apposition rate
- BS
- bone surface
- BFR
- bone formation rate
- MS
- mineralizing surface
- micro-CT
- micro-computed tomography
- BMD
- bone mineral density
- BMC
- bone mineral content.
REFERENCES
- 1. Gospodarowicz D. (1990) Fibroblast growth factor. Chemical structure and biologic function. Clin. Orthop. Relat. Res. 257, 231–248 [PubMed] [Google Scholar]
- 2. Arnaud E., Touriol C., Boutonnet C., Gensac M. C., Vagner S., Prats H., Prats A. C. (1999) A new 34-kilodalton isoform of human fibroblast growth factor 2 is cap dependently synthesized by using a non-AUG start codon and behaves as a survival factor. Mol. Cell. Biol. 19, 505–514 [DOI] [PMC free article] [PubMed] [Google Scholar]
- 3. Okada-Ban M., Thiery J. P., Jouanneau J. (2000) Fibroblast growth factor-2. Int. J. Biochem. Cell. Biol. 32, 263–267 [DOI] [PubMed] [Google Scholar]
- 4. Prats H., Kaghad M., Prats A. C., Klagsbrun M., Lélias J. M., Liauzun P., Chalon P., Tauber J. P., Amalric F., Smith J. A. (1989) High molecular mass forms of basic fibroblast growth factor are initiated by alternative CUG codons. Proc. Natl. Acad. Sci. U.S.A. 86, 1836–1840 [DOI] [PMC free article] [PubMed] [Google Scholar]
- 5. Sørensen V., Nilsen T., Wiedłocha A. (2006) Functional diversity of FGF-2 isoforms by intracellular sorting. BioEssays 28, 504–514 [DOI] [PubMed] [Google Scholar]
- 6. Coffin J. D., Florkiewicz R. Z., Neumann J., Mort-Hopkins T., Dorn G. W., 2nd, Lightfoot P., German R., Howles P. N., Kier A., O'Toole B. A. (1995) Abnormal bone growth and selective translational regulation in basic fibroblast growth factor (FGF-2) transgenic mice. Mol. Biol. Cell 6, 1861–1873 [DOI] [PMC free article] [PubMed] [Google Scholar]
- 7. Sobue T., Naganawa T., Xiao L., Okada Y., Tanaka Y., Ito M., Okimoto N., Nakamura T., Coffin J. D., Hurley M. M. (2005) Overexpression of fibroblast growth factor-2 causes defective bone mineralization and osteopenia in transgenic mice. J. Cell. Biochem. 95, 83–94 [DOI] [PubMed] [Google Scholar]
- 8. Xiao L., Liu P., Li X., Doetschman T., Coffin J. D., Drissi H., Hurley M. M. (2009) Exported 18-kDa isoform of fibroblast growth factor-2 is a critical determinant of bone mass in mice. J. Biol. Chem. 284, 3170–3182 [DOI] [PMC free article] [PubMed] [Google Scholar]
- 9. Delrieu I. (2000) The high molecular weight isoforms of basic fibroblast growth factor (FGF-2): an insight into an intracrine mechanism. FEBS Lett. 468, 6–10 [DOI] [PubMed] [Google Scholar]
- 10. Xiao L., Naganawa T., Lorenzo J., Carpenter T. O., Coffin J. D., Hurley M. M. (2010) Nuclear isoforms of fibroblast growth factor 2 are novel inducers of hypophosphatemia via modulation of FGF23 and KLOTHO. J. Biol. Chem. 285, 2834–2846 [DOI] [PMC free article] [PubMed] [Google Scholar]
- 11. Xiao L., Esliger A., Hurley M. M. (2013) Nuclear fibroblast growth factor 2 (FGF2) isoforms inhibit bone marrow stromal cell mineralization through FGF23/FGFR/MAPK in vitro. J. Bone Miner. Res. 28, 35–45 [DOI] [PMC free article] [PubMed] [Google Scholar]
- 12. Lu Y., Feng J. Q. (2011) FGF23 in skeletal modeling and remodeling. Curr. Osteoporos. Rep. 9, 103–108 [DOI] [PMC free article] [PubMed] [Google Scholar]
- 13. Yu X., White K. E. (2005) Review FGF23 and disorders of phosphate homeostasis. Cytokine Growth Factor Rev. 16, 221–232 [DOI] [PubMed] [Google Scholar]
- 14. Quarles L. D. (2012) Skeletal secretion of FGF-23 regulates phosphate and vitamin D metabolism. Nat. Rev. Endocrinol. 8, 276–286 [DOI] [PMC free article] [PubMed] [Google Scholar]
- 15. Kurosu H., Ogawa Y., Miyoshi M., Yamamoto M., Nandi A., Rosenblatt K. P., Baum M. G., Schiavi S., Hu M. C., Moe O. W., Kuro-o M. (2006) Regulation of fibroblast growth factor-23 signaling by klotho. J. Biol. Chem. 281, 6120–6123 [DOI] [PMC free article] [PubMed] [Google Scholar]
- 16. Urakawa I., Yamazaki Y., Shimada T., Iijima K., Hasegawa H., Okawa K., Fujita T., Fukumoto S., Yamashita T. (2006) Klotho converts canonical FGF receptor into a specific receptor for FGF23. Nature 444, 770–77417086194 [Google Scholar]
- 17. Kuro-o M., Matsumura Y., Aizawa H., Kawaguchi H., Suga T., Utsugi T., Ohyama Y., Kurabayashi M., Kaname T., Kume E., Iwasaki H., Iida A., Shiraki-Iida T., Nishikawa S., Nagai R., Nabeshima Y. I. (1997) Mutation of the mouse klotho gene leads to a syndrome resembling aging. Nature 390, 45–51 [DOI] [PubMed] [Google Scholar]
- 18. Jüppner H. (2011) Phosphate and FGF-23. Kidney Int. Supp. 79(S121), S24–S27 [DOI] [PMC free article] [PubMed] [Google Scholar]
- 19. Masuda M., Yamamoto H., Kozai M., Tanaka S., Ishiguro M., Takei Y., Nakahashi O., Ikeda S., Uebanso T., Taketani Y., Segawa H., Miyamoto K., Takeda E. (2010) Regulation of renal sodium-dependent phosphate co-transporter genes (Npt2a and Npt2c) by all-trans-retinoic acid and its receptors. Biochem. J. 429, 583–592 [DOI] [PubMed] [Google Scholar]
- 20. Sapir-Koren R., Livshits G. (2011) Bone mineralization and regulation of phosphate homeostasis. IBMS BoneKey 8, 286–300 [Google Scholar]
- 21. Wang H., Yoshiko Y., Yamamoto R., Minamizaki T., Kozai K., Tanne K., Aubin J. E., Maeda N. (2008) Overexpression of fibroblast growth factor 23 suppresses osteoblast differentiation and matrix mineralization in vitro. J. Bone Miner. Res. 23, 939–948 [DOI] [PubMed] [Google Scholar]
- 22. Touriol C., Bornes S., Bonnal S., Audigier S., Prats H., Prats A. C., Vagner S. (2003) Generation of protein isoform diversity by alternative initiation of translation at non-AUG codons. Biol. Cell 95, 169–178 [DOI] [PubMed] [Google Scholar]
- 23. Beck L., Soumounou Y., Martel J., Krishnamurthy G., Gauthier C., Goodyer C. G., Tenenhouse H. S. (1997) Pex/PEX tissue distribution and evidence for a deletion in the 3′ region of the Pex gene in X-linked hypophosphatemic mice. J. Clin. Invest. 99, 1200–1209 [DOI] [PMC free article] [PubMed] [Google Scholar]
- 24. Lorenz-Depiereux B., Bastepe M., Benet-Pagès A., Amyere M., Wagenstaller J., Müller-Barth U., Badenhoop K., Kaiser S. M., Rittmaster R. S., Shlossberg A. H., Olivares J. L., Loris C., Ramos F. J., Glorieux F., Vikkula M., Jüppner H., Strom T. M. (2006) DMP1 mutations in autosomal recessive hypophosphatemia implicate a bone matrix protein in the regulation of phosphate homeostasis. Nat. Genet. 38, 1248–1250 [DOI] [PMC free article] [PubMed] [Google Scholar]
- 25. Larsson T., Marsell R., Schipani E., Ohlsson C., Ljunggren O., Tenenhouse H. S., Jüppner H., Jonsson K. B. (2004) Transgenic mice expressing fibroblast growth factor 23 under the control of the α1(I) collagen promoter exhibit growth retardation, osteomalacia, and disturbed phosphate homeostasis. Endocrinology 145, 3087–3094 [DOI] [PubMed] [Google Scholar]
- 26. Rowe P. (2012) Regulation of bone–renal mineral and energy metabolism: The PHEX, FGF23, DMP1, MEPE ASARM pathway. Crit. Rev. Eukaryot. Gene Expr. 22, 61–86 [DOI] [PMC free article] [PubMed] [Google Scholar]
- 27. Martin A., Liu S., David V., Li H., Karydis A., Feng J. Q., Quarles L. D. (2011) Bone proteins PHEX and DMP1 regulate fibroblastic growth factor Fgf23 expression in osteocytes through a common pathway involving FGF receptor (FGFR) signaling. FASEB J. 25, 2551–2562 [DOI] [PMC free article] [PubMed] [Google Scholar]
- 28. Zebboudj A. F., Imura M., Boström K. (2002) Matrix GLA protein, a regulatory protein for bone morphogenetic protein-2. J. Biol. Chem. 277, 4388–4394 [DOI] [PubMed] [Google Scholar]
- 29. Azhar M., Yin M., Zhou M., Li H., Mustafa M., Nusayr E., Keenan J. B., Chen H., Pawlosky S., Gard C., Grisham C., Sanford L. P., Doetschman T. (2009) Gene targeted ablation of high molecular weight fibroblast growth factor-2. Dev. Dyn. 238, 351–357 [DOI] [PMC free article] [PubMed] [Google Scholar]
- 30. Montero A., Okada Y., Tomita M., Ito M., Tsurukami H., Nakamura T., Doetschman T., Coffin J. D., Hurley M. M. (2000) Disruption of the fibroblast growth factor-2 gene results in decreased bone mass and bone formation. J. Clin. Invest. 105, 1085–1093 [DOI] [PMC free article] [PubMed] [Google Scholar]
- 31. Parfitt A. M., Drezner M. K., Glorieux F. H., Kanis J. A., Malluche H., Meunier P. J., Ott S. M., Recker R. R. (1987) Bone histomorphometry: standardization of nomenclature, symbols, and units. Report of the ASBMR Histomorphometry Nomenclature Committee. J. Bone Miner. Res. 2, 595–610 [DOI] [PubMed] [Google Scholar]
- 32. Sims N. A., Clément-Lacroix P., Da Ponte F., Bouali Y., Binart N., Moriggl R., Goffin V., Coschigano K., Gaillard-Kelly M., Kopchick J., Baron R., Kelly P. A. (2000) Bone homeostasis in growth hormone receptor–null mice is restored by IGF-I but independent of Stat5. J. Clin. Invest. 106, 1095–1103 [DOI] [PMC free article] [PubMed] [Google Scholar]
- 33. Pfaffl M. (2001) A new mathematical model for relative quantification in real-time RT-PCR. Nucleic Acids Res. 29, e45. [DOI] [PMC free article] [PubMed] [Google Scholar]
- 34. Butler J. S., Murray D. W., Hurson C. J., O'Brien J., Doran P. P., O'Byrne J. M. (2011) The role of Dkk1 in bone mass regulation: correlating serum Dkk1 expression with bone mineral density. J. Orthop. Res. 29, 414–418 [DOI] [PubMed] [Google Scholar]
- 35. Edwin F., Anderson K., Ying C., Patel T. B. (2009) Intermolecular interactions of sprouty proteins and their implications in development and disease. Mol. Pharmacol. 76, 679–691 [DOI] [PMC free article] [PubMed] [Google Scholar]
- 36. Ammann P., Rizzoli R. (2003) Bone strength and its determinants. Osteopor. Int. 14, S13–S18 [DOI] [PubMed] [Google Scholar]
- 37. Stachowiak M. K., Fang X., Myers J. M., Dunham S. M., Berezney R., Maher P. A., Stachowiak E. K. (2003) Integrative nuclear FGFR1 signaling (INFS) as a part of a universal “feed-forward-and-gate” signaling module that controls cell growth and differentiation. J. Cell. Biochem. 90, 662–691 [DOI] [PubMed] [Google Scholar]
- 38. Atkins G. J., Rowe P. S., Lim H. P., Welldon K. J., Ormsby R., Wijenayaka A. R., Zelenchuk L., Evdokiou A., Findlay D. M. (2011) Sclersotin is locally acting regulator of late-osteoblast/preosteocyte differentiation and regulates mineralization through a MEPE-ASARM-dependent mechanism. J. Bone Miner. Res. 26, 1425–1436 [DOI] [PMC free article] [PubMed] [Google Scholar]
- 39. He G., Dahl T., Veis A., George A. (2003) Nucleation of apatite crystals in vitro by self-assembled dentin matrix protein 1. Nat. Mater. 2, 552–558 [DOI] [PubMed] [Google Scholar]
- 40. Kumar J., Swanberg M., McGuigan F., Callreus M., Gerdhem P., Akesson K. (2011) LRP4 association to bone properties and fracture and interaction with genes in the Wnt- and BMP signaling pathways. Bone 49, 343–348 [DOI] [PubMed] [Google Scholar]
- 41. Faul C., Amaral A. P., Oskouei B., Hu M. C., Sloan A., Isakova T., Gutiérrez O. M., Aguillon-Prada R., Lincoln J., Hare J. M., Mundel P., Morales A., Scialla J., Fischer M., Soliman E. Z., Chen J., Go A. S., Rosas S. E., Nessel L., Townsend R. R., Feldman H. I., St John Sutton M., Ojo A., Gadegbeku C., Di Marco G. S., Reuter S., Kentrup D., Tiemann K., Brand M., Hill J. A., Moe O. W., Kuro-O M., Kusek J. W., Keane M. G., Wolf M. (2011) FGF23 induces left ventricular hypertrophy. J. Clin. Invest. 121, 4393–4408 [DOI] [PMC free article] [PubMed] [Google Scholar]
- 42. Hurley M. M., Tetradis S., Huang Y. F., Hock J., Kream B. E., Raisz L. G., Sabbieti M. G. (1999) Parathyroid hormone regulates the expression of fibroblast growth factor-2 mRNA and fibroblast growth factor receptor mRNA in osteoblastic cells. J. Bone Miner. Res. 14, 776–783 [DOI] [PubMed] [Google Scholar]
- 43. Xiao L., Sobue T., Esliger A., Kronenberg M. S., Coffin J. D., Doetschman T., Hurley M. M. (2010) Disruption of the Fgf2 gene activates the adipogenic and suppresses the osteogenic program in mesenchymal marrow stromal stem cells. Bone 47, 360–370 [DOI] [PMC free article] [PubMed] [Google Scholar]
- 44. Liao S., Bodmer J. R., Azhar M., Newman G., Coffin J. D., Doetschman T., Schultz Jel J. (2010) The influence of FGF2 high molecular weight (HMW) isoforms in the development of cardiac ischemia–reperfusion injury. J. Mol. Cell. Cardiol. 48, 1245–1254 [DOI] [PMC free article] [PubMed] [Google Scholar]
- 45. Kardami E., Jiang Z. S., Jimenez S. K., Hirst C. J., Sheikh F., Zahradka P., Cattini P. A. (2004) Fibroblast growth factor 2 isoforms and cardiac hypertrophy. Cardiovasc. Res. 63, 458–466 [DOI] [PubMed] [Google Scholar]