Abstract
Recent studies have shown that some nanostructured surfaces (NSS), many of which are derived from surfaces found on insect cuticles, rupture and kill adhered prokaryotic microbes. Most important, the nanoscale topography is directly responsible for this effect. Although parameters such as cell adhesion and cell wall rigidity have been suggested to play significant roles in this process, there is little experimental evidence regarding the underlying mechanisms involving NSS-induced microbial rupture. In this work, we report the NSS-induced rupturing of a eukaryotic microorganism, Saccharomyces cerevisiae. We show that the amount of NSS-induced rupture of S. cerevisiae is dependent on both the adhesive qualities of the yeast cell and the nanostructure geometry of the NSS. Thus, we are providing the first empirical evidence that these parameters play a direct role in the rupturing of microbes on NSS. Our observations of this phenomenon with S. cerevisiae, particularly the morphological changes, are strikingly similar to that reported for bacteria despite the differences in the yeast cell wall structure. Consequently, NSS provide a novel approach for the control of microbial growth and development of broad-spectrum microbicidal surfaces.
Keywords: yeast, nanostructured surfaces, cell adhesion, antimicrobial
1. Introduction
The recent discovery of nanostructured surface (NSS)-induced rupturing of prokaryotic microbes provides a potentially powerful new tool in the control of microbial growth [1–3]. In theory, these NSS—many of which have been derived from the cuticles of insects—kill bacteria through structural/mechanical interactions [1–4]. Although bacterial and fungal cell walls are structurally and chemically distinct, we observe a similar rupturing of the cellular fungus Saccharomyces cerevisiae on certain NSS. Although NSS-induced microbial rupture implies physical damage to the microbial cell wall and/or cell membrane, there is not a clear understanding of the mechanisms underlying this phenomenon. Modelling of the cell–NSS interaction has implicated physicochemical properties such as cell–substrate adhesion and cell wall rigidity in NSS-induced rupture [1], but there is little empirical evidence describing the role of either parameter in this process. In this paper, we address the role that cell–substrate adhesion plays in NSS-induced microbial rupture. We demonstrate that the strength of the cell–substrate interaction is critical to NSS-induced rupture and reduction in viability, i.e. stronger adhesion between the yeast and the NSS results in more cells rupturing on the surface. Our results suggest a common mechanism underlying the NSS-induced microbicide phenomenon and one that may serve to be exploited in the generation of broad-spectrum antimicrobial NSS.
2. Material and methods
2.1. Yeast strains and culture
Saccharomyces cerevisiae strains used in this study were W303-1A (ATCC stock number, 208352; genotype: MATa ade2–1 ura3–1 his3–11 trp1–1 leu2–3 leu2–112 can1–100) and SK1-CAN1 (ATCC stock number, 204722; genotype: MATalpha/MATalpha HO can1(r) gal2 cup(s)). Frozen stocks were maintained at −80°C. For each experiment, colonies from freshly streaked YPD plates were used. Liquid YPD (yeast extract, peptone, dextrose, water) media were inoculated with one colony per 5 ml. Liquid cultures were grown overnight with shaking approximately 200 r.p.m. at 20°C to an OD600 ∼ 1.5 at which point fresh cultures were spiked to an OD600 ∼ 0.2 and incubated with shaking for 3–5 h at 30°C to an OD600 ∼ (0.4–0.6) indicative of mid-log phase growth [5]. OD600 measurements were made using a Thermo Scientific Nanodrop 2000C spectrophotometer, and viability counts ∼ 107 cells ml−1 were made using serial dilution plating to maintain that mid-log phase cells were used for initiating all NSS experiments. For accuracy and precision, OD600 measurements used for cell density approximations were always kept below 1 with an absorbance of 1, for S. cerevisiae, corresponding to approximately 3 × 10⁷ cells ml−1 [5].
2.2. Cell surface hydrophobicity/microbial adhesion to hydrocarbon assay
A cell surface hydrophobicity comparison was performed on log phase and stationary phase cells of the two strains using a phase separation technique known as a microbial adhesion to hydrocarbon (MATH) assay [6]. Cells were grown to the desired phase, washed 1 × in 50 mM EDTA (pH 8.0) to inhibit flocculation and then suspended in 0.9% NaCl (pH ∼ 6) to an OD600 ∼ (0.8–1.0). In glass tubes, 2 ml of cell suspension was carefully overlaid with 400 μl of octane. Aqueous phase (1 ml) was carefully removed, and the remainder was vortexed for 60 s, followed by 10 min of rest for phase separation. After separation, the other 1 ml aqueous phase was carefully removed, and OD600 measurements were made on both samples. Relative hydrophobicity measurements are reported as OD600 percentage differences before and after vortexing, [1 − (ODafter/ODbefore)] × 100%; at least 10 samples were measured and averaged.
2.3. Surface preparation and characterization
The wings of Tibicen tibicen (dog day annual cicada), Magicicada septendecim (brood II periodical cicada) and Progomphus obscurus (common sanddragon) were all collected from Greensboro, NC, USA. For decay prevention, the insects were stored at −20°C. To prepare for experimentation, wings were dissected from the organism carefully as to not damage their surfaces. Isolated wings were sonicated in 70% ethanol for 10 min to remove any potential debris, including any previously attached microbes, after which samples were inspected via scanning electron microscopy (SEM) to determine whether cleaning had damaged the nanotextured surfaces. There was no discernable variation in the nanostructures before and after cleaning. Glass cover slips were wiped clean using 70% ethanol, and cleansed wings were then mounted on them using double-sided carbon tape. The cover slips served two functions: they provided a base for the wings for ease of handling and they were used as additional controls for yeast proliferation/viability. Gold sputter-coated samples of each surface were also used in conjunction with the native surfaces to confirm the mechanical component of this phenomenon. A 10 nm layer of gold was deposited using a Leica EM ACE200 and monitored in real time with a quartz crystal microbalance (QCM). Helium ion micrographs of sputter-coated surfaces were obtained using a Zeiss Orion helium ion microscope (HIM). Imaging parameters for the HIM were as follows: working distance 8.3 mm, accelerating voltage 30 kV, blanker current 1.6 pA and primary ET detector was used. Atomic force microscopy (AFM) was conducted with an Agilent 5600LS AFM and Pico View v. 1.14 software. Surfaces were imaged in air in tapping mode at 0.5 ln s−1 and 512 ppl with a tip of 3 N m−1 and resonance frequency of 285 kHz. Image post-processing was done with Gwyddion v. 2.3.
2.4. Substrate hydrophobicity and cell adhesion
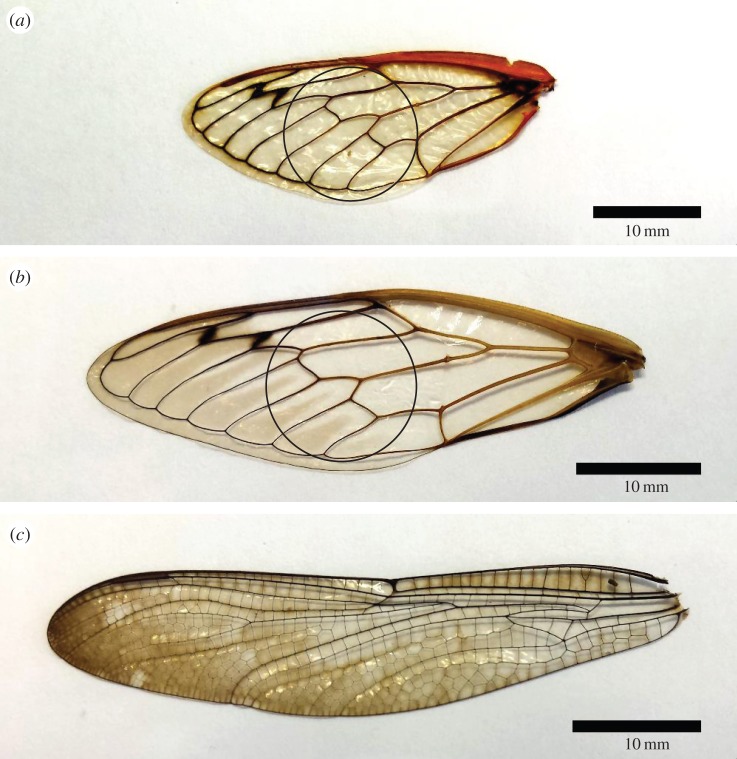
We investigated the wettability of the controls and NSS using a ramé-hart 260-F4 contact angle goniometer and DROPimage advanced software. Deionized water drops of 1 μl were carefully placed on the intervein membranes of gold-coated and native wings in the regions outlined in figure 1. Static contact angle measurements of at least five drops on two different samples of each surface, including gold-coated and uncoated glass controls, were averaged, and the significance of the differences between NSS and control surfaces was determined using Student's t-tests function in Microsoft Excel. A wash assay was conducted to investigate the adhesion response of the yeast cells to the various substrates, with the notion that a greater number of adhered cells post wash implies greater cell–substrate adhesion [7]. For each strain independently, 10 ml of exponential phase cells, at a concentration of approx. 5 × 10⁵ cells ml−1, had 10 μg ml−1 acridine orange added to the media and was then placed in a 35 mm Petri dish containing controls and NSS. After 10 min, samples were vigorously washed three times in phosphate-buffered saline (PBS; pH 7.5), covered with fresh PBS, and imaged immediately using an upright Olympus BX51 compound microscope equipped with a CoolPix CCD camera. Images (10–20) were collected for each surface using the 10× objective and ImageJ plug-in. Labelled cells were manually counted, and data were analysed in Microsoft Excel.
Figure 1.
Images of wings used in these experiments. (a) Brood II (Brd II) periodical cicada (Magicicada ssp.); (b) dog day (DD) annual cicada (Tibicen ssp.); and (c) common sanddragon dragonfly (Pogomphus obscurus). The circles in (a) and (b) represent the 12 mm diameter cut outs used for the colony forming assay.
2.5. Scanning electron microscopy sample preparation and imaging for morphology study
Preparation began with the removal of the surfaces from the dish after a 1 h incubation time. Immediately following removal, the surfaces were gently washed three times in PBS on an elliptical shaker at 100–150 r.p.m. and then fixed in a 2.5% glutaraldehyde/2% formaldehyde solution in 0.1 M cacodylate buffer (pH 7.4) for 1 h. Samples were then washed three times in dH2O and immediately followed by an acetonitrile dehydration series of 30%, 50%, 75%, 95% and 100% for 5 min at each concentration. After drying, the samples had a 10 nm gold layer applied using a Leica EM ACE200 with real-time thickness monitoring using a QCM. Scanning electron micrographs were obtained using a Zeiss Auriga FIB/SEM. Scale bars were added using ImageJ software.
2.6. Growth/viability
To test viability and proliferation of yeast cultured on NSS and control surfaces, we performed two analyses. A standard CFU ml−1 assay was performed to determine the number of viable cells after 8 h of incubation [8]. Yeast cultures were grown to an OD600 ∼ (0.4–0.6), diluted to an OD ∼ 0.1 and cultured on the controls and NSS. At 0 h and 8 h of incubation, cell densities were determined by spreading serial dilutions of the media taken from the control and NSS cultures on YPD agar plates. Plate colonies were counted after 24 h of incubation at 30°C, the values of which are representative of viable cell concentration in CFU ml−1. Plate counts were then extrapolated according to the dilution factor (1 : 104) to give actual concentrations. The CFU data were gathered from five independent experiments, averaged, and the significance of the difference between experimental and control experiments was determined using Student's t-test function.
Viable cell counts were performed with an acridine orange/propidium iodide (AO/PI) assay using a Zeiss Axio Plan spinning disc confocal microscope [9]. In this assay, we cultured yeast cells on controls and NSS with two fluorescent dyes, acridine orange (ex488 nm/em518 nm) a cell-permeable dye that labels all living and dying cells and propidium iodide (ex535 nm/em617 nm) which is cell impermeable and will only label the DNA of dead or dying cells with compromised plasma membranes. Following incubation in 10 mg ml−1 acridine orange and 5 mg ml−1 propidium iodide solution for 5 min, the surfaces were removed and gently washed in PBS. The surfaces were then imaged, and count data were collected for each image from each experiment and input into Excel where the Student's t-test function was used to determine significance between controls and NSS.
2.7. Focused ion beam milling and scanning electron microscopy imaging
Sample preparation is much the same for SEM imaging except that between the fixing and dehydration steps there was 4 days of staining in 1% osmium tetroxide followed by 24 h in 1% uranyl acetate. Dehydrated samples were then heavily sputter-coated in a thick layer of Au (greater than 50 nm) to prevent stray ion damage and minimize charging owing to ion implantation. It is important to note that the experiment is essentially preserved after the cross-linking and dehydration steps, so there is no concern of losing information with the heavy sputter coating as the FIB is sectioning the sample anyways. Milling was done using the Zeiss Auriga FIB/SEM. FIB parameters were as follows: accelerating voltage 30 kV, milling current 600 pA, milling mode set on mill for depth (1–2 μm based on Si), working distance 5 mm, stage tilt 54° and tilt correction of 36° when imaging block face.
3. Results
3.1. Characterization of nanostructured surfaces
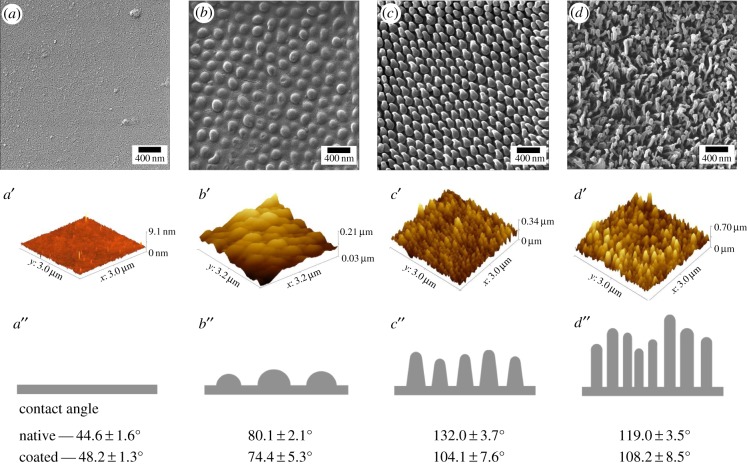
To examine the interactions of nanoscale topography and cellular fungi, we examined the growth and viability of baker's yeast, Saccharomyces cerevisiae, on three different nanostructured insect wings: brood II (Brd II) periodical cicada (Magicicada ssp.), the annual dog day (DD) cicada (Tibicen ssp.) and the common sanddragon dragonfly (Pogomphus obscurus; figure 1). We chose these particular wings for this study because they represent a range of nanoscale features, from low to high aspect ratio, which allowed us to systematically test the effect that different nanostructure geometries have on yeast viability. Similar work with bacteria suggests that the geometry of the nanostructures is essential for the observed rupturing of bacteria, but this has not been systematically tested. We characterized each surface using ultra high resolution helium ion microscopy [10] and AFM. The surfaces are as follows: a wing surface with low aspect ratio (height to width ∼ 0.5) nanoscale features from the 17 year Brd II periodical cicada (Magicicada ssp.); a wing surface with higher aspect ratio nanoscale features (height-to-width ‘base’ ∼ 1.8) from the annual DD cicada (Tibicen spp.); and a wing surface with the highest aspect ratio features we tested (height to width ∼ 4.6) from the common sanddragon dragonfly (DF; Pogomphus obscurus spp.; table 1 and figure 2). The arrangement and geometry of the nanostructures found on the winged surfaces are presented in table 1, and the calculations were performed from images represented by figure 2. In short, the Brd II NSS is composed of hexagonally close-packed hemispherical bumps (figure 2b–b″); DD NSS are hexagonally close-packed arrangements of spherically capped cones (figure 2c–c″); and the DF NSS consisted of densely packed spherically capped cylindrical structures (figure 2d–d″). In each case, these structures increase the total surface area when compared with the relatively featureless glass control surfaces (table 1).
Table 1.
Summary of nanostructured insect wing surfaces used in these experiments.
| name | approximate geometry | height (nm) | width (nm) | spacing (nm) | aspect ratio (height to width) | no. density (×109 cm−2) | % increase of surface area |
|---|---|---|---|---|---|---|---|
| Magicicada ssp. (periodical cicada/Brd II) | hemisphere | 83.5 ± 14a | 167 ± 14 | 252 ± 7.9 | 0.5 | 1.6 ± 0.1 | 34 ± 13 |
| Tibicen ssp. (annual cicada/DD) | spherically capped cones | 183 ± 32 | base 104 ± 5.5 cap 57 ± 4.0 | 175 ± 11 | 1.8 ± 0.32b | 3.3 ± 0.4 | 140 ± 33 |
| Progomphus ssp. (dragonfly/DF) | spherically capped cylinders | 241 ± 35 | 53 ± 9.5 | 123 ± 50 | 4.6 ± 1.1 | 6.7 ± 5.5 | 310 ± 210 |
aExtrapolated from diameter.
bWidth at base.
Figure 2.
Characterization of nanostructured surface topography used in these experiments. Top row consists of helium ion micrographs at 68 000× magnification; middle row are the corresponding atomic force micrographs providing better topographical information; bottom row, cartoon representation of an edge-on view of nanoscale topography and contact angle information. (a,a′,a″) Au-coated glass cover slip/control, relatively featureless surface aside from occasional debris. (b,b′,b″) Au-coated wing of periodical cicada Magicicada septendecim displaying approximately hemispherical features with a mean diameter of 167 nm. (c,c′,c″) Au-coated wing of annual cicada Tibicen tibicen displaying spherically capped conical protrusions with a mean length of 183 nm and mean cap diameter of 57 nm. (d,d′,d″) Au-coated wing of common sanddragon dragonfly, Progomphus obscure, displaying high aspect ratio spherically capped cylindrical protrusions which appear to be bundles of three to five smaller protrusions with a mean length of 241 nm and a mean bundle diameter of about 50 nm at the cap. The bottom row shows the contact angle measurements of each NSS. Refer to table 1 for more details on geometry of these surfaces. (Online version in colour.)
Lewis acid–base interactions consisting of usually attractive hydrophobic interactions and repulsive hydrophilic interactions play a significant role in microbial adhesion [11–15]. We determined the hydrophobicity of the NSS and controls using static contact angle measurements of deionized water (figure 2, bottom row; electronic supplementary material, figure S1 and table S1). Surfaces decorated with higher aspect ratio nanostructures generally exhibited greater hydrophobicity, and the inconsistency of the DF NSS is likely due to the extremely close vein spacing which even a 1 μl drop unavoidably spanned. More accurate contact angle measurements would likely show even greater CA for DF than what is presented here. The hydrophobicity of control surfaces and NSS used in this study was similar to what has been described earlier [16]. While all insect cuticles are structurally similar, insect cuticles are chemically complex materials that serve multiple roles other than support; one example being the secretion of complex molecules [17]. To eliminate potential effects owing to surface chemistry differences we tested Au-coated NSS and control surfaces and compared them with native surfaces [2]. The addition of the thin layer (10 nm) of Au reduced the hydrophobicity of each NSS, but did not notably alter the relative geometry of the NSS as determined by AFM and HIM (figure 2).
3.2. Yeast cell surface hydrophobicity and adhesion assay
The relative cell surface hydrophobicity of each strain was determined using a MATH assay [6]. To test for differences in culture growth, we collected data at two different culture phases, one at an actively dividing exponential phase (OD600 ∼ 0.4) and the other at stationary phase (OD600 ∼ 2). Cells of the W303 strain were found to be less hydrophobic when compared with SK1 cells at both stages (table 2 and electronic supplementary material, figure S2), but, in both strains, the stationary phase cells showed greater hydrophobicity relative to exponential phase cells. To test whether these differences reflected a change in cell adhesion, we performed a simple wash assay (figure 3). In this assay, we examined the adhesion of exponential phase yeast to glass coverslip controls and Au-coated NSS, whereby we counted the number of cells stained with acridine orange that were adhered to the surfaces after washing. Mirroring the results of the hydrophobicity assay, W303 cells exhibited significantly less affinity for the various surfaces relative to SK1 cells, approximately half in all cases (figure 3 and table 3). Interestingly, both strains showed greater affinity to the NSS compared with the controls (figure 3 and table 3; electronic supplementary material, figure S3), with the high aspect ratio DD surface having nearly a threefold increase in the number of cells per field relative to the control and the lower aspect ratio Brd II surface having nearly a twofold increase in the number of cells per field of view (figure 3 and table 3).
Table 2.
Cell surface hydrophobicity assay.
| strain | surface | n | % hydrophobicity |
|---|---|---|---|
| W303 | exponential | 13 | 7.2 ± 3.3 |
| stationary | 13 | 19.1 ± 8.1 | |
| SK1 | exponential | 22 | 32.1 ± 8.6 |
| stationary | 13 | 65.5 ± 9.8 |
Figure 3.
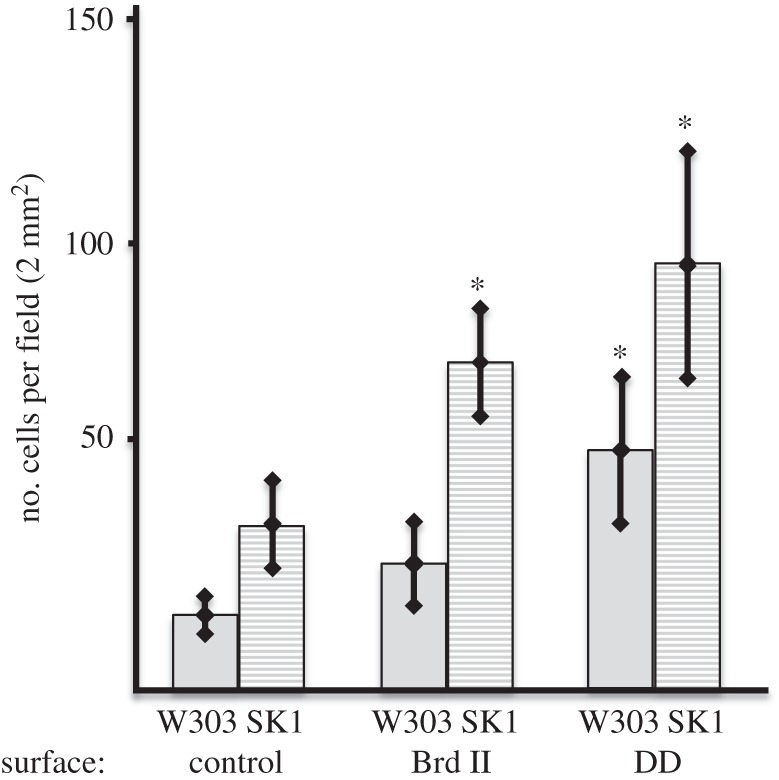
Summary of the data from the yeast adhesion assay. Cells were incubated on NSS for 10 min and were counted post-wash on 10 fields. Cells per field of the W303 strain is presented with shaded bars and the SK1 data with clear bars. On all surfaces, SK1 showed significantly greater adhesion than W303 (p < 0.001). Both NSS (Au-coated DD and Au-coated Brd II) used in these experiments showed significantly greater adhesion of the yeast strains relative to the Au-coated control, whereas the DD surface displayed the most adhesion of both strains of yeast.
Table 3.
Yeast adhesion to NSS assay.
| yeast strain/surface | n | no. cells per field | % difference from control |
|---|---|---|---|
| W303/Au-coated glass | 15 | 36.3 ± 10.9 | — |
| W303/Au-coated Brd II wing | 18 | 72.5 ± 12.4 | 196 |
| W303/Au-coated DD wing | 18 | 94.8 ± 25 | 261 |
| SK1/Au-coated glass | 15 | 16.1 ± 4.1 | — |
| SK1/Au-coated Brd II wing | 18 | 28.3 ± 9.7 | 170 |
| SK1/Au-coated DD wing | 18 | 53.0 ± 16.2 | 319 |
3.3. Yeast growth/proliferation on nanostructured surfaces
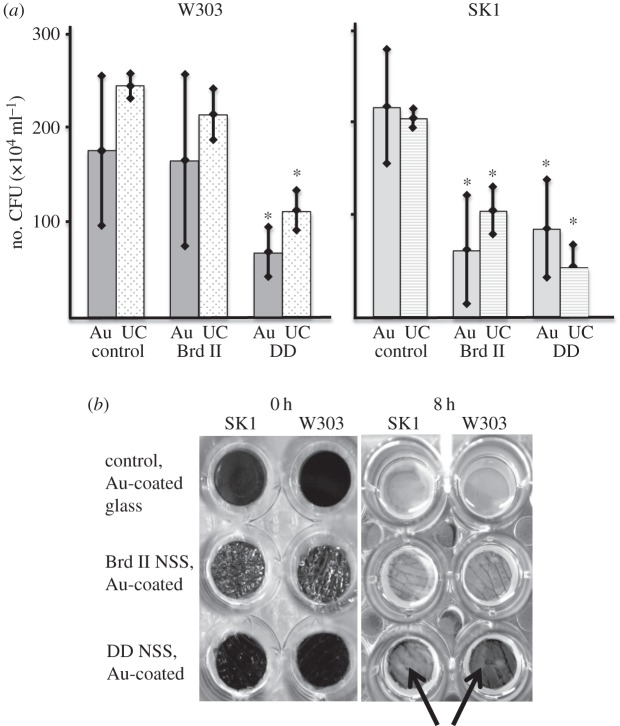
To determine whether or not the surfaces altered yeast growth, we cultured yeast cells in wells each containing one of two different NSS and another containing the control. To determine whether cell–substrate adhesion has any role in NSS-dependent growth phenotype, we used two common laboratory strains of S. cerevisiae, W303 and SK1, which have characterized differences in their affinities for abiotic substrates [7]. The difference in cell–substrate adhesion between these two yeast strains is likely due, in part, to the differential expression of FLO11p, an important yeast cell–substrate adhesion molecule that promotes non-specific adhesion through hydrophobic interactions and is expressed much higher in SK1 than W303 [7,18]. In our experiments, early log phase cultures of both strains were incubated in adjacent columns of wells, each column of wells containing a 12 mm insert of a control surface (round glass cover slip), the low aspect ratio Brd II wing and the higher aspect ratio DD wing. Each surface was prepared as described in the Material and methods section and then coated with a 10 nm layer of gold to negate surface chemistry differences of the native surfaces. Each sample was evaluated with SEM to ensure that the gold coating did not notably alter the nanoscale structures on the wings (figure 1). After 8 h of incubation with shaking at 30°C, we determined the number of CFU ml−1 using standard dilution plating. Both strains of yeast demonstrated a significant reduction in CFU ml−1 when grown on the DD surfaces (figure 1c–c″) when compared with the controls (table 2 and figure 4a), but only the high-affinity SK1 strain showed reduced CFU counts on the lower aspect ratio Brd II surface (table 2 and figure 4a). Interestingly, the naked eye appearance of the wells seems to support these results, especially in the DD wells whereby the matte black appearance of the Au-coated DD surface is clearly seen after 8 h of culture (figure 4b, bottom row), but the control surface is not so clearly seen (figure 4b, top row). Uncoated/native insect wing surfaces produced similar results (figure 4a) suggesting that the difference in surface chemistry between coated and uncoated samples did not play a significant role in the observed differences in the CFU ml−1 results (table 4).
Figure 4.
Growth assay of yeast on NSS. (a) Summary of the number of colony-forming units (CFU) per ml after an 8 h culture on NSS at 30°C. Each bar represents the average of five independent trials. The asterisks identify significance with p-values less than 0.05. Unshaded bars are uncoated (UC) samples, whereas shaded bars represent experimental data from Au-coated samples (Au). W303 showed a significant decrease in CFU ml−1 when grown on both the UC and the Au-coated DD NSS, but not the lower aspect ratio Brd II NSS, whereas SK1 showed significant deficits in CFU count when grown on uncoated and coated DD and Brd II NSS. (b) An image of the typical culture plate set-up used in our CFU experiments. The surfaces (both control and NSS) were placed in a 24-well plate. All surfaces were coated with gold which altered the appearance of the surfaces—darkening the higher aspect ratio DD NSS, but increasing the reflectivity of the lower aspect ratio Brd II surface; this can be easily seen in the before (0 h) images. After 8 h of culture the control has been completely obscured by cells, whereas the NSS show varying degrees of obscurement with the dark DD NSS apparently lacking cell coverage relative to the controls (arrows).
Table 4.
Yeast growth/proliferation on NSS assay.
| strain | surface | CFU ml−1 × 10⁴ | % relative to control |
|---|---|---|---|
| W303 | control, Au-coated glass | 177 ± 79 | — |
| W303 | Brd II, Au-coated | 166 ± 91 | 93 |
| W303 | DD, Au-coated | 68 ± 26* | 38 |
| W303 | control, uncoated glass | 246 ± 13 | — |
| W303 | Brd II, uncoated | 215 ± 27 | 87 |
| W303 | DD, uncoated | 112 ± 21* | 45 |
| SK1 | control, Au-coated glass | 227 ± 62 | — |
| SK1 | Brd II, Au-coated | 73 ± 59* | 32 |
| SK1 | DD, Au-coated | 95 ± 53* | 42 |
| SK1 | control, uncoated glass | 213 ± 10 | — |
| SK1 | Brd II, uncoated | 116 ± 26* | 54 |
| SK1 | DD, uncoated | 53 ± 24* | 25 |
*p < 0.05.
3.4. Live/dead cell analysis of yeast cultured on nanostructured surfaces
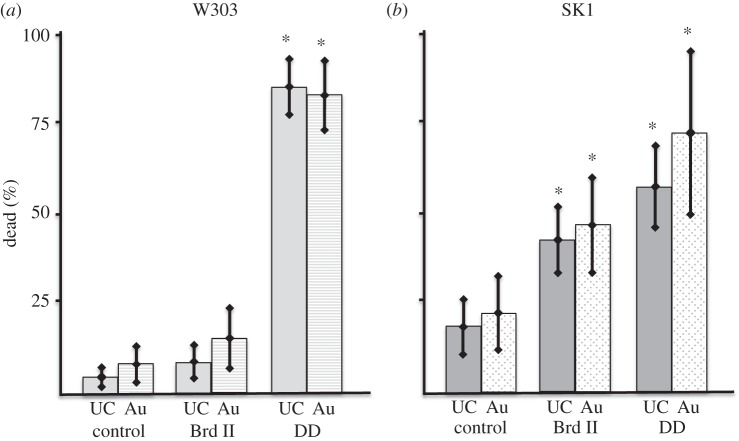
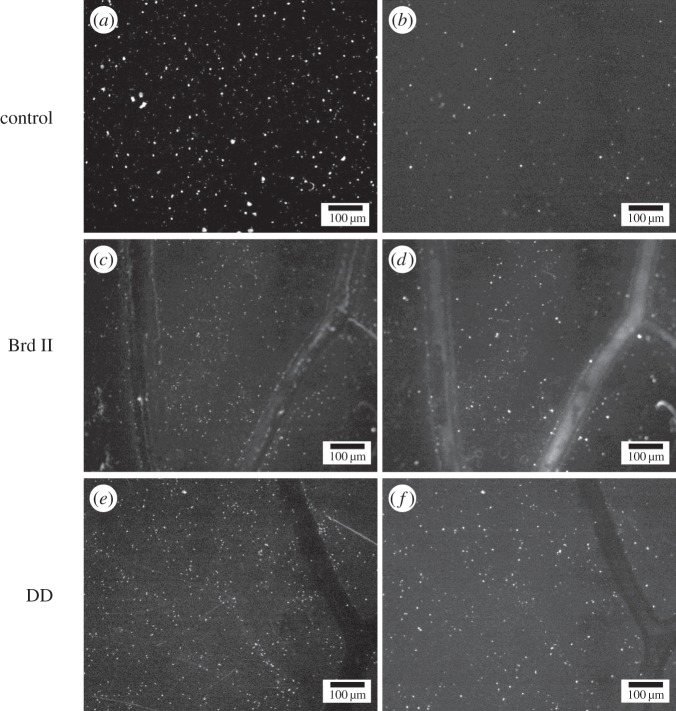
NSS that are similar to those described in this paper have been shown to kill bacterial cells [2,4]. To determine whether the reduction in CFU ml−1 owing to NSS exposure was a result of cell death or something else, such as a slowing of the cell cycle, we examined the viability of yeast cells adhered to NSS using a fluorescent AO/PI (live/dead) cell assay. In a similar fashion to what has been observed with bacterial cells and with the CFU experiments above, we observe that yeast cells die on high aspect ratio NSS. In addition to this, we were able to demonstrate that the NSS-induced cell death is dependent on NSS geometry and the adhesive quality of the cells. Weaker adhering W303 yeast showed a loss of viability only when in contact with NSS surfaces that have high aspect ratio features, for example DD and DF surfaces, but not the low aspect ratio Brd II surface (figure 5 and table 5). The strongly adherent yeast cells SK1 displayed significant decreased viability on all surfaces including the lower aspect Brd II surface, although this loss was not as great as that observed in the higher aspect ratio surfaces (figure 5 and table 5). We observed similar results with ethidium bromide [19] (figure 6; electronic supplementary material, figure S4 and table S2).
Figure 5.
Acridine orange/propidium iodide viability tests of SK1 and W303 yeast on NSS. Summary of the data from the AO/PI assay. Cells were incubated on NSS for 5 min and the green and red fluorescently labelled cells were counted. % dead was determined as the number of PI (red fluorescing) cells over the number of AO (green fluorescing) cells. (a) W303 strain yeast showed significant cell death only when presented to the DD NSS, whereas (b) SK1 strain yeast showed significant cell death on both Brd II and DD NSS (p < 0.001), with significantly greater cell death on the DD NSS when compared with Brd II.
Table 5.
AO/PI cell viability test.
| surface/strain | no.AO-labelled cells | no. PI-labelled cells | % PI labelled |
|---|---|---|---|
| uncoated glass, W303 | 6741 | 288 | 4.8 ± 2.5 |
| uncoated Brd II, W303 | 612 | 44 | 8.4 ± 6.2 |
| uncoated DD, W303 | 2339 | 2037 | 84 ± 8.7 |
| Au-coated glass, W303 | 669 | 84 | 13.3 ± 4.7 |
| Au-coated Brd II, W303 | 1250 | 149 | 15 ± 11 |
| Au-coated DD, W303 | 855 | 730 | 81.8 ± 9.5* |
| uncoated glass, SK1 | 2917 | 492 | 18.2 ± 7.7 |
| uncoated Brd II, SK1 | 2598 | 1033 | 41.5 ± 9.1* |
| uncoated DD, SK1 | 2345 | 1314 | 55.7 ± 11* |
| Au-coated glass, SK1 | 1266 | 239 | 21.7 ± 9.9 |
| Au-coated Brd II, SK1 | 1060 | 426 | 46.1 ± 13.6* |
| Au-coated DD, SK1 | 1292 | 890 | 71.0 ± 21.9* |
*p < 0.05.
Figure 6.
Acridine orange/propidium iodide viability testing of SK1 yeast on NSS. (a,c,e) Images of acridine orange-stained SK1 yeast cells, showing viable cells. (b,d,f) Images of propidium iodide-stained SK1 yeast cells showing all cells with compromised plasma membranes, i.e. dying or dead cells. (a,b) SK1 yeast on control surfaces (Au-coated glass). (c,d) SK1 yeast on Au-coated Brd II NSS, note the large number of cells dying or dead. (e,f) SK1 yeast on Au-coated DD NSS, note the high fraction of cells staining with propidium iodide.
3.5. Nanostructured surfaces-induced rupturing of yeast
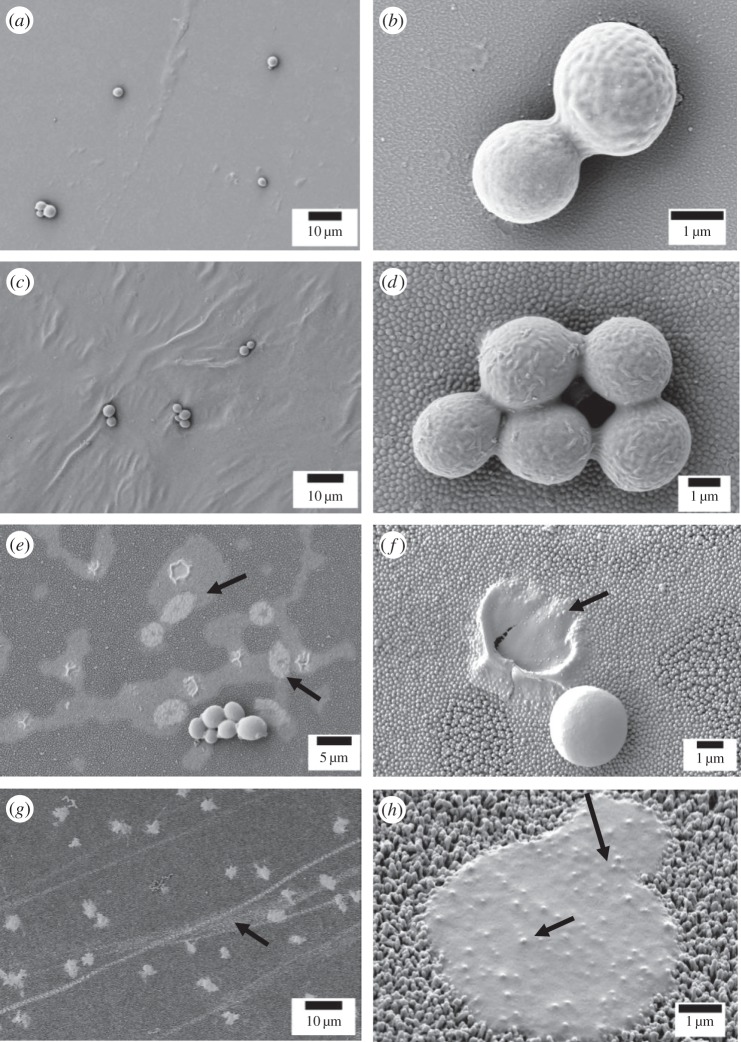
SEM micrographs of yeast cells on NSS show ruptured yeast, which resembles NSS ruptured bacteria [16,20] (figure 7). The observed morphological changes correlate with the changes in CFU ml−1 and loss of viability/plasma membrane integrity. Diploid non-pseudohyphal S. cerevisiae cells are ovoid in shape and 3–5 μm in diameter. On flat surfaces and on the low aspect ratio Brd II NSS, the ovoid shape of low binding W303 yeast cells is broadly conserved (figure 7a,b). However, on NSS with higher aspect ratios (DD and DF), yeast cells demonstrated varying degrees of deformity (figure 7e–h). Whether these morphologies represent different points during the rupturing process or different reactions of the yeast owing to cell cycle remains to be tested. In addition to the evident remains of the yeast cell walls on these surfaces (figure 7f), there are also associated areas, ‘puddles' of contrasting material on the NSS surrounding some of the cell wall debris, this ‘puddling’ being especially notable on the DD NSS (figure 7e). The composition of this ‘puddling’ film is unknown, but may represent cytoplasm remains of the ruptured cells and the effects that accumulation or build-up of this material might have on further cell rupturing is also unknown. Yeast cells on higher aspect ratio NSS have a larger contact area with the surface, appearing stretched and flattened across the surface (figure 7f,h).
Figure 7.
Low- and high-resolution scanning electron micrographs representing frequently found morphologies of S. cerevisiae W303 on Au-coated nanostructured surfaces. (a,b) Au-coated glass cover slip control showing no noticeable morphology changes; cells appear viable. (c,d) Au-coated brood II Magicicada septendecim displaying normal morphology; cells also appear to be in a viable state. (e,f) Au-coated dog day cicada Tibicen tibicen displaying ruptured cells. At lower magnification (e), areas with the remnants of cells and cell debris are notable in contrasting regions (arrows). At higher magnification (f), a cell has been fixed during the rupturing process. (g,h) Au-coated common sanddragon Progomphus obscurus also displaying significant morphology changes in the yeast. At higher magnification (h), features of the NSS are visible through the debris of a ruptured yeast cell (arrows).
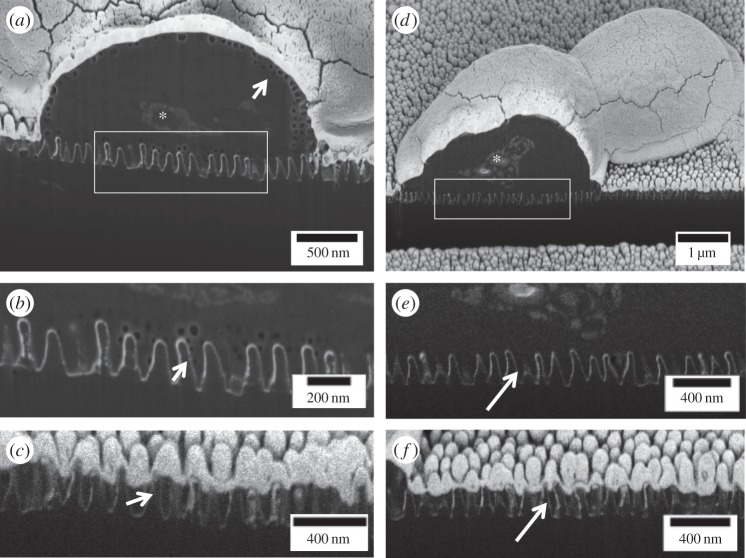
To determine whether the yeast cells sit rigidly on top of the NSS with minor deformation or if they deform appreciably owing to the geometry of NSS we performed focused ion beam milling/scanning electron beam microscopy (FIB/SEM). In these experiments, yeast cells that had been adsorbed to the NSS were fixed and stained with heavy metals prior to dehydration and imaging. During operation, a gallium ion beam mills away a section approximately 10 nm thick, and is immediately followed by electron beam imaging of the face of the exposed surface. A series of iterations of this cycle permit a nanoscale three-dimensional reconstruction of the yeast cell–NSS interface (electronic supplementary material, movies S1 and S2). In these experiments, we showed that the contact of the yeast cell with the NSS is intimate across this contact area and that the cell wall of the yeast seems to deform substantially owing to the NSS. There seems to be cell wall-/cell-derived materials flowing into the NSS (figure 8b,e, arrows) that is not apparent in areas that are not in contact with the cell (figure 8c,f, arrows). These results suggest that the adhesion of the cell to the NSS severely stretches and distorts it over the nanoscale features.
Figure 8.
FIB/SEM of ruptured yeast on NSS. (a–c) Slices from a series of SEM images through a ruptured ‘gum drop’ yeast cell. The face of the sample has been milled away using a gallium ion beam. The samples are covered with a thick layer of gold reducing off-line ion implantation artefacts that appear as surface lines or scratches on the face. (a) The cell as well as internal components such as the nucleus (asterisk) are clearly seen. The bright DD NSS contrasts nicely with the yeast cell. In this preparation, the cell wall has a vacuolated appearance (arrow), which can be seen along the NSS. (b) Shown here are the vacuoles extending down into the NSS, demonstrating the cell is intimate with the NSS and has deformed on the features of the NSS. (c) Neither the dark material nor the vacuoles are seen between the nanostructures of the surface not in contact with a cell (arrow). (d–f) Another example of a cell in the ‘gumdrop stage’ without vacuolation. Still dark material extends into the NSS (inset e) and this material is not present in areas lacking a cell (f, arrow).
3.6. Yeast cell damage to high aspect ratio dragonfly nanostructured surfaces
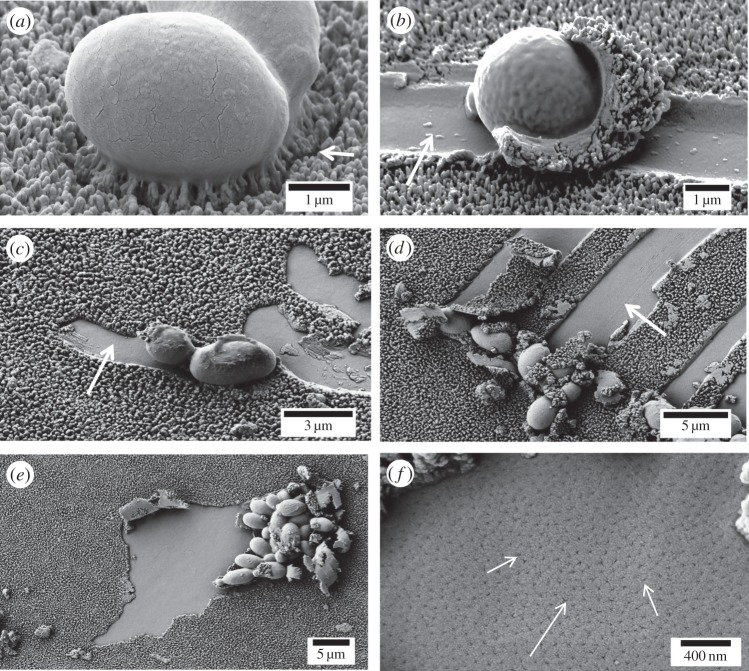
Another interesting effect we observed is that in some cases yeast cells physically alter/damage NSS. In our examination of the high aspect ratio DF surface, we observed scratches across the surface (figure 7g, arrow). While all of the NSS samples used in these experiments were wild caught and showed varying degrees of wear, on closer inspection, we observed that the vast majority of scratches on the DF NSS appeared to be produced by interactions with the yeast cells directly. W303 cells have a strong affinity for the DF surface and generate deformations of the surface features. Minor surface deformations appear as the pulling of the nanostructures towards the cell with conceivably slight separation from the underlying surface (figure 9a, arrow), whereas more severe damage consists of complete removable or delamination of the NSS epicuticle layer (figure 9b–f). Frequently, the yeast cells appear to have ploughed the surface producing the gouges observed at lower magnification (figures 7g and 9b,c,d, arrows). In other cases, larger patches were removed (figure 9e,f) revealing a porous sublayer beneath the nanostructured epicuticle, possibly indicating a component of DF NSS formation. These more extreme deformations seem to be the product of tangential forces applied to the cells, relative to the surface, during shaking that create a shearing action at the cell–surface interface. This NSS removal is indicative of greater adhesion between the yeast cells and NSS when compared with the NSS with the porous sublayer, and in some cases, the yeast cells themselves even become enveloped in the surfaced material (figure 9b, arrows).
Figure 9.
Deformation of high aspect ratio DF NSS by yeast cells. (a) W303 yeast cell attached to DF NSS; note the pulling of nanostructures towards the cell body and the separation created by this interaction (arrow). (b) W303 yeast cell with a ‘shell’ of NSS material; a cell wide trench behind the cell is apparently the source of the material (arrow). (c,d) Additional examples of this phenomenon, suggesting it to be quite common on this surface. (e,f) Large mats of cells remove larger areas of the NSS in clumps rather than streaks and reveal a porous layer below the NSS (arrows).
4. Discussion
In human disease, fungal infections are traditionally difficult to detect and treat and immunologically suppressed individuals such as transplant recipients, AIDS patients, diabetics and those living in poor and/or developing countries are particularly vulnerable to fungal infection [21–23]. A recent outbreak of fungal meningitis caused by contamination of a drug emphasizes the need for greater control over pathogenic fungi [20,24]. However, fungal pathogens are poorly understood, as are the conditions that lead to their pathogenicity. For instance, the fungus implicated in the 2012 epidemic of fungal meningitis, Exserohilum rostratum, had never been implicated in disease before the outbreak [20,24]. Current antifungal drugs disrupt one of three targets: membrane sterols, biosynthesis of nucleic acids or cell wall synthesis, and prolonged use of these agents has been associated with an increase in the number of clinical cases exhibiting resistance to these drugs, which often correlates with in vitro resistance [25,26]. Therefore, the need for alternative mechanisms to control fungal growth and infection is imperative. In this study, we used baker's yeast, Saccharomyces cerevisiae, to demonstrate and characterize the interactions of a cellular fungus with NSS. S. cerevisiae is a classic genetic model organism that has been used to study a variety of human diseases, including cancer, neurological disorders and fungal biofilm formation [27–30]. Furthermore, the cell wall structure and morphology of S. cerevisiae has served as a prototypical model for the study of fungal cell walls [28,31,32].
In this study, we demonstrated an adhesion dependence of the NSS-induced rupture of S. cerevisiae. While several groups have reported similar NSS-induced rupturing of prokaryotic bacteria, we are the first to report this phenomenon in a eukaryotic microbe. Furthermore, this work is the first empirical evidence that demonstrates the dependence on cell–substrate adhesion strength for NSS-induced microbial rupture. The Derjaguin–Landau–Verwey–Overbeek (DLVO) and the extended DLVO (XDLVO) theories of colloidal stability are often used to model microbial adsorption prior to biofilm formation [33–35]. The DLVO theory defines total interaction energy (Vt) as the sum of the usually attractive van der Waals interactions (Vvw) and a repulsive electrostatic term owing to electric double layer interactions (VR) [33]; XDLVO introduces a Lewis acid–base term (VAB) to account for the usually attractive hydrophobic interactions and repulsive hydration interactions that can be 10–100 times stronger than Vvw when in contact [12,34,36]. A conclusion that can be drawn from this model is that surfaces which are rough at the nanoscale can enhance particle adsorption to them by effectively increasing the particle–substrate separation distance and allowing the longer range attractive interactions to dominate over the more rapidly decaying repulsive interactions.
Our work experimentally demonstrates that there is a relationship between cell rupture/death and the nanostructure geometry of NSS. NSS enhancement of cell–substrate adhesion has been demonstrated for yeast by the increased adhesion of S. cerevisiae to wafers coated in silica beads when compared with a flat control surface [15]. Our results as well as other reports strongly suggest that the adhesion strength between the cell and the surface is a critical element in the NSS-induced rupturing of microbes, i.e. greater adhesion between the cells and the surface corresponds to a greater degree of rupturing for a given nanostructure geometry. This has been neatly demonstrated by the rupturing of a broad range of Gram-negative and Gram-positive bacteria and bacterial spores by the high aspect ratio nanostructures of a black silicon surface [4]. In our experiments, NSS (DD and DF) that had high aspect ratio nanoscale features demonstrated greater cell affinity than NSS with lower aspect ratio nanoscale features. This mirrored the cell-rupturing potential of a given NSS. NSS with higher aspect ratio nanoscale features (DD and DF) generated greater cell rupturing/cell death than surfaces with lower aspect ratio nanoscale features (Brd II). Interestingly, the reduced ability of a NSS to kill/rupture cells exhibited by a low aspect ratio NSS was compensated for by increased intrinsic cell adhesion. This was demonstrated by the significant SK1 cell death observed on the Brd II surface, whereas virtually no cell death was observed with the less adherent (W303) strain on this same surface. We have also shown that native surfaces and gold-coated surfaces display similar cell-rupturing properties, which demonstrates that surface composition is not a defining feature of NSS-induced rupture. Our results also demonstrate that reduction in cell-surface affinity may be a pathway for microbial resistance to the microbicidal activity of an NSS.
A common theme for designing antimicrobial surfaces has been centred on the idea of cellular repulsion [37–39]; this is extremely challenging owing to the dynamic nature of the cells, surfaces and environmental conditions. The discovery of microbicidal NSS derived from the wings of insects has potential to shift this paradigm [2,3]. When designing antimicrobial surfaces, targeting cellular repulsion may not be the best method of defence; a more effective solution might be to welcome cellular adhesion to a lethal surface.
Supplementary Material
Supplementary Material
Supplementary Material
Supplementary Material
Supplementary Material
Funding statement
This work was supported by the North Carolina Biotechnology Center (NCBC) Biotechnology Research Grant (213-BRG-1209 to Dr LaJeunesse) and through generous support of Dr James Ryan, the Joint School of Nanoscience and Nanoengineering, and the State of North Carolina.
References
- 1.Pogodin S, et al. 2013. Biophysical model of bacterial cell interactions with nanopatterned cicada wing surfaces. Biophys. J. 104, 835–840. ( 10.1016/j.bpj.2012.12.046) [DOI] [PMC free article] [PubMed] [Google Scholar]
- 2.Ivanova EP, et al. 2012. Natural bactericidal surfaces: mechanical rupture of Pseudomonas aeruginosa cells by cicada wings. Small 8, 2489–2494. ( 10.1002/smll.201200528) [DOI] [PubMed] [Google Scholar]
- 3.Hasan J, Webb HK, Truong VK, Pogodin S, Baulin VA, Watson GS, Watson JA, Crawford RJ, Ivanova EP. 2013. Selective bactericidal activity of nanopatterned superhydrophobic cicada Psaltoda claripennis wing surfaces. Appl. Microbiol. Biotechnol. 97, 9257–9262. ( 10.1007/s00253-012-4628-5) [DOI] [PubMed] [Google Scholar]
- 4.Ivanova EP, et al. 2013. Bactericidal activity of black silicon. Nat. Commun. 4, 2838 ( 10.1038/ncomms3838) [DOI] [PMC free article] [PubMed] [Google Scholar]
- 5.Bergman LW. 2001. Growth and maintenance of yeast. Methods Mol. Biol. 177, 9–14. [DOI] [PubMed] [Google Scholar]
- 6.Van Mulders SE, Christianen E, Saerens SM, Daenen L, Verbelen PJ, Willaert R, Verstrepen KJ, Delvaux FR. 2009. Phenotypic diversity of Flo protein family-mediated adhesion in Saccharomyces cerevisiae. FEMS Yeast Res. 9, 178–190. ( 10.1111/j.1567-1364.2008.00462.x) [DOI] [PubMed] [Google Scholar]
- 7.White MG, Piccirillo S, Dusevich V, Law DJ, Kapros T, Honigberg SM. 2011. Flo11p adhesin required for meiotic differentiation in Saccharomyces cerevisiae minicolonies grown on plastic surfaces. FEMS Yeast Res. 11, 223–232. ( 10.1111/j.1567-1364.2010.00712.x) [DOI] [PMC free article] [PubMed] [Google Scholar]
- 8.Novak J, Strasak L, Fojt L, Slaninova I, Vetterl V. 2007. Effects of low-frequency magnetic fields on the viability of yeast Saccharomyces cerevisiae. Bioelectrochemistry 70, 115–121. ( 10.1016/j.bioelechem.2006.03.029) [DOI] [PubMed] [Google Scholar]
- 9.Achilles J, Harms H, Muller S. 2006. Analysis of living S. cerevisiae cell states: a three color approach. Cytometry A 69, 173–177. ( 10.1002/cyto.a.20212) [DOI] [PubMed] [Google Scholar]
- 10.Boseman A, Nowlin K, Ashraf S, Yang J, Lajeunesse D. 2013. Ultrastructural analysis of wild type and mutant Drosophila melanogaster using helium ion microscopy. Micron 51, 26–35. ( 10.1016/j.micron.2013.06.005) [DOI] [PubMed] [Google Scholar]
- 11.Boks NP, Norde W, van der Mei HC, Busscher HJ. 2008. Forces involved in bacterial adhesion to hydrophilic and hydrophobic surfaces. Microbiology 154, 3122–3133. ( 10.1099/mic.0.2008/018622-0) [DOI] [PubMed] [Google Scholar]
- 12.Bowen WR, Lovitt RW, Wright CJ. 2001. Atomic force microscopy study of the adhesion of Saccharomyces cerevisiae. J. Colloid Interface Sci. 237, 54–61. ( 10.1006/jcis.2001.7437) [DOI] [PubMed] [Google Scholar]
- 13.Mercier-Bonin M, Ouazzani K, Schmitz P, Lorthois S. 2004. Study of bioadhesion on a flat plate with a yeast/glass model system. J. Colloid Interface Sci. 271, 342–350. ( 10.1016/j.jcis.2003.11.045) [DOI] [PubMed] [Google Scholar]
- 14.Kang S, Choi H. 2005. Effect of surface hydrophobicity on the adhesion of S. cerevisiae onto modified surfaces by poly(styrene-ran-sulfonic acid) random copolymers. Colloids Surf. B 46, 70–77. ( 10.1016/j.colsurfb.2005.08.017) [DOI] [PubMed] [Google Scholar]
- 15.Gotzinger M, Weigl B, Peukert W, Sommer K. 2007. Effect of roughness on particle adhesion in aqueous solutions: a study of Saccharomyces cerevisiae and a silica particle. Colloids Surf. B 55, 44–50. ( 10.1016/j.colsurfb.2006.11.001) [DOI] [PubMed] [Google Scholar]
- 16.Sun M, Watson GS, Zheng Y, Watson JA, Liang A. 2009. Wetting properties on nanostructured surfaces of cicada wings. J. Exp. Biol. 212, 3148–3155. ( 10.1242/jeb.033373) [DOI] [PubMed] [Google Scholar]
- 17.Vincent JF, Wegst UG. 2004. Design and mechanical properties of insect cuticle. Arthropod Struct. Dev. 33, 187–199. ( 10.1016/j.asd.2004.05.006) [DOI] [PubMed] [Google Scholar]
- 18.Liu HP, Styles CA, Fink GR. 1996. Saccharomyces cerevisiae S288C has a mutation in FL08 a gene required for filamentous growth. Genetics 144, 967–978. [DOI] [PMC free article] [PubMed] [Google Scholar]
- 19.Brousseau PPY, Tryphonas H, Blakley B, Flipo D, Fournier M. 1999. Assessment of cell viability: determination of cell viability and cell concentration with ethidium bromide and acridine orange. In Manual of immunological methods (eds Beudet MKE, Lapierre P, Voccia I.), pp. 28–29. Boca Raton, FL: CRC. [Google Scholar]
- 20.Kainer MA, et al. 2012. Fungal infections associated with contaminated methylprednisolone in Tennessee. N. Engl. J. Med. 367, 2194–2203. ( 10.1056/NEJMoa1212972) [DOI] [PMC free article] [PubMed] [Google Scholar]
- 21.Hampton T. 2008. Drug resistance in fungi. J. Am. Med. Assoc. 299, 2017 ( 10.1001/jama.299.17.2017-b) [DOI] [Google Scholar]
- 22.Kwon-Chung KJ, Chang YC. 2012. Aneuploidy and drug resistance in pathogenic fungi. PLoS Pathog. 8, 108 ( 10.1371/journal.ppat.1003022) [DOI] [PMC free article] [PubMed] [Google Scholar]
- 23.Horn F, Heinekamp T, Kniemeyer O, Pollmacher J, Valiante V, Brakhage AA. 2012. Systems biology of fungal infection. Front. Microbiol. 3, 108 ( 10.3389/fmicb.2012.00108) [DOI] [PMC free article] [PubMed] [Google Scholar]
- 24.Kuehn BM. 2013. Hospital faces uncertainty as it copes with surge of patients with fungal meningitis. J. Am. Med. Assoc. 309, 219–221. ( 10.1001/jama.2012.187705) [DOI] [PubMed] [Google Scholar]
- 25.Marie C, White TC. 2009. Genetic basis of antifungal drug resistance. Curr. Fungal Infect. Rep. 3, 163–169. ( 10.1007/s12281-009-0021-y) [DOI] [PMC free article] [PubMed] [Google Scholar]
- 26.Ghannoum MA, Rice LB. 1999. Antifungal agents: mode of action, mechanisms of resistance, and correlation of these mechanisms with bacterial resistance. Clin. Microbiol. Rev. 12, 501–517. [DOI] [PMC free article] [PubMed] [Google Scholar]
- 27.Reynolds TB, Fink GR. 2001. Bakers’ yeast, a model for fungal biofilm formation. Science 291, 878–881. ( 10.1126/science.291.5505.878) [DOI] [PubMed] [Google Scholar]
- 28.Bojsen RK, Andersen KS, Regenberg B. 2012. Saccharomyces cerevisiae: a model to uncover molecular mechanisms for yeast biofilm biology. FEMS Immunol. Med. Microbiol. 65, 169–182. ( 10.1111/j.1574-695X.2012.00943.x) [DOI] [PubMed] [Google Scholar]
- 29.Steinmetz LM, et al. 2002. Systematic screen for human disease genes in yeast. Nat. Genet. 31, 400–404. ( 10.1038/ng929) [DOI] [PubMed] [Google Scholar]
- 30.Pereira C, Coutinho I, Soares J, Bessa C, Leao M, Saraiva L. 2012. New insights into cancer-related proteins provided by the yeast model. FEBS J. 279, 697–712. ( 10.1111/j.1742-4658.2012.08477.x) [DOI] [PubMed] [Google Scholar]
- 31.Dague E, Bitar R, Ranchon H, Durand F, Yken HM, Francois JM. 2010. An atomic force microscopy analysis of yeast mutants defective in cell wall architecture. Yeast 27, 673–684. ( 10.1002/yea.1801) [DOI] [PubMed] [Google Scholar]
- 32.Rodriguez-Pena JM, et al. 2005. The ‘yeast cell wall chip’: a tool to analyse the regulation of cell wall biogenesis in Saccharomyces cerevisiae. Microbiology 151, 2241–2249. ( 10.1099/mic.0.27989-0) [DOI] [PubMed] [Google Scholar]
- 33.Hermansson M. 1999. The DLVO theory in microbial adhesion. Colloids Surf. B 14, 105–119. ( 10.1016/S0927-7765(99)00029-6) [DOI] [Google Scholar]
- 34.Hoek EMV, Agarwal GK. 2006. Extended DLVO interactions between spherical particles and rough surfaces. J. Colloid Interface Sci. 298, 50–58. ( 10.1016/j.jcis.2005.12.031) [DOI] [PubMed] [Google Scholar]
- 35.Martines E, Csaderova L, Morgan H, Curtis ASG, Riehle MO. 2008. DLVO interaction energy between a sphere and a nano-patterned plate. Colloids Surf. A 318, 45–52. ( 10.1016/j.colsurfa.2007.11.035) [DOI] [Google Scholar]
- 36.Israelachvili JN. 2011. Intermolecular and surface forces, 3rd edn Burlington, MA: Academic Press. [Google Scholar]
- 37.Cochis A, Fracchia L, Martinotti MG, Rimondini L. 2012. Biosurfactants prevent in vitro Candida albicans biofilm formation on resins and silicon materials for prosthetic devices. Oral Surg. Oral Med. Oral Pathol. 113, 755–761. ( 10.1016/j.oooo.2011.11.004) [DOI] [PubMed] [Google Scholar]
- 38.Rendueles O, Travier L, Latour-Lambert P, Fontaine T, Magnus J, Denamur E, Ghigo J-M. 2011. Screening of Escherichia coli species biodiversity reveals new biofilm-associated antiadhesion polysaccharides. mBio 2, e00043-11 ( 10.1128/mBio.00043-11) [DOI] [PMC free article] [PubMed] [Google Scholar]
- 39.Caro A, Humblot V, Methivier C, Minier M, Salmain M, Pradier CM. 2009. Grafting of lysozyme and/or poly(ethylene glycol) to prevent biofilm growth on stainless steel surfaces. J. Phys. Chem. B 113, 2101–2109. ( 10.1021/jp805284s) [DOI] [PubMed] [Google Scholar]
Associated Data
This section collects any data citations, data availability statements, or supplementary materials included in this article.


