Abstract
In nature, biofilms are the most common form of bacterial growth. In biofilms, bacteria display coordinated behaviour to perform specific functions. Here, we investigated electrical signalling as a possible driver in biofilm sociobiology. Using a multi-electrode array system that enables high spatio-temporal resolution, we studied the electrical activity in two biofilm-forming strains and one non-biofilm-forming strain. The action potential rates monitored during biofilm-forming bacterial growth exhibited a one-peak maximum with a long tail, corresponding to the highest biofilm development. This peak was not observed for the non-biofilm-forming strain, demonstrating that the intensity of the electrical activity was not linearly related to the bacterial density, but was instead correlated with biofilm formation. Results obtained indicate that the analysis of the spatio-temporal electrical activity of bacteria during biofilm formation can open a new frontier in the study of the emergence of collective microbial behaviour.
Keywords: biofilm, electrical spiking, sociobiology, bacteria, multi-electrode array
1. Introduction
Bacteria exist in communities and often coordinate their behaviour to perform specific functions. Biofilm formation is an example of this behaviour. Bacteria undergo large changes involving genetic pathways, such as transcriptional reprogramming [1–3] and modulation by small non-coding RNAs [4], and phenotypic modifications during their transition from a planktonic state (free-swimming) to biofilm development.
The classical phases of a biofilm cycle consist of: (i) initial attachment to a surface; (ii) production of a matrix of extracellular polymeric substances, resulting in tighter adhesion; (iii) formation of micro-colonies; (iv) maturation of micro-colonies to mature biofilms; and (v) detachment and return to planktonic growth [5].
Genetic and molecular techniques in association with microscopic imaging have revealed that biofilm development is a well-regulated process that leads to the formation of a complex community in which bacteria integrate internal and external signals, perceive the density and type of neighbours and coordinate a number of multicellular behaviours that may be associated with morphological, physiological features and other changes in cell properties [6]. The complexity of biofilm development suggests that its formation is not a stochastic process, but rather a type of microbial development in which changes in form and function play a prominent role in the life cycle of the bacteria [6].
The involvement of cell–cell signalling known as quorum sensing and the second messenger signal cyclic di-GMP are well documented in bacterial biofilm formation [7–9]. These widely conserved and important strategies, which allow bacteria to sense changes in population density and local environmental conditions and to accomplish the transition from a motile to a sedentary state, are thought to be integrated [10].
Despite recent impressive progress, some key questions about the signals involved in biofilm development remain unanswered [9]. Electrophysiological measurements, which were recently proposed for bacterial membrane potential analysis, could be a useful tool to investigate cell–cell signalling in biofilm development. The pioneering study of Kralj et al. [11], who used voltage-sensitive fluorescent membrane proteins to obtain electrophysiological measurements of individual intact bacteria, demonstrated that bacteria generate action potentials (APs) in response to different stimuli. Classical patch-clamp recording methods are not applicable to bacteria owing to the size of the cells (corresponding to the size of a typical patch pipette) and the presence of a cell wall. However, Martinac et al. [12] established a procedure to create giant bacterial spheroplasts of Escherichia coli cells, thereby enabling the electrophysiological investigation of bacterial cell membranes and the study of ion channels in prokaryotes. The multi-electrode array (MEA) system is a well-characterized tool for investigating electrical network activity in excitable cells undergoing maturation, particularly neurons. Because random electrical activity becomes synchronized with an increasing degree of correlation as the network develops [13–15], recording the electrical activity dynamics of developing biological networks enables the characterization of their spatio-temporal organization [16–19].
In this study, the MEA system was used for the first time, to the best of the authors' knowledge, to study spatio-temporal electrical activity during the development of bacterial biofilms (Bacillus licheniformis 51.1 and Pseudomonas alcaliphila 34) and during planktonic growth (E. coli HEC30) to gain deeper insights into the complex mechanism of signalling involved in biofilm formation. The observed patterns of electrical spiking during biofilm development provide new perspectives on the investigation of cell–cell communication mechanisms in bacteria.
2. Material and methods
2.1. Bacterial strains, media and growth conditions
The bacterial strains used were B. licheniformis 51.1 [20] and P. alcaliphila 34 [21,22], which were selected because of their ability to form biofilms under anaerobic and aerobic conditions, respectively, and E. coli HEC30, which was selected as a non-biofilm-forming model. The strains were grown in lysogeny broth (LB) [23] at 30°C with shaking.
For biofilm development, overnight bacterial cultures of the strains were diluted in LB to an optical density at 590 nm (OD590) of 0.7. Then, 200 µl of the cell suspension was added to each well of a 96-well plate. The development of B. licheniformis 51.1 biofilms under anaerobic conditions was stimulated by adding 1% KNO3 to the LB medium as a terminal acceptor of metabolic electrons and covering each well of the microplates with drops of sterile vaseline oil.
The plates were incubated at 30°C without shaking for at least 72 h. At each sampling time, the planktonic cells of a plate were removed by multi-channel pipette aspiration, each well was washed with 250 µl of sterile water and the plate was vigorously shaken to remove all non-adherent bacteria. The attached biofilm was stained by the addition of 1 ml of a 0.1% crystal violet (CV) solution. After incubation for 15 min, the unbound CV was removed by aspiration, and excess stain was removed by placing the plate under running tap water. After the plate was air dried, 1 ml of 96% ethanol was added to each well, and the OD590 was measured after 30 min using a DVB9990 microplate reader (GDV, Rome, Italy).
Planktonic cultures of E. coli were grown in microplates containing LB medium and were monitored at OD590 (GDV, Italy).
2.2. Multi-electrode array recording and signal processing
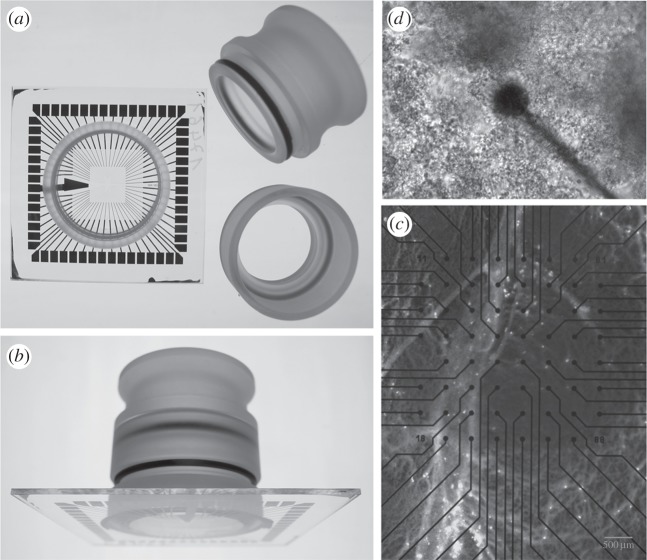
The strains were grown overnight in LB medium and diluted to an OD590 of 0.7 or 0.4 in the appropriate LB medium for biofilm and planktonic culture, respectively. Then, 1.5 ml of each cell suspension was added to a sterilized planar MEA (Multichannel Systems MCS GmbH, Reutlingen, Germany) with 59 electrodes plus 1 internal reference (figure 1) and incubated at 30°C in the recording incubator. In order to promote biofilm formation in B. licheniformis 51.1, which is positively influenced by anaerobic conditions, 750 µl of sterile vaseline oil was applied on top of the MEA well, using a micropipette with sterile tips.
Figure 1.
The MEA chip used to record the electrical activity of growing bacteria. Sixty electrodes (59 + 1) were printed at the bottom 500 µm apart. The glass ring glued on top was filled with lysogeny broth growth medium with/without vaseline oil (a,b). Close-up image of one of the electrodes and several bacterial cells (c,d). Electrode diameter: 30 μm. Interelectrode distance: 500 µm. Each electrode detected signals from multiple cells.
The MEA chip was placed on the MEA board (USB-MEA60, Multichannel Systems MCS GmbH) for long-term recording of bacterial spike activity during growth and development. Throughout, sterility was ensured using a special cover (figure 1), and the temperature was maintained using a temperature controller (TC02, Multichannel Systems MCS GmbH). Datasets from three separate replicates were obtained under the same conditions. Control experiments (without cells) were also performed in which the signals from MEA chips filled with LB medium were recorded. Pharmacological perturbation was performed using sodium azide (SA; 10 mM [24]) and carbonyl cyanide m-chlorophenylhydrazone (CCCP; 50 mg ml−1 [25]) added after 6 h from the inoculum. Each treatment was replicated three times for both biofilm-forming bacteria strains.
The extracellular activity of cultured bacteria was recorded using a USB-MEA60 system. Signals were obtained simultaneously from 59 recording electrodes (30 µm diameter with 500 µm spacing) with a sampling rate of 5 kHz. The remaining electrode was used as an internal ground. Signals were continuously recorded for at least 72 h with no perturbation. MC_RACK software (Multichannel Systems MCS GmbH) was used for data acquisition and spike detection. The values of the signal-to-noise ratio (S/N) and of the root mean-squared (RMS) of the basal noise of signal were calculated over some brief time windows (500 ms) extracted at different points along each recording session. The S/N ranged between 6 and 12, with an average value of 7.8 ± 0.7 (mean ± s.d.), and the averaged RMS of the basal noise was 4.04 ± 1.85 µV (mean ± s.d.). Both values were constant during a single recording session, allowing spike detection with a threshold-based method; because of small manufacturing differences among the several MEA arrays used for the experiments, certain variability was, indeed, found in different recording sessions. In any case, such variability was never correlated with different bacterial strains. The optimal threshold, set three times higher than the RMS of the basal noise, was chosen performing more than two attempts with different threshold values for each recording. Moreover, no filter was applied to raw data. Electrical traces were analysed in order to exclude the pure stochasticity of data; for that purpose, the probability distribution of data points was plotted and compared with the Gaussian distribution. The dedicated software NeuroExplorer (Nex Technologies, Littleton, MA) was used for the timestamp extraction, spike rate analysis and spike shape analysis. Spatial and temporal analyses of the electrical activity were performed using routines written in Matlab (The MathWorks, Inc., Natick, MA). The data are reported as the mean ± standard error (s.e.m.). Comparisons of the means were performed with one-way ANOVA and Tukey's post-test using GraphPad Prism v. 5 (GraphPad Software, San Diego, CA).
2.3. Analysis of synchronized events
We described the synchronized events by counting the electrode spikes evoked together during a fixed time interval of various selected values (Δt = 100–700 ms). The values of Δt were chosen to be much smaller than the mean interspike intervals. We labelled such events as temporal clusters (figure 2a). Then, we counted the number nt of such clusters of size C and divided it by the total number of spikes Ntot registered in a given experiment, obtaining the quantity
where C = 1,2,3, … , m, where m = 59. The maximum value of C was determined by the finite size of the MEA, which contains 59 electrodes (sites).
Figure 2.
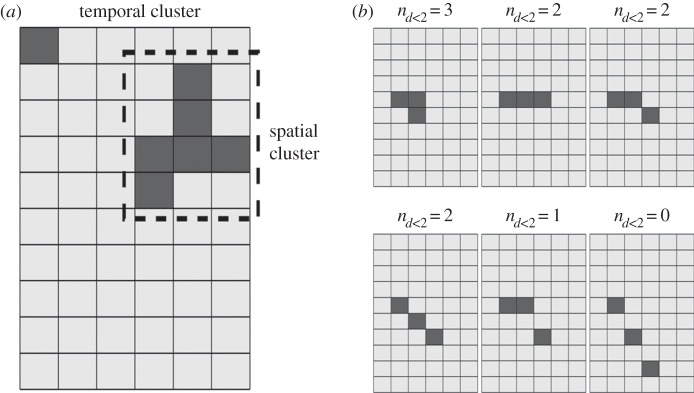
(a) Schematic of temporal and spatio-temporal clusters: shaded squares indicate sites that fire during the same temporal window (temporal clusters); shaded squares underlined by a dotted line indicate adjacent sites that fire during the same temporal window (spatio-temporal clusters). (b) Some examples of spatio-temporal cluster quantification for neighbouring sites (nd < 2) for a total number of spikes n = 3 in the temporal window are shown. The size of spatio-temporal clusters is described in terms of the number of pairs of neighbouring spikes. Only adjacent sites or sites whose distance is inferior to d = 2 are considered part of the cluster. For n = 3, if there are no neighbouring sites then nd < 2 = 0 (no distances smaller than 2); if two from three sites are neighbouring, nd < 2 = 1 (only one distance smaller than 2); if three sites lay in a row form, nd < 2 = 2 (two distances smaller than 2); finally, if all sites are neighbouring with each other, nd < 2 = 3 (all possible distances between the sites are smaller than 2).
The next step was the identification of the spatio-temporal clusters, defined as the sites that fire together during a time interval Δt, with additional restriction for the spatial separation between sites (figure 2b).
We defined a distance d as the horizontal, vertical or diagonal separation between the electrodes, calculated using the Pythagorean formula for distance
where the pairs (i, j) and (k, l) mark the normalized coordinates for each two electrodes and i, j, k, l = 0,1, … , m − 1. X is the minimal distance between horizontally or vertically neighbouring electrodes (in our case, X = 500 µm).
We then calculated all distances between two given sites for each temporal cluster C ≥ 2. The total number of distances for a given C and instant of time was calculated as follows:
We separated the total number of distances nd into two groups: the former denominated nd < 2 for which d < 2X (sites separated spatially by distances smaller than 2X, i.e. the nearest neighbours, including diagonal ones) and the latter denominated nd ≥ 2 for which d ≥ 2X (sites separated spatially by distances equal to or larger than 2X, i.e. not neighbouring). Thus, we obtained the following relation:
Then, we used nd < 2 to define a new quantity
where C refers to temporal clusters. The quantity ps is defined as a number of distances smaller than 2X normalized by a total number of spikes Ntot observed for given sizes of temporal clusters. The integer ps qualitatively describes the appearance of the spatio-temporal clusters and indicates the strength of the collectivity of the neighbouring groups as well as the transmission of electrical signals between them. We note that this quantity does not refer to the exact sizes of spatio-temporal clusters, but instead describes qualitatively the degree of agglomerations between sites. In our analysis, we chose the temporal cluster of size C = 2 and calculated the corresponding quantity ps. To determine whether the experimental data differed from random coincidence, we created random data for each experiment and compared the results with the experimental data. To maintain statistical correspondence, the random data were created with the same number of events as the experiments as follows: (i) the number of spikes measured at each electrode in a given experiment was measured; (ii) the spikes were then randomly distributed in time (corresponding to the duration of the experiment); and (iii) the same analysis tools used to analyse the data from biofilm samples were applied to these data.
3. Results
Using 60-channel MEAs, we studied the development of electrical activity of biofilms (B. licheniformis 51.1 and P. alcaliphila 34) and planktonic cultures (E. coli HEC30; raw data are available upon request). The probability distribution of the data points from the raw electrical traces of the experiment showed two peaks, one corresponding to the noisy background, and the second one being a contribution from the deterministic spikes; this provided an evidence of non-Gaussianity of the data (electronic supplementary material, figure S1). Representative spikes from the three species of bacteria are illustrated in figure 3. Replicate trials revealed that the spikes had a similar shape, with an approximate duration of 1 ms. It is worth noting that in extracellular MEA recordings the time properties of signals detected are represented as their first derivative [26,27], thus they do not describe the actual membrane potential of the cell under study. This is why the reported spike duration is smaller than those already observed with other and not comparable experimental protocols [11]. The biofilm-forming bacterial strains B. licheniformis 51.1 and P. alcaliphila 34 both produced a biofilm layer covering the electrodes, as illustrated in figure 1.
Figure 3.
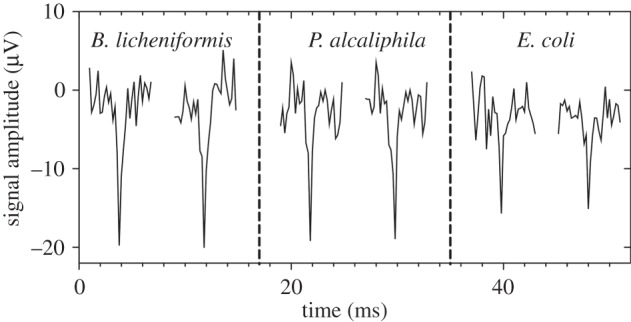
Recordings of action potentials in bacteria. Two traces for each strain are shown to illustrate the typical shape and size. The shapes are very similar, particularly for spike duration (approx. 1 ms).
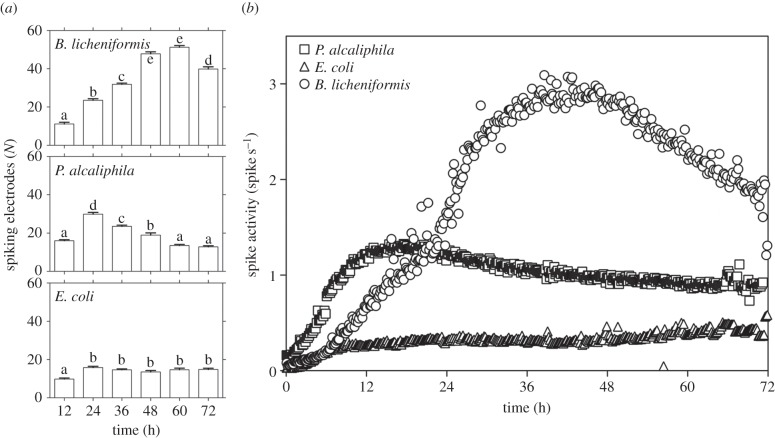
The spike rate during the growth of each strain is reported in table 1. The spike rate was calculated during three different growth periods (TZ1, TZ2 and TZ3, 1 h after the beginning of the recording, at the time of maximum rate and after 72 h, respectively). The spike rate differed in biofilm- and non-biofilm-forming bacteria, particularly during TZ2, which corresponded to the time of the maximum spike rate. As expected, the spike rate in control trials with LB medium alone was close to zero (data not shown).
Table 1.
Action potential (AP) rate and amplitude measured as an average considering all spikes detected by each channel for the duration of the experiment (72 h) and as an average of the spike detected over 60 min belonging to three periods, time zones 1, 2 and 3 (TZ1, TZ2 and TZ3, respectively, which correspond to 1 h after the beginning of the recording, at the time of maximum rate, and after 72 h).
| B. licheniformis | P. alcaliphila | E. coli | |
|---|---|---|---|
| AP rate (spikes s−1) | |||
| average | 1.84b* | 0.98ab | 0.54a |
| TZ1 | 0.11a | 0.16b | 0.08a |
| TZ2 | 2.89b | 1.24b | 0.32a |
| TZ3 | 1.88b | 0.88ab | 0.40a |
| AP amplitude (μV) | |||
| average | 19.8b | 18.9b | 13.6a |
| TZ1 | 18.9b | 18.88b | 12.98a |
| TZ2 | 20.55b | 19.15b | 13.95a |
| TZ3 | 19.95b | 18.94b | 13.90a |
*Values in the same horizontal row followed by the same letter are not significantly different (Tukey–Kramer test, p < 0.05).
During the course of the experiments, a change in the firing rate was observed. The average number of spiking electrodes increased significantly in B. licheniformis and P. alcaliphila, whereas no significant variation was observed in E. coli at 24 h after inoculation (figure 4a). Furthermore, spike rate quantification revealed different trends for the different species. In biofilm-forming bacteria, three time zones were apparent: an initial exponential increase in spike activity, followed by a stationary phase and a phase with decreased electrical activity. The maximum peak occurred between 36 and 48 h from the beginning of the recording for B. licheniformis and between 12 and 24 h for P. alcaliphila. By contrast, the spiking activity of E. coli increased slightly at the beginning of growth, and then was stationary until the end of the observation period (figure 4b).
Figure 4.
Number of spiking electrodes recorded during bacterial growth. (a) During the growth of biofilm-forming bacteria, the number of electrodes and, consequently, the number of sites involved in spike recording changes significantly, whereas in E. coli, spikes are detected in almost the same number of sites from the beginning to the end of the 72 h of recording. Means with the same letter are not significantly different from each other (Tukey–Kramer test, p < 0.05). (b) Spike rate during bacterial growth. Each point indicates the mean spike rate value calculated for a time span equal to 10 min. The plot of the spike rate during the growth of biofilm-forming bacteria is a three-zone curve (rapid increase in electrical activity, stationary spike rate, final slow decrease), whereas that of E. coli shows very little variation.
To determine whether an increase in the number of bacterial cells influenced the trends observed in the analysis of spike rate, we monitored biofilm and planktonic culture growth. As expected, the E. coli strain did not produce a biofilm (figure 5a), whereas the planktonic culture exhibited a typical growth curve (figure 5b). The biofilm-forming bacteria, particularly B. licheniformis, produced an abundant biofilm. Moreover, the time of the maximum biofilm formation corresponded to the maximum electrical activity recorded with the MEA system. The relationship between biofilm development and electrical activity measured by linear regression was R2 = 0.9753 (p < 0.0001) and R2 = 0.7533 (p < 0.0005) for B. licheniformis and P. alcaliphila, respectively.
Figure 5.
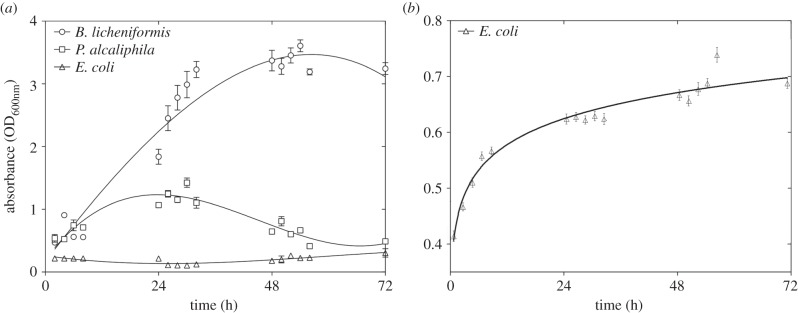
Biofilm quantification using absorbance measurements of crystal violet (a) bonded to the biofilm-forming bacteria B. licheniformis and P. alcaliphila and non-biofilm-forming E. coli. Planktonic quantification was determined by measuring the absorbance (b) of the E. coli.
The effect of metabolic uncouplers SA and CCCP on the electrical activity generated by the two biofilm-forming strains was also checked. The inhibition of the adenosintriphosphatase (ATPase) by SA induced a decrease in the spike rate quite immediately after the treatment (electronic supplementary material, table S1); such effect attenuated after a few hours. The dissipation of the proton motive force by CCCP had a more drastic effect on the electrical activity detected by the MEA system (electronic supplementary material, table S1), the rate of the electrical activity remained decreased for the rest of the recording. Two representative plots of the spike rate versus time are reported in the electronic supplementary material, figure S2. The probability distribution of the data points from the raw electrical traces after the treatments was checked and compared with that of the raw traces recorded in the absence of any kind of cells (electronic supplementary material, figure S3). No difference was found and, in both cases, data showed pure Gaussian distribution.
As already mentioned, the spikes for all strains were quite similar in terms of shape and duration (figure 3) but not amplitude (table 1). On average, we observed higher spike amplitudes in B. licheniformis and P. alcaliphila than in E. coli. Moreover, the trend in the spike amplitude of the APs measured during the course of the experiment differed during B. licheniformis and P. alcaliphila biofilm development and E. coli planktonic growth (figure 6). During the first 12 h, the spike amplitude increased for both biofilm-forming bacteria; it then continued to increase in B. licheniformis, but reached a stationary level in P. alcaliphila. The spike amplitude observed in E. coli exhibited very small variations during the duration of the experiment.
Figure 6.
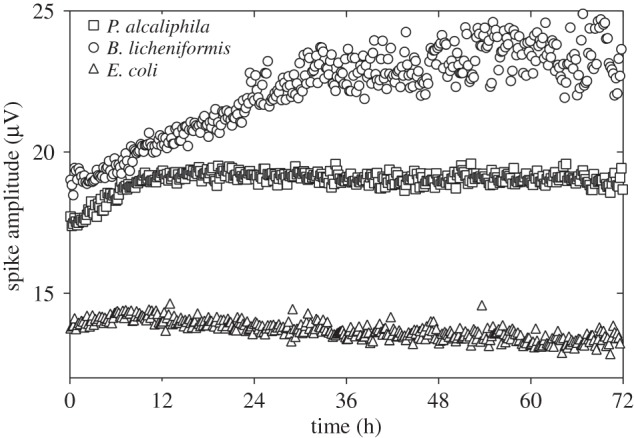
Evolution of spike amplitude during bacterial growth. Each point indicates the amplitude value calculated for a time span equal to 10 min. The spike amplitude of biofilm-forming bacteria (B. licheniformis and P. alcaliphila) was the highest and increased as the biofilm developed, whereas the non-biofilm-forming bacteria (E. coli) displayed spikes with smaller amplitudes that progressively decreased during recording.
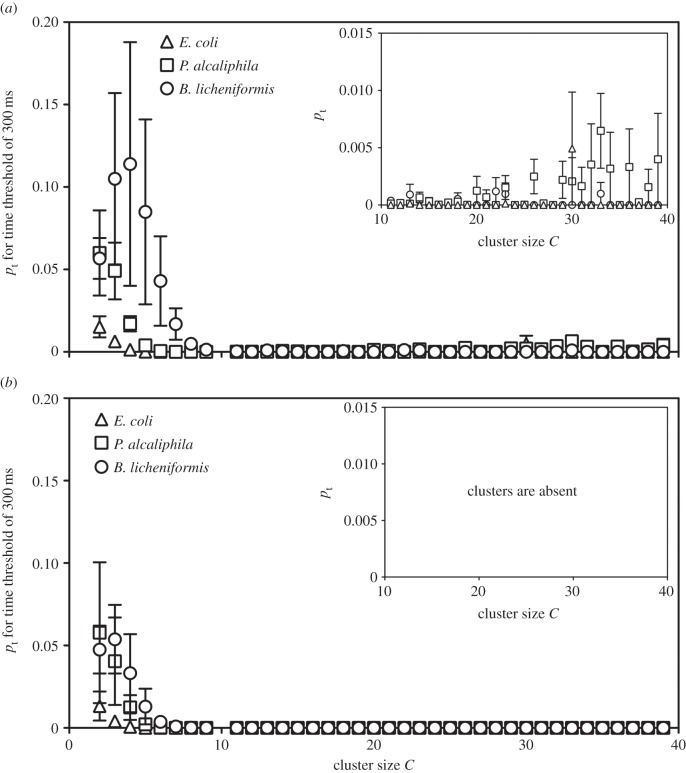
During MEA recording, the amplitude of the APs detected depends on the distance between the electrodes and the site of generation of the signal: the closer the source, the stronger and clearer the signal. Furthermore, spike amplitude is affected by the simultaneous firing of one or more cells. As a consequence, it is difficult to fully reconstruct the exact amplitude of a single spike. Therefore, to better characterize the electrical signal features produced by bacteria, we used another approach to analyse the synchronization phenomena that considers the spatio-temporal correlations of the measured spikes and not their amplitudes. We performed an analysis of the synchronized events by qualitatively comparing the electrical activity and the occurrence of synchronized events in time and space for the three different bacterial species and for random data (created in silico for each experiment and used to compare the obtained results with the experimental ones), while ignoring the spike amplitudes, to determine whether the experimental data differed from random data. We observed the appearance of temporal and spatio-temporal clusters in all cultures. Figures 7 and 8 show the distributions of temporal (pt) and spatio-temporal clusters (ps) versus cluster size C for Δt = 300 ms in bacteria (figures 7a and 8a) and random data (figures 7b and 8b). The presentation of the plot obtained using 300 ms as the time threshold is arbitrary; no different trends in the results were observed for different Δt (data not shown). The time threshold influences the absolute quantity of temporal and spatio-temporal clusters, not the relative differences between strains. In the random data, there was a critical value of cluster size Cm above which the clustering events were not observed; thus, cluster size can be considered a threshold that separates random data from data with deterministic characteristics. For bacteria, the clustering was also observed for sizes larger than Cm, thus demonstrating its purely deterministic origin. These results indicate that for cluster sizes larger than a determined value (Cm), the electrical spiking generated by bacteria shows organized synchronizations that are absent in random data. Moreover, by quantifying the temporal and spatio-temporal clusters for C > Cm, we observed that biofilm-forming bacteria had a higher average number of temporal and spatio-temporal clusters than E. coli. P. alcaliphila had larger values for pt and ps throughout all cluster sizes; B. licheniformis had a greater number of spatio-temporal clusterings than temporal ones, although temporal clusterings were observed; and E. coli showed no clustering except for a cluster size equal to 30, which may be an artefact (figures 7a and 8a). By contrast, in the case of small cluster sizes, i.e. C < Cm, the synchronized events originated both from random coincidence and deterministic sources. Nevertheless, some interesting information was evident in the pt and ps values for small cluster sizes calculated using different Δt values (electronic supplementary material, figure S4). As expected, with increasing values of Δt, which marks the temporal period for the spikes contributing to a given cluster, the values of pt and ps also increased. However, in the same range of Δt, differences between biofilm-forming and non-biofilm-forming bacteria were evident, as B. licheniformis and P. alcaliphila had more numerous temporal and spatio-temporal clusterings than E. coli (figure 9).
Figure 7.
Distribution of temporal clusters (pt) versus cluster size C for experimental (a) and random data (b) at Δt = 300 ms. In the random data, there is a value of C, defined as Cm, above which no clusters can be observed. In the experimental data, there are some temporal clusters above Cm, indicating the deterministic nature of the data.
Figure 8.
Distribution of spatio-temporal clusters (ps) versus cluster size C for experimental (a) and random data (b) at Δt = 300 ms. Similar to the observations for temporal cluster analysis, in the random data there is a value of C, defined as Cm, above which no clusters can be observed. In the experimental data, there are some temporal clusters above Cm, indicating the deterministic nature of the data.
Figure 9.
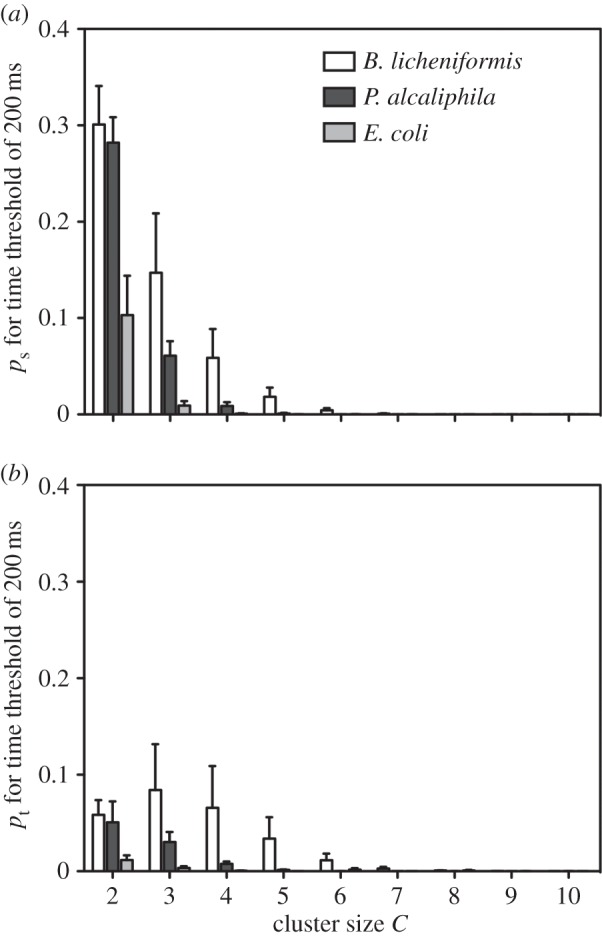
Distribution of spatio-temporal (ps) (a) and temporal (pt) (b) clusters versus cluster size C (2 ≤ C ≤ 10) for Δt = 200 ms, showing the different clustering properties of the three bacterial species. The cluster values of the biofilm-forming bacteria B. licheniformis and P. alcaliphila were higher than those of the non-biofilm-forming E. coli.
Finally, we performed a qualitative analysis of the selected cluster size (C = 2) at different Δt for spikes synchronized temporally (electronic supplementary material, figure S5) and spatio-temporally (electronic supplementary material, figure S6) recorded during the three different temporal zones: TZ1, TZ2 and TZ3. During each period, we observed higher numbers of temporal and spatio-temporal clusters in biofilm-forming bacteria compared with non-biofilm-forming bacteria. Such differences were observed in TZ2 and TZ3, which correspond to the periods of maximum spike rate and maximum biofilm quantification, respectively (figures 10 and 11). This result demonstrates that the development of a biofilm favours the propagation of electrical pulses.
Figure 10.
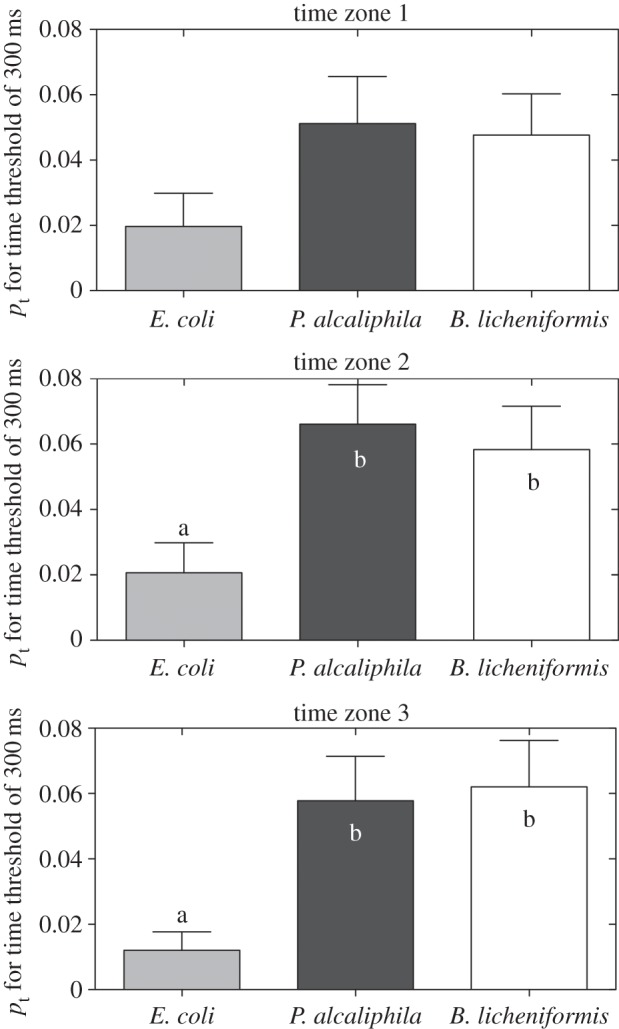
Temporal cluster (pt) quantification for cluster size C = 2 for Δt = 300 ms during the initial, middle and final growth phases (TZ1, TZ2 and TZ3, respectively). The values of pt were larger for biofilm-forming bacteria than for E. coli in TZ2 and TZ3, which correspond to the initial rapid growth period and maximum biofilm formation, respectively. Means with the same letter are not significantly different (Tukey–Kramer test, p < 0.05).
Figure 11.
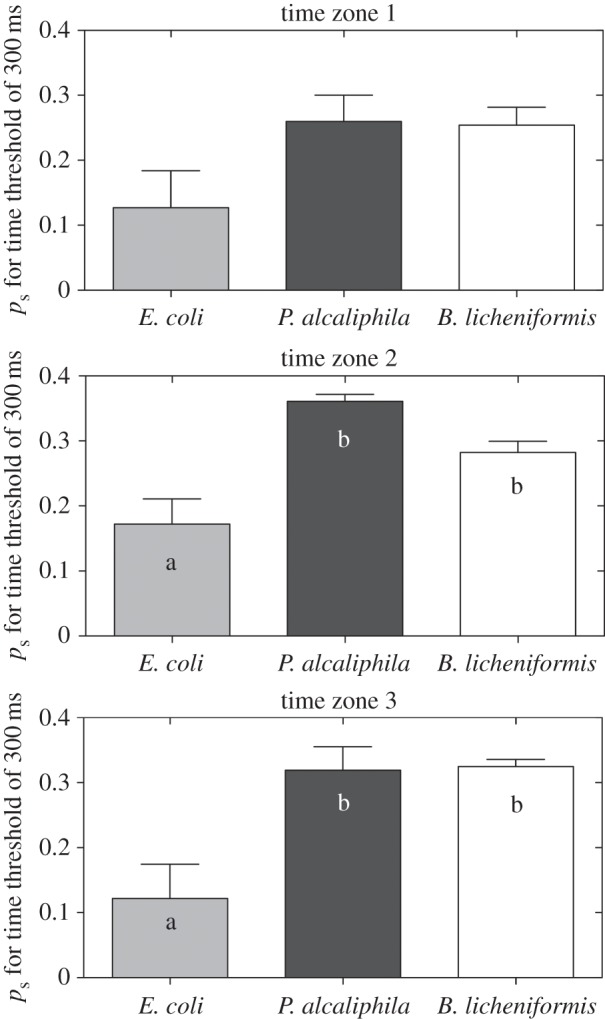
Spatio-temporal (ps) quantification for cluster size C = 2 for Δt = 300 ms during the initial, middle and final growth phases (TZ1, TZ2 and TZ3, respectively). The values of ps were larger for biofilm-forming bacteria than for E. coli in TZ2 and TZ3, corresponding to the initial rapid growth phase and maximum biofilm formation, respectively. Means with the same letter are not significantly different (Tukey–Kramer test, p < 0.05).
4. Discussion
As a result of biofilm formation, cells are immobilized and kept in close proximity, forming synergistic microconsortia in which intense interactions are observed [28]. The dynamics of connectivity and functionality during bacterial biofilm development are not completely understood. In this paper, the APs produced during the development of biofilms were recoded using an MEA system equipped with 59 microelectrodes. In an MEA recording, each single signal can be considered the sum of the signals generated by a large number of cells owing to the relatively large dimensions of the electrode compared with those of a single bacterium. In fact, up to hundreds of microbial cells may be in contact with just one electrode or detected by it (a 30 μm electrode detects an area of more than 100 µm in diameter [29]). The increase in the density of the culture and the natural sinking of cells on the electrode surface may be responsible for the initial increase in the spike amplitudes. In other words, the closer position of bacterial cells to the electrodes and the increase in the number of cells, typical of biofilm development, could be responsible for the detection of higher-quality signals. For example, it is possible that the stronger signals were the result of the simultaneous firing of a group of adjacent cells. The data revealed that, similar to the events that occur during the formation of neuron networks [13–15], the number of spatio-temporal synchronized events among bacterial cells increased as the biofilm developed, allowing the bacteria to interact. The stronger electrical activity observed in biofilm-forming bacteria suggests its important role in the emergence of collective behaviours.
As single cells a few micrometres in size, bacteria can perceive stimuli from a limited area in a limited time, but as a member of a complex super-organism (such as a colony or a biofilm), each bacterium must be able to sense and communicate with other cells to cooperate, first for the self-organization of the colony/biofilm, then for distribution tasks and, eventually, facing environmental challenges. Ben-Jacob described multicellular bacterial organizations as a ‘massive brain’ capable of information processing, collective memory and self-plasticity [30]. In this perspective, the experiments described here represent a further step for approaching bacterial communities as ‘intelligent’ super-organisms that make use of electric signals to communicate.
Supplementary Material
Acknowledgements
M.C. acknowledges Regione Toscana for financial support. E. Masi, S.M. and L.S. were supported by the Future and Emerging Technologies (FET) programme within the Seventh Framework Programme for Research of the European Commission, under FET-Open grant number 296582 (PLEASED). E. Masi, C.V. and S.M. designed the study. E. Masi, L.S., A.F. and E. Marchi conducted experiments. E. Masi and M.C. conducted data analysis. E. Masi, M.C., L.G., C.V. and S.M. wrote the manuscript. All authors contributed to the interpretation and discussion of the results.
References
- 1.Sauer K. 2003. The genomics and proteomics of biofilm formation. Genome Biol. 4, 219 ( 10.1186/gb-2003-4-6-219) [DOI] [PMC free article] [PubMed] [Google Scholar]
- 2.Tenorio E, Saeki T, Fujita K, Kitakawa M, Baba T, Mori H, Isono K. 2003. Systematic characterization of Escherichia coli genes/ORFs affecting biofilm formation. FEMS Microbiol. Lett. 225, 107–114. ( 10.1016/S0378-1097(03)00507-X) [DOI] [PubMed] [Google Scholar]
- 3.Lazazzera BA. 2005. Lessons from DNA microarray analysis: the gene expression profile of biofilms. Curr. Opin. Microbiol. 8, 222–227. ( 10.1016/j.mib.2005.02.015) [DOI] [PubMed] [Google Scholar]
- 4.Chambers JR, Sauer K. 2013. Small RNAs and their role in biofilm formation. Trends Microbiol. 21, 39–49. ( 10.1016/j.tim.2012.10.008) [DOI] [PMC free article] [PubMed] [Google Scholar]
- 5.Stoodley P, Sauer K, Davies DG, Costerton JW. 2002. Biofilms as complex differentiated communities. Annu. Rev. Microbiol. 56, 187–209. ( 10.1146/annurev.micro.56.012302.160705) [DOI] [PubMed] [Google Scholar]
- 6.O'Toole G, Kaplan HB, Kolter R. 2000. Biofilm formation as microbial development. Annu. Rev. Microbiol. 54, 49–79. ( 10.1146/annurev.micro.54.1.49) [DOI] [PubMed] [Google Scholar]
- 7.Ng WL, Bassler BL. 2009. Bacterial quorum-sensing network architectures. Annu. Rev. Genet. 43, 197–222. ( 10.1146/annurev-genet-102108-134304) [DOI] [PMC free article] [PubMed] [Google Scholar]
- 8.Galperin MY. 2004. Bacterial signal transduction network in a genomic perspective. Environ. Microbiol. 6, 552–567. ( 10.1111/j.1462-2920.2004.00633.x) [DOI] [PMC free article] [PubMed] [Google Scholar]
- 9.Shrout JD, Tolker-Nielsen T, Givskov M, Parsek MR. 2011. The contribution of cell-cell signaling and motility to bacterial biofilm formation. MRS Bull. 36, 367–373. ( 10.1557/mrs.2011.67) [DOI] [PMC free article] [PubMed] [Google Scholar]
- 10.Srivastava D, Waters CM. 2012. A tangled web: regulatory connections between quorum sensing and cyclic Di-GMP. J. Bacteriol. 194, 4485–4493. ( 10.1128/JB.00379-12) [DOI] [PMC free article] [PubMed] [Google Scholar]
- 11.Kralj JM, Hochbaum DR, Douglass AD, Cohen AE. 2011. Electrical spiking in Escherichia coli probed with a fluorescent voltage-indicating protein. Science 333, 345–348. ( 10.1126/science.1204763) [DOI] [PubMed] [Google Scholar]
- 12.Martinac B, Rohde PR, Cranfield CG, Nomura T. 2013. Patch clamp electrophysiology for the study of bacterial ion channels in giant spheroplasts of E. coli. Methods Mol. Biol. 966, 367–380. ( 10.1007/978-1-62703-245-2_23) [DOI] [PubMed] [Google Scholar]
- 13.Chiappalone M, Bove M, Vato A, Tedesco M, Martinoia S. 2006. Dissociated cortical networks show spontaneously correlated activity patterns during in vitro development. Brain Res. 1093, 41–53. ( 10.1016/j.brainres.2006.03.049) [DOI] [PubMed] [Google Scholar]
- 14.Illes S, Fleischer W, Slebler M, Hartung HP, Dihne M. 2007. Development and pharmacological modulation of embryonic stem cell-derived neuronal network activity. Exp. Neurol. 207, 171–176. ( 10.1016/j.expneurol.2007.05.020) [DOI] [PubMed] [Google Scholar]
- 15.Madhavan R, Chao ZC, Potter SM. 2007. Plasticity of recurring spatiotemporal activity patterns in cortical networks. Phys. Biol. 4, 181–193. ( 10.1088/1478-3975/4/3/005) [DOI] [PMC free article] [PubMed] [Google Scholar]
- 16.Hulata E, Baruchi I, Segev R, Shapira Y, Ben-Jacob E. 2004. Self-regulated complexity in cultured neuronal networks. Phys. Rev. Lett. 92, 198105 ( 10.1103/PhysRevLett.92.198105) [DOI] [PubMed] [Google Scholar]
- 17.Fuchs E, Ayali A, Robinson A, Hulata E, Ben-Jacob E. 2007. Coemergence of regularity and complexity during neural network development. Dev. Neurobiol. 67, 1802–1814. ( 10.1002/dneu.20557) [DOI] [PubMed] [Google Scholar]
- 18.Ayali A, Fuchs E, Ben-Jacob E, Cohen A. 2007. The function of intersegmental connections in determining temporal characteristics of the spinal cord rhythmic output. Neuroscience 147, 236–246. ( 10.1016/j.neuroscience.2007.04.014) [DOI] [PMC free article] [PubMed] [Google Scholar]
- 19.Masi E, et al. 2009. Spatiotemporal dynamics of the electrical network activity in the root apex. Proc. Natl Acad. Sci. USA 106, 4048–4053. ( 10.1073/pnas.0804640106) [DOI] [PMC free article] [PubMed] [Google Scholar]
- 20.Manachini PL, Fortina MG, Levati L, Parini C. 1998. Contribution to phenotypic and genotypic characterization of Bacillus licheniformis and description of new genomovars. Syst. Appl. Microbiol. 21, 520–529. ( 10.1016/S0723-2020(98)80064-7) [DOI] [PubMed] [Google Scholar]
- 21.Santopolo L, Marchi E, Frediani L, Decorosi F, Viti C, Giovannetti L. 2012. A novel approach combining the Calgary biofilm device and phenotype microarray for the characterization of the chemical sensitivity of bacterial biofilms. Biofouling 28, 1023–1032. ( 10.1080/08927014.2012.726352) [DOI] [PubMed] [Google Scholar]
- 22.Viti C, Decorosi F, Tatti E, Giovannetti L. 2007. Characterization of chromate-resistant and -reducing bacteria by traditional means and by a high-throughput phenomic technique for bioremediation purposes. Biotechnol. Prog. 23, 553–559. ( 10.1021/bp0603098) [DOI] [PubMed] [Google Scholar]
- 23.Sambrook J, Fritsch EF, Maniatis T. 1989. Molecular cloning: a laboratory manual. Cold Spring Harbour, NY: Cold Spring Harbor Laboratory. [Google Scholar]
- 24.Noumi T, Maeda M, Futai M. 1987. Mode of inhibition of sodium azide on the H+-ATPase of Escherichia coli. FEBS Lett. 213, 381–384. ( 10.1016/0014-5793(87)81526-0) [DOI] [PubMed] [Google Scholar]
- 25.Joshi AK, Ahmed S, Ferro-Luzzi Ames G. 1989. Energy coupling in bacterial periplasmic transport systems: studies in intact Escherichia coli cells. J. Biol. Chem. 264, 2126–2133. [PubMed] [Google Scholar]
- 26.Rall W. 1969. Distribution of potential in cylindrical coordinates and time constants for a membrane cylinder. Biophys. J. 9, 1509–1541. ( 10.1016/S0006-3495(69)86468-4) [DOI] [PMC free article] [PubMed] [Google Scholar]
- 27.Plonsey R. 1977. Action potential sources and their volume conductor fields. Proc. IEEE 65, 601–611. ( 10.1109/PROC.1977.10539) [DOI] [Google Scholar]
- 28.Flemming HC, Wingender J. 2010. The biofilm matrix. Nat. Rev. Microbiol. 8, 623–633. ( 10.1038/nrmicro2415) [DOI] [PubMed] [Google Scholar]
- 29.Lin Y, Chen C, Chen L, Zheng S, Luo Q. 2005. The analysis of electrode-recording-horizon in multi-electrode array (MEA). In Proc. 27th Annual Int. Conf. of the Engineering in Medicine and Biology Society, pp. 7345–7348. ( 10.1109/IEMBS.2005.1616208) [DOI] [PubMed] [Google Scholar]
- 30.Ben-Jacob E. 2009. Learning from bacteria about natural information processing. Ann. N.Y. Acad. Sci. 1178, 78–90. ( 10.1111/j.1749-6632.2009.05022.x) [DOI] [PubMed] [Google Scholar]
Associated Data
This section collects any data citations, data availability statements, or supplementary materials included in this article.


