Abstract
The effects of a superior-semicircular-canal (SSC) dehiscence (SSCD) on hearing sensitivity via the air-conduction (AC) and bone-conduction (BC) pathways were investigated using a three-dimensional finite-element (FE) model of a human middle ear coupled to the inner ear. Dehiscences were modeled by removing a section of the outer bony wall of the SSC and applying a zero-pressure condition to the fluid surface thus exposed. At each frequency, the basilar-membrane velocity, vBM, was separately calculated for AC and BC stimulation, under both pre- and post-dehiscence conditions. Hearing loss was calculated as the difference in the maximum magnitudes of vBM between the pre- and post-dehiscence conditions representing a change in hearing threshold. In this study, BC excitations were simulated by applying rigid-body vibrations to the model along the directions of the (arbitrarily defined) x, y, and z axes of the model.
Simulation results are consistent with previous clinical measurements on patients with an SSCD and with results from earlier lumped-element electrical-circuit modeling studies, with the dehiscence decreasing the hearing threshold (i.e., increasing vBM) by about 35 dB for BC excitation at low frequencies, while for AC excitation the dehiscence increases the hearing threshold (i.e., decreases vBM) by about 15 dB. A new finding from this study is that the initial width (defined as the width of the edge of the dehiscence where the flow of the fluid-motion wave from the oval window meets it for the first time) on the vestibular side of the dehiscence has more of an effect on vBM than the area of the dehiscence. Analyses of dehiscence effects using the FE model further predict that changing the direction of the BC excitation should have an effect on vBM, with vBM being about 20 dB lower due to BC excitation parallel to the longitudinal direction of the BM in the hook region (the x direction) as compared to excitations in other directions (y and z). BC excitation in the x direction and with a ‘center’ dehiscence located midway along the length of the SSC causes a reduction in the anti-symmetric component of the fluid pressure across the BM, as compared to the other directions of BC excitation, which results in a decrease in vBM at high frequencies.
1. Introduction
A semicircular-canal dehiscence (SCD) is characterized by a pathological opening in a small section of the bony wall of the semicircular canal (SC) of the inner ear. An SCD can be found in three different places according to different etiologies: the superior, lateral, and posterior SCs. Regardless of differences in SCD location, dehiscence patients have complained of similar symptoms such as vertigo, oscillopsia, and/or hearing loss (Minor et al., 1998; Chien et al., 2011).
Most previous studies have focused on superior-semicircular-canal (SSC) dehiscence (SSCD). Minor et al. (1998) first reported vertigo caused by an SSCD, and consequently many experiments have been performed to investigate vertigo (Minor, 2000; Cremer et al., 2000) and auditory symptoms due to an SSCD (Mikulec et al., 2004; Sohmer et al., 2004; Songer and Rosowski, 2005; Attias et al., 2011). Furthermore, SSCD effects on hearing thresholds were investigated theoretically using lumped-element electrical circuit models (Rosowski et al., 2004; Songer and Rosowski, 2007). The previous studies reached the consensus that a dehiscence acts as a third window in the inner ear that shunts a portion of the fluid motion away from the cochlea, with the first two such windows being the oval window and the round window, such that it acts as an additional pathway that alters the normal functioning of the SC. This shunting of the fluid motion away from the cochlea through the SCD increases the air-conducted (AC) threshold of hearing, which is well understood. But it also decreases the bone-conducted (BC) threshold, producing an improvement in BC hearing at low frequencies, which has not been well understood. Recently, the relationship between the hearing threshold and the dehiscence size (or location) has been studied in order to elucidate the mechanisms of SSCD syndrome and develop ways of screening patients for SSCD (Rajan et al., 2008; Songer and Rosowski, 2010; Niesten et al., 2012). Large air-bone gaps (ABGs) were shown to accompany SSCDs at low frequencies through animal experiments (fat sand rat and chinchilla).
The purpose of this study is to provide insight into the fundamental characteristics of SSCD syndrome under both AC and BC excitation. In order to do so, a 3-D finite-element (FE) human-ear model was used, consisting of the middle ear, cochlea, and SCs. For simplicity, the present model formulation is for passive mechanics and does not consider the active cochlear amplification mechanisms (e.g., Ren, 2005; Shera, 2007; Liu and Neely, 2010; Yoon et al., 2011). The basilar-membrane (BM) velocity was used to indicate hearing sensitivity, under the assumption that the BM velocity is inversely proportional to the hearing threshold. The model was used to investigate how hearing due to an SSCD varies at low and high frequencies resulting from variations in SSCD size, SSCD location, and the direction of BC stimulation. Furthermore, ABGs due to SSCDs were predicted at frequencies above 4 kHz, where experimental data do not yet exist.
2. Methods
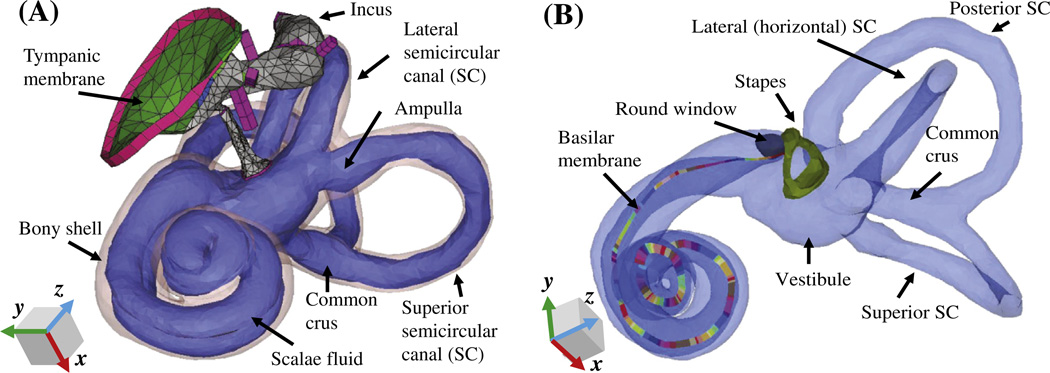
In order to investigate the effects of SSCDs on hearing loss, a 3-D FE coiled-cochlea model with SCs was developed (Fig. 1). The FE model consists of the middle ear and cochlea, whose geometry was obtained by micro-computed tomography (µCT) scanning, and has the following mechanical characteristics: 1) inviscid cochlear fluid, 2) orthotropic elasticity in the BM, and 3) a complex speed of sound in the fluid and complex Young’s modulus to incorporate damping. Details of the model are described elsewhere (Kim et al., 2011). In the current study, the geometry and boundary conditions of this FE model were modified to simulate the SSCD effects.
Fig. 1.
A finite-element (FE) model of the human auditory periphery. (A) Middle-ear structures coupled to the inner ear are shown, with the bony shell of the inner ear represented by a transparent pink outline. (B) The scalae fluid of the inner ear is shown, including for each semicircular canal (SC), represented by a light-blue color, and the stapes, round window, and basilar membrane (BM) are highlighted. The different colors of the BM are used to differentiate individual sections, each of which has its own local coordinates and Young’s modulus. The eardrum, malleus, and incus are masked in (B) for visualization purposes.
2.1. Modified model geometry
In this study, a dehiscence was modeled by making a hole in the SSC by removing a fraction of its bony elements. Clinically, SCDs have been shown to vary from 1 to7 mm in length (mean: 3.64 mm, Chien et al., 2012) and they can be located anywhere along a given SC. The simulations were separated into two groups to better delineate the effects of SSCD size and location on the AC and BC thresholds.
2.1.1. Group I
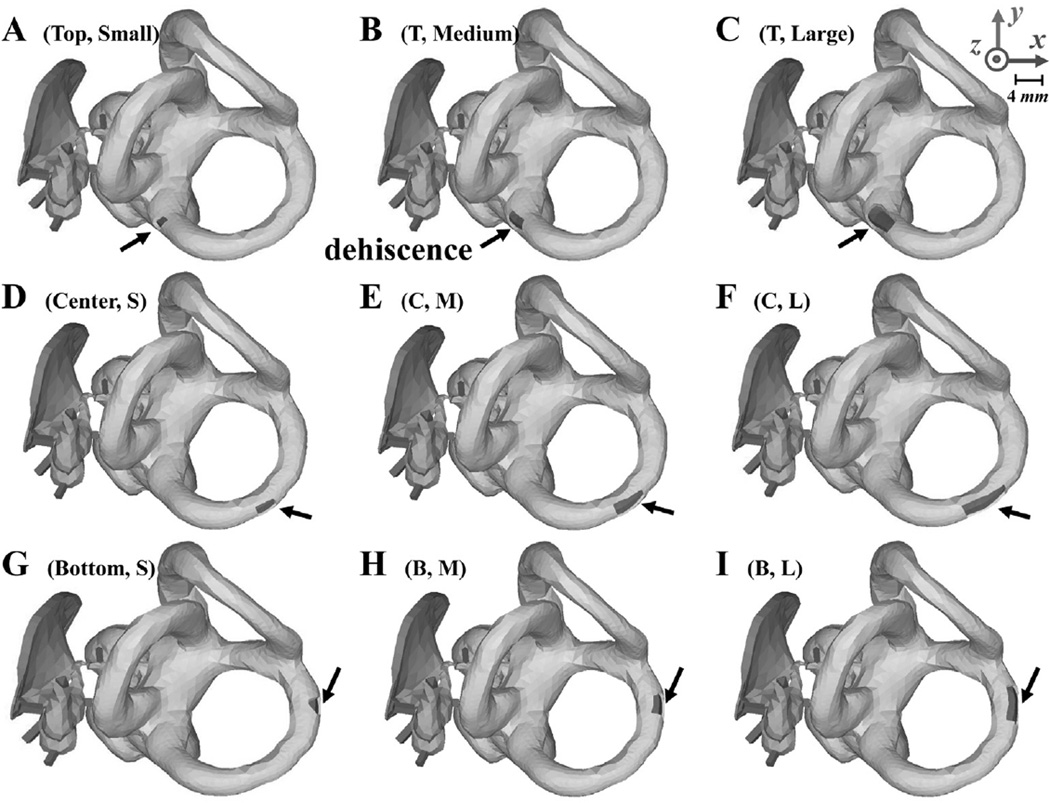
A rectangular hole representing the SSCD was alternated between three different locations, indicated by ‘top’, ‘center’, and ‘bottom’ in the rows of Fig. 2; and three different sizes, denoted as ‘small’, ‘medium’, and ‘large’ in the columns of Fig. 2. The areas of the three sizes were 0.78, 1.54, and 3.27 mm2 respectively. The top and bottom locations represent the cases in which the SSCD is located, respectively, near the ampulla or near the common crus shared between the posterior canal and superior canal. The center hole is located midway between the ampulla and the common crus on the canal. Fig. 2 illustrates the nine combinations of SSCD location and size used in this study under Group I.
Fig. 2.
Depictions of the FE middle-ear and inner-ear models used in the experiments performed for Group I, with various sizes (rows) and locations (columns) of the superior-semicircular-canal dehiscence (SSCD). The locations of the SSCD in the first row (A, B, and C), second row (D, E, and F), and third row (G, H, and I) are called ‘top’, ‘center’, and ‘bottom’, respectively, while the sizes of the SSCD in the first column (A, D, and G), second column (B, E, and H), and third column (C, F, and I) have respective areas of 0.78, 1.54, and 3.27 mm2. The black arrows point to the SSCD in each case. The same x, y, and z axes as Fig. 1 are used here.
2.1.2. Group II
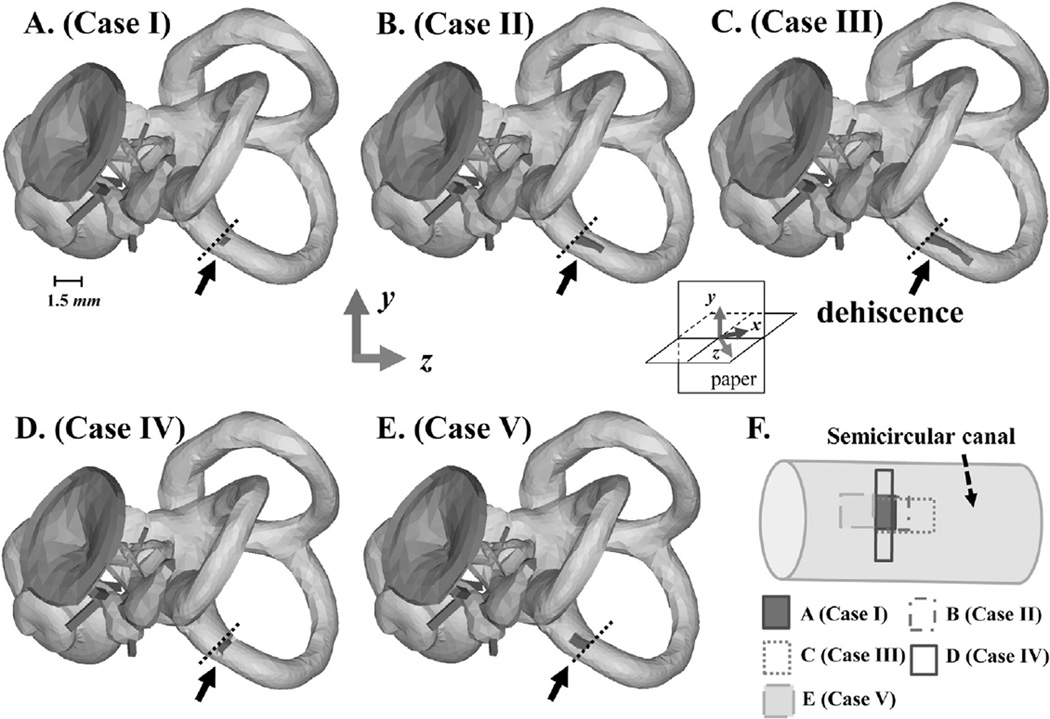
Additional factors that can have an effect on hearing besides the size and location of the dehiscence are the shape of the dehiscence and the distance between the oval window (OW) and the nearest opening location of the dehiscence. Five cases, shown in Fig. 3, were simulated to test the effects of these factors while keeping the location of the dehiscence fixed. The variables of interest in this simulation group, Group II, were the distance from the input window (i.e., from the OW) to the nearest point of the dehiscence, and the width of the dehiscence. The distance from the OW to the nearest point of the dehiscence was the same in all cases except for Case V, for which the distance was smaller. On the other hand, the area of the dehiscence was differentiated into three cases, which were smaller (i.e., Case I) or larger (i.e., Case III) than the cross-sectional area of the SC, or otherwise similar to the cross-sectional area of the SC (i.e., Cases II, IV, and V). Dehiscence widths were all the same except for Case IV, for which it was larger.
Fig. 3.
Depictions of the FE model experiments performed for Group II, in which the shape, width, and distance from the OW to the opening of the dehiscence were varied. Panels A–E correspond respectively to Cases I–V, and panel F summarizes the five different dehiscence cases. The vertical height of each dehiscence, as represented in panel F, is referred to as the ‘width’, while the horizontal length is referred to as the ‘length’. Black arrows point out each dehiscence, and the black dotted lines represent the same position in each model. As shown in A–D, the dehiscences of Cases I–IV all start at the same location. The dehiscences of Cases I–III share the same starting point and width, but their lengths, and therefore areas, are varied. The width of the dehiscence in Case IV is larger than the other cases, but since its length is much smaller than that of Cases II and III, its total area ends up being similar to that of Case II. Case V has a dehiscence area similar to that of Cases II and IV, but the distance between it and the OW is shorter than the other cases. The x, y, and z axes in this figure are the same as those defined for Figs. 1 and 2, but from this viewing angle the z axis points out of the page at a 45° angle and the x axis (hidden) points into the page at a 45° angle (see inset).
2.2. Material properties
Material properties for the FE model were reported previously (Kim et al., 2011), except for the round window (RW) and BM, since the properties of those structures have been altered from the previous model due to the modified geometry. The density of the RW was set to 1200 kg/m3, and its Young’s modulus was set to 0.05 MPa, with a loss factor (i.e., the ratio of the imaginary part to the real part of the complex Young’s modulus), η, of 0.8. In this study, the BM was divided into 35 equal-length sections. In order to model the stiffness change across these sections, the Young’s modulus of the BM was gradually decreased from the base to the apex (i.e., from 6.5 to 5.5 MPa in the longitudinal direction, and from 0.2 to 0.1 GPa in the transverse direction, with a loss factor of 0.3). In addition, about 100 points were used to represent the coiled shape of the BM in 3-D space. The density of the BM was assumed to be 1000 kg/m3, since the density of soft tissue is usually assumed to equal that of water. The orthotropic ratio, Elong/Etrans, where Elong and Etrans are the respective Young’s moduli for the longitudinal and transverse directions of each BM section, was set to 0.03.
2.3. Simulations with air- and bone-conducted excitations
A zero-pressure boundary condition was applied to the fluid surface exposed by the dehiscence, in order to simulate the SSCD condition in the model. This boundary condition approximately represents the SSCD condition in that the fluid in the SSC contacts the cerebrospinal fluid in the skull, and the cerebrospinal fluid volume is much larger than the fluid volume in the SSC, thus reducing the pressure at the interface to essentially zero. Detailed mathematical calculations and analyses that justify the use of the zero-pressure boundary condition are described in the attached Appendix.
AC excitations were simulated by assigning a uniformly distributed dynamic unit pressure over the surface of the tympanic membrane (TM) on the ear-canal side. Inertial BC excitations, on the other hand, were simulated by assigning a common displacement vector (both magnitude and phase) to the boundaries of the model. The rigid-body BC excitations were simulated in the directions defined by the three orthogonal axes of the model: x, y, and z (see Figs. 1–3). The x, y, and z directions were defined arbitrarily by the FE pre/post processing software HYPERMESH (Altair Engineering, Troy, MI, USA), and it should be noted that they 1) remain unchanged with respect to the anatomy throughout this study, and 2) are not aligned with any particular anatomical axes, including the direction perpendicular to the stapes footplate.
2.4. Hearing loss and the air-bone gap
Hearing loss due to the SSCD for both AC and BC pathways was calculated as the difference in the BM velocity between the pre-and post-dehiscence conditions. Experimentally, hearing thresholds were found in chinchilla by measuring the cochlear potential (Songer and Rosowski, 2010). For this study, the BM velocity was used to estimate the hearing loss, with the assumption that the BM velocity is inversely proportional to the hearing threshold. After calculating the maximum BM velocity for the pre- and post-SSCD conditions, the difference between these maximum BM velocities was regarded as the hearing loss, for both AC and BC cases. An air-bone gap (ABG) was calculated by measuring the difference between the AC and BC hearing losses.
3. Results
The results of simulations for Group I show the effects of SSCD location and size on the cochlear-fluid pressure and BM velocity, while the results from Group II show the effects of SSCD shape. It should be noted that since variations in the SSCD location and size are far smaller for Group II than for Group I, the changes in the fluid pressure due to the SSCD are much smaller in Group II. In spite of their small pressure changes, the Group II simulations are meaningful since they show the effects of changing the SSCD shape (e.g., conserving the area while altering the width and length).
3.1. Group I
3.1.1. Fluid pressure in the scala vestibuli and scala tympani for Group I
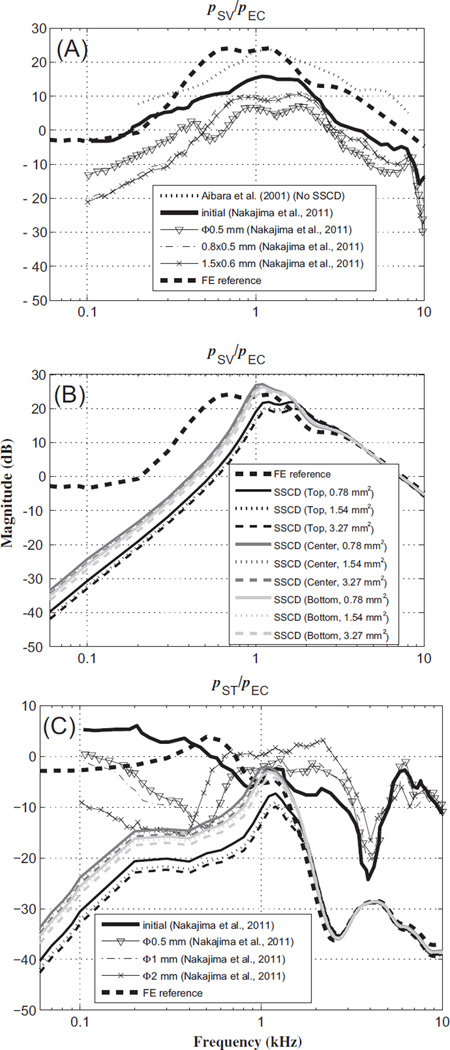
Nakajima et al. (2011) measured the fluid pressures in the scala vestibule (SV) and scala tympani (ST) of human temporal bones (pSV and pST, respectively) in response to AC stimuli, to test the hypothesis that an SCD acts to reduce the sound pressure in the cochlear vestibule as well as reduce the sound-pressure difference across the cochlear partition. Like in the experiments, the fluid pressures in the model, pSV and pST, were calculated for points behind the stapes footplate and RW, respectively. The fluid pressures were then normalized by the input pressure at the TM (assumed to be the same as the ear-canal pressure, pEC), and are compared with results from Nakajima et al. (2011) in Fig. 4.
Fig. 4.
Magnitude ratios of intracochlear pressure (within the scala vestibuli and scala tympani, pSV and pST, respectively) to ear-canal pressure (pEC), in response to AC stimuli. (A) Plots of pSV/pEC reference data with no dehiscence, from experiments and the FE model, as well as for several dehiscence conditions from experiments, (B) plots of pSV/pEC for FE-model simulations with dehiscences of various locations and areas, and (C) pST/pEC from experiments and the FE model. The legend for the SSCD status of the FE model in (B) also applies to (C). In the model, pSV and pST were calculated for points behind the stapes footplate and round window, respectively. pEC for the FE model was defined to be a unit pressure applied at the outer surface of the tympanic membrane (TM). The symbol ‘Φ’ in the legend represents the diameter of the dehiscence.
Fig. 4(A) and (B) show that the magnitudes of the pSV/pEC pressure ratio are qualitatively similar between the FE model and experimental results. For example, below about 1 kHz, there are about 10–20 dB decreases in pSV/pEC between the normal and SSCD conditions, for both the experimental results and the FE calculations. (The normal FE and normal experimental results are represented by thick dashed and thick solid lines, respectively, while in Fig. 4(B) and (C) the different line shades indicate the different SSCD locations and the different line styles represent the different SSCD sizes.) In addition, above 2 kHz there is little difference in the pressure ratio between the normal and SSCD conditions, for both experimental results and FE calculations. This similarity can also be observed for the magnitude of the pST/pEC pressure ratio, as shown in Fig. 4(C). At low frequencies (up to 1 kHz) in Fig. 4(C), it can be seen that the dehiscences present significant pressure-ratio decreases (about 10–25 dB) in both the FE model and the experiment. However, these differences become smaller as the input frequency increases, resulting in pre- and post-dehiscence pressure-ratio agreement to within about 5 dB at high frequencies (above 4 kHz), for both the FE model and experimental results.
3.1.2. Basilar-membrane velocity for Group I
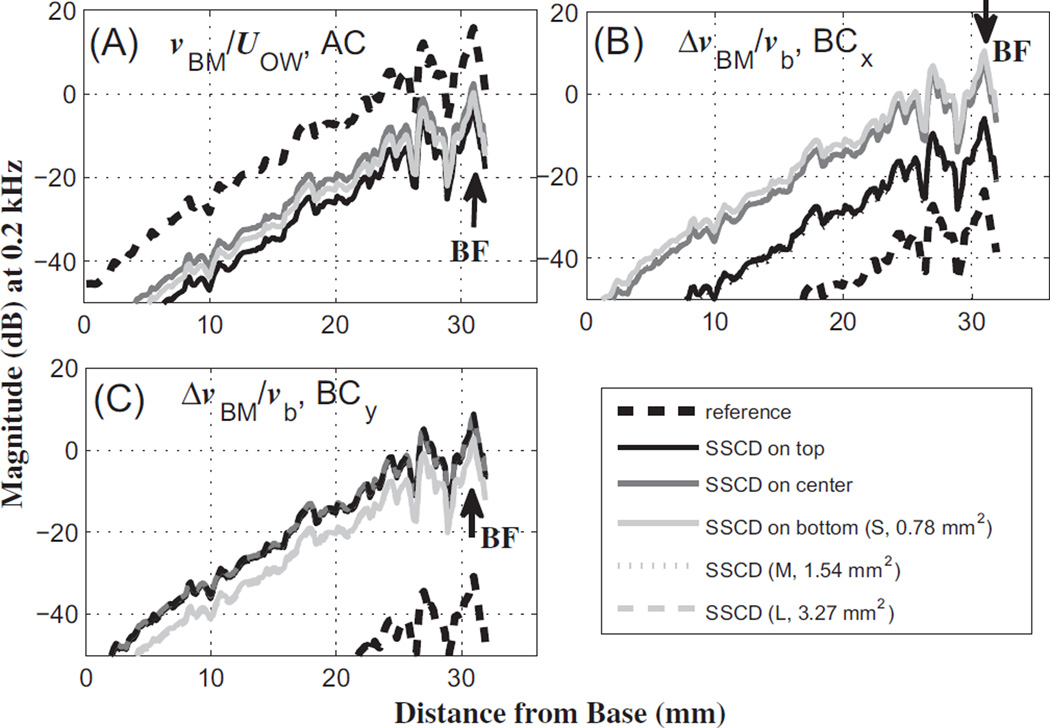
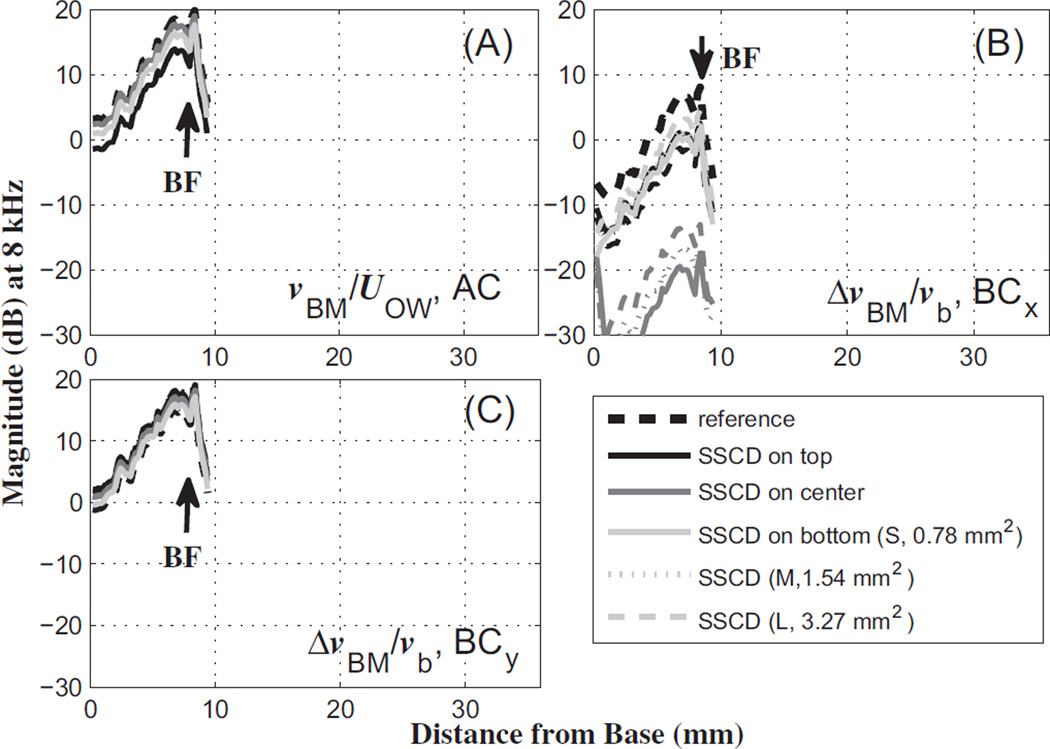
The effects of the dehiscence on the normalized BM velocity are shown in Figs. 5 and 6, for 0.2 kHz and 8 kHz, respectively. The normalization factors are the OW volume velocity (UOW) and bone velocity (vb) for AC and BC excitations, respectively. In the case of BC stimulation, the relative BM velocity, i.e., the difference between the BM velocity and the input bone velocity (ΔvBM = vBM – vb), is normalized by vb to yield the normalized relative BM velocity, ΔvBM/vb. Each BM-velocity profile along the length of the BM was obtained using one of four different excitations, which are AC, BC in the x direction (BCx), BC in the y direction (BCy), and BC in the z direction (BCz). Figs. 5 and 6 only show the AC, BCx, and BCy results among the four responses. The BCz results (not shown) are similar to the BCy results.
Fig. 5.
BM-velocity profiles along the length of the BM, in response to a 0.2 kHz tone, for (A) air-conducted (AC) input, (B) bone-conducted (BC) input in the x direction (BCx), and (C) BC input in they direction (BCy). The solid lines in different shades indicate the results for the different dehiscence locations from Group I. The different line types represent the results for the varied dehiscence sizes. The BM-velocity responses are normalized by (A) the oval-window volume velocity resulting from AC excitation in the ear canal (UOW), (B) the magnitude of the base bone velocity, vb, given in the x direction, and (C) vb given in the y direction. In addition, vBM indicates the BM velocity, and ΔvBM indicates the differential BM velocity between the BM and the base bone (ΔvBM = vBM – vb). S, M, and L in the legend denote the different dehiscence areas from Group I, 0.78,1.54, and 3.27 mm2, respectively. The effects of dehiscence size on the BM velocity were small enough that the respective lines overlap almost completely. The BF labels represent the best-frequency (BF) position corresponding to the given 0.2 kHz input frequency.
Fig. 6.
The same as Fig. 5, but for an 8 kHz input tone.
As seen in Fig. 5(A), the BM velocities at 0.2 kHz decrease due to the dehiscence by about 20 dB for AC input, without varying much due to the dehiscence location or size. However, the BM velocity generally increases due to the dehiscence for BC input, with the dehiscence location having a stronger effect than the size (Fig. 5(B) and (C)). In the case of BC input in the x direction (Fig. 5(B)), the BM velocity increases over the pre-dehiscence reference case by about 20 dB for the top location and by up to 40 dB for the center and bottom locations. In the case of BC input in the y direction (Fig. 5(C)), the BM velocities increase by about 40 dB regardless of the dehiscence size or location.
On the other hand, the BM velocities in response to an 8 kHz tone decrease by less than 5 dB due to the dehiscence for AC input, regardless of the location or size of the dehiscence (Fig. 6A). The BC input in the x direction leads to decreases in the BM velocity of around 7–8 dB due to a dehiscence in the top and bottom locations, and a decrease of more than 20 dB due to a dehiscence in the center location (Fig. 6B). There is very little increase in the BM velocity due to a dehiscence (less than 2 dB) for BC input in the y direction (Fig. 6C).
As shown in Figs. 5 and 6, the effects of the dehiscence size on BC hearing are less significant (0.1–0.3 dB in Fig. 5, 0.2–0.6 dB in Fig. 6) than the effects of the dehiscence location (1–2 dB in Fig. 5, 1–6 dB in Fig. 6), for the y-directional BC excitations. Although the z-directional BC results are not shown in Fig. 5 or Fig. 6, they are similar to the y-directional BC results. The effects of the SSCD size and location for the x-directional BC input are larger than those for the y- and z-directional BC inputs at 8 kHz (5–35 dB for BCx, and within 5 dB for BCy and BCz, in Fig. 6B and C). A possible explanation for this is given in the Discussion section.
3.1.3. Air-bone gap for Group I
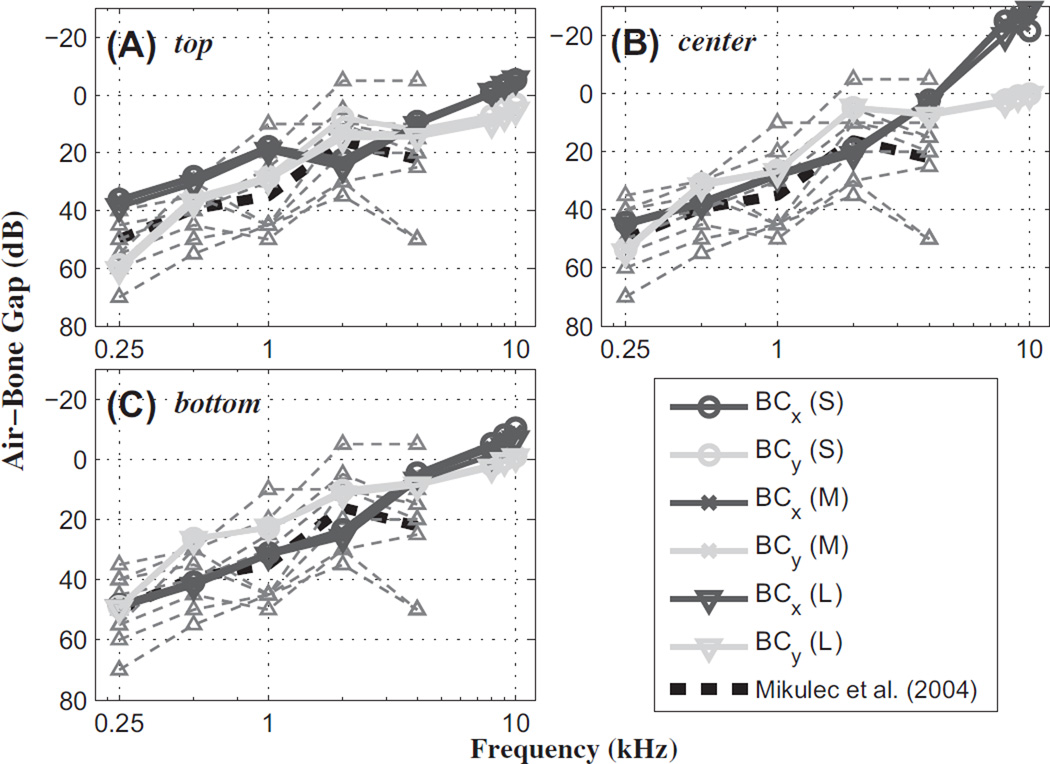
The effective hearing loss (HL) was calculated as the difference between the maximum BM velocity (or relative BM velocity) for the normal baseline condition (max for AC, and max for BC) and that for the dehiscence condition (max for AC, and max for BC). This was done for both AC and BC excitations. The air-bone gap (ABG) was then calculated as the difference between the hearing losses for AC and BC excitations (ABG = HLAC – HLBC). The results, compared with published clinical data for human (Mikulec et al., 2004), are shown in Fig. 7.
Fig. 7.
The air-bone gap (ABG) as a function of frequency, for different SSCD sizes and locations, and for different directions of BC excitation. The individual hearing-loss (HL) responses from the Mikulec et al. (2004) data (thin light-gray dashed lines with up-pointing triangular markers) and calculated average values (black dashed lines), are shown along with FE-model results (differently shaded lines with assorted markers). The SSCD locations were (A) top, (B) center, and (C) bottom. (S), (M), and (L) indicate the different dehiscence areas from Group I. z-directional results (not shown) were very similar to the y-directional results.
The ABGs calculated with the FE model show similar results to the average ABG of the clinically measured data, to within about 10 dB up to 4 kHz, regardless of the SSCD size or location (Fig. 7). While the clinical measurements are only available up to 4 kHz, the FE model is capable of providing and predicting higher-frequency responses, such as at 8 and 10 kHz. At 8 kHz, the y-directional BC inputs show ABG values similar to the results at 4 kHz. However, the model predicts that the x-directional BC input will lead to a decrease in the ABG from 4 kHz to 10 kHz. The decreased ABG above 4 kHz for the x-directional BC input is caused by an increase in HLBC due to a decrease in (Fig. 6B).
At low frequencies, BC inputs produce larger normalized relative BM velocities (i.e., ΔvBM/vb) with the dehiscence than for the normal condition, while AC inputs produce smaller normalized BM velocities (i.e., vBM/UOW) with the dehiscence than for the normal condition. Therefore, the ABG increases at low frequencies due to the dehiscence.
3.2. Group II
The same pressure and BM-velocity analyses for the Group I conditions were also performed for the Group II conditions.
3.2.1. Fluid pressure in the scala vestibuli and scala tympani for Group II
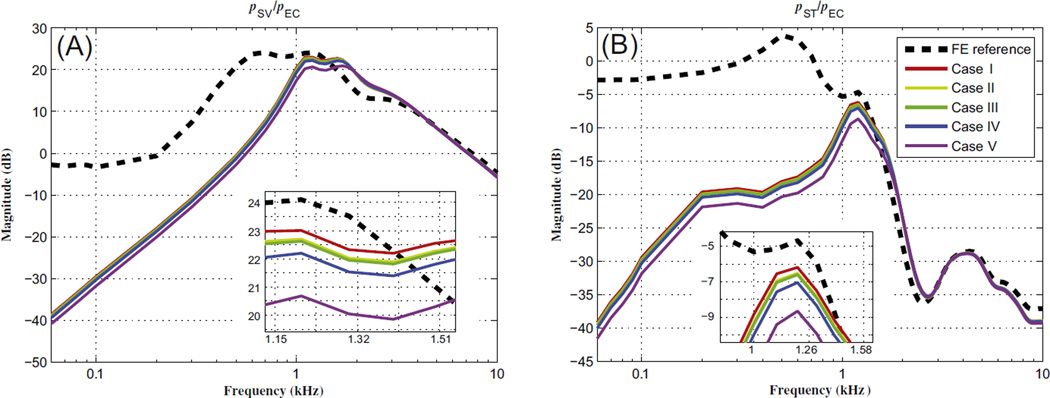
As shown in Fig. 8, the effects of the pressure decreasing due to the dehiscence are similar to those from Group I. The pressure variations among the different cases in Group II are much smaller (within about 2 dB) than for the cases in Group I, however, because the variations in the dehiscence size and location were also smaller. The pressure in the SV and ST decreased by about 2 dB when the dehiscence was located closer to the stapes (i.e., Case V), which is the most significant pressure difference among the cases in Group II. When the distance between the stapes and the edge of the dehiscence closest to the stapes is the same (i.e., Cases I–IV), then the size of the pressure change due to the dehiscence is the largest for Case IV and the smallest for Case I. Between Cases II and III, the size of the pressure change is almost the same in spite of differences in the dehiscence area. A key observation between Cases I and II is that the larger area of the Case II dehiscence causes a larger pressure decrease. Furthermore, the larger initial width (i.e., the width of the edge of the dehiscence closest to the stapes) of Case IV corresponds to a somewhat larger pressure decrease due to the dehiscence than for the comparable case with the smaller initial width but the same area (i.e., Case II).
Fig. 8.
Magnitude ratios of the scala-vestibuli pressure (pSV) and scala-tympani pressure (pST) to the ear-canal pressure (pEC), for Group II conditions. (A) pSV/pEC and (B) pST/pEC. In the model, pSV and pST were calculated for points behind the stapes footplate and round window, respectively. pEC was defined to be a unit pressure applied at the tympanic membrane (TM). Magnified views of the frequency regions where the pressure ratios reach their maximum values are shown as insets in each panel, and the legend in (B) applies to both panels.
3.2.2. Basilar-membrane velocity for Group II
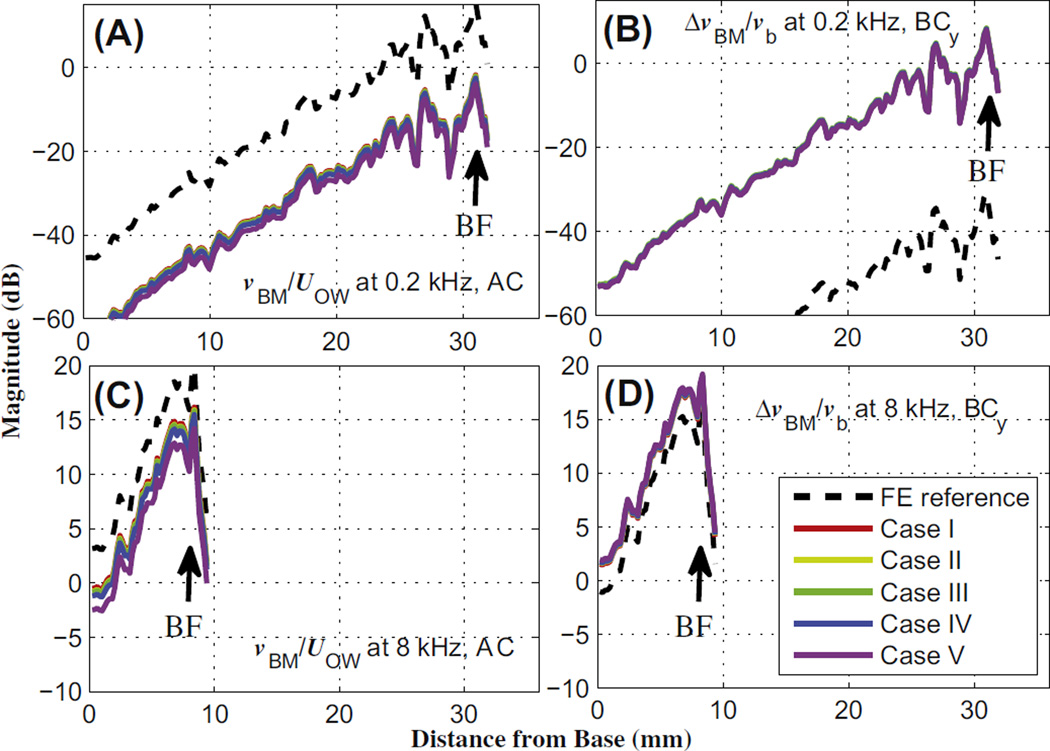
Fig. 9 shows the magnitude of the normalized BM velocity, for AC excitation, and normalized relative BM velocity, for BC excitation in the y direction, for the five different Group II cases, at a low (0.2 kHz) and high (8 kHz) frequency. As for Group I, the normalization factor was UOW for AC stimulation (i.e., vBM/UOW) and vb for BC stimulation (i.e., ΔvBM/vb). The BC excitations in the x and z directions (not shown) exhibited similar results to those in the y direction.
Fig. 9.
Magnitude of the BM velocity normalized by the OW volume velocity (UOW) for AC, and the relative BM velocity normalized by the bone velocity (vb) for BC, for Group II conditions. The first row (A and B) corresponds to the low frequency, 0.2 kHz, for AC and y-directional BC excitations, respectively, while the second row (C and D) contains the respective responses at the high frequency, 8 kHz. Except for the no-dehiscence reference case, most cases are closely aligned with one another.
For AC stimulation, the normalized BM velocity decreased due to all of the dehiscences, at both low and high frequencies. Case I showed the smallest decrease in the magnitude of vBM/UOW among the five different dehiscence cases, while Case V showed the largest decrease, as can be seen in the left column of Fig. 9.
For BC stimulation, the normalized relative BM velocity increased at both the low and the high frequency. At 0.2 kHz, the y-directional BC input increased the normalized relative BM velocity by about 50 dB, while for the same input direction at 8 kHz it only increased by 2–3 dB. However, the differences among the five dehiscence cases were small, similar to the AC results.
4. Discussion
Previous studies using a two-port model for the middle ear and a lumped-element model representation of the SSC and cochlea (Songer and Rosowski, 2007) showed that changes in the shunting of the fluid-motion wave in the inner ear depended on the location of the SSCD, such that dehiscences located closer to the vestibule (Fig. 1B) were predicted to have larger effects on hearing sensitivity than those located more distant from the vestibule, which is consistent with experimental results (Songer and Rosowski, 2005, 2006). Furthermore, they found that a dehiscence area larger than the cross-sectional area of the SSC did not further change the hearing thresholds compared to when the dehiscence area was equal to the cross-sectional area of the SSC. However, their studies were based on the chinchilla, whereas the 3-D FE model in this study has been constructed based on human middle-ear and cochlear geometry. Therefore, the present model can help with understanding SSCD effects in human. In addition, the 3-D model can help to clarify the effects of the shape of an SSCD and the effects of varying the direction of the BC excitations, which are difficult to show in a lumped-element model.
4.1. Effects of the SSCD on vestibular pressure
Fig. 4 demonstrates that the location of the dehiscence has more of an effect on vestibular pressure than the size of the dehiscence. Varying the dehiscence location produces a 3–10 dB difference in the pressure magnitude among the various cases (represented by the different shades in Fig. 4), whereas varying the dehiscence size produces only a maximum 1 dB difference among the cases (represented by the different line types in Fig. 4). These small effects due to the dehiscence size can be explained in terms of the dehiscence area. The simulated dehiscence cases in Group I had three different areas for each of the three locations (top, center, and bottom), which were 0.78, 1.54, and 3.27 mm2. At each dehiscence location, the cross-sectional area of the SC (ASC) was about 1.0 mm2 in the model, so the 1.54 and 3.27 mm2 dehiscence areas (AD) were larger than the SC cross-sectional area. The larger dehiscence areas (AD > ASC) cannot significantly change ZSC in comparison to dehiscence areas similar to the SC cross-sectional area (AD ≈ ASC). Therefore, the difference between the pressure decreases due to the dehiscence for these two cases was insignificant, as Songer and Rosowski (2007, 2010) suggested.
On the other hand, the effects of dehiscence location were more significant. As shown in Fig. 2, the distance between the input window (i.e., the OW) and the dehiscence was shortest for the top location among the three cases in the Group I simulations, whereas it was longest for the center location. The top dehiscence shows the most significant pressure decrease, while the center dehiscence shows the smallest pressure decrease.
The effects of dehiscence size and location were also explored in the Group II simulations. Cases I, II, and III exhibited different pressure decreases due to their different dehiscence areas (0.4, 1.0, and 1.6 mm2, respectively), though the width and starting point of the dehiscences were all the same (Fig. 8). In these simulations, the cross-sectional area of the SC at the dehiscence location was about 1 mm2, which was similar to the dehiscence areas for Cases II, IV, and V (1.0 mm2). Between Cases II and III, there was little difference in the pressure (less than 0.1 dB) despite a big difference in the dehiscence areas (0.6 mm2 difference). This is consistent with previous studies (Songer and Rosowski, 2005, 2006) and with the results of the Group I simulations. That is, when the dehiscence area is already greater than the SC cross-sectional area, then further increases to the dehiscence area do not make a significant difference. On the other hand, even though Cases II and IV had similar dehiscence areas, Cases I and IV had a larger pressure difference (about 0.8 dB) than for Cases I and II (or Cases I and III, about 0.3–0.4 dB). This larger pressure difference between Cases I and IV as compared to between Cases I and II (or III) can be explained by the different initial width of the Case IV dehiscence. Although the dehiscence of Case IV started at the same location as Case II, its width was larger than that of Case II, such that the fluid-motion wave from the OW was mostly shunted through the part of the dehiscence closest to the OW rather than more evenly over the full area of the dehiscence. Case V, on the other hand, showed the most significant pressure decrease despite its dehiscence area being equal to that of Cases II and IV and its initial width being the same as Cases I, II, and III. This is due to the starting point of the dehiscence being closer to the OW for Case V than for the other cases. Previous studies (Rajan et al., 2008; Songer and Rosowski, 2007) showed that, at low frequencies, a larger dehiscence up to the cross-sectional area of the SC caused a larger decrease in the hearing threshold for AC stimulation, while it caused a larger increase in the hearing threshold for BC stimulation. In addition, Songer and Rosowski (2010) proposed that a shorter distance between the input window (OW) and the dehiscence increases the hearing threshold for AC stimulation. These previous studies can be supported by the simulation results, in that the effects of the dehiscence can be varied by varying the width of the starting point of the dehiscence, even if the dehiscence area remains the same. In other words, if the distances between the OW and the dehiscence are the same, then the most important factor in determining the pSV and pST decrease is the width of the dehiscence (see Fig. 3F) at the point where the flow of the fluid-motion wave from the OW first encounters the dehiscence, i.e., the initial width.
4.2. Effects of the SSCD on BM velocity
4.2.1. Fluid volume velocity
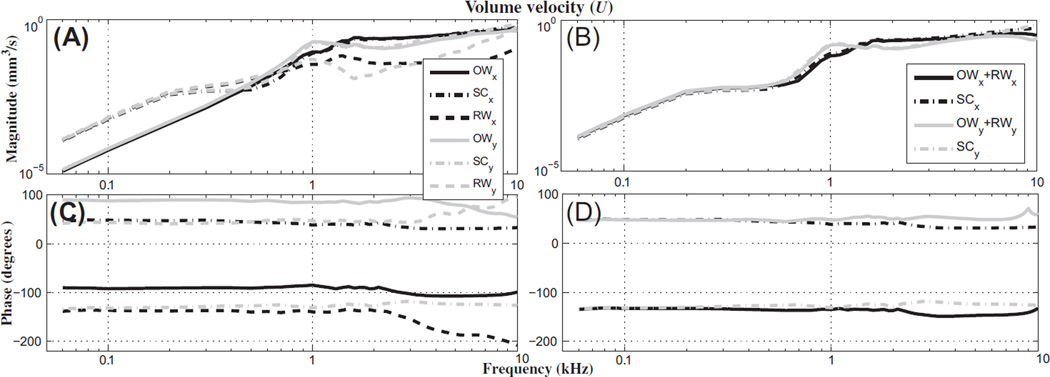
Fig. 5 shows that, at a low frequency (0.2 kHz), the normalized BM velocities decrease by about 20 dB due to the SSCD in response to AC excitation, whereas the normalized relative BM velocities increase by about 20–40 dB in response to BC excitation. This supports the idea that a dehiscence acts as a third window to the cochlea due to the following reasons: 1) for AC stimulation, the flow of the fluid-motion wave from the OW shunts away from the cochlea through the dehiscence, and 2) for BC stimulation the dehiscence acts as an additional window through which a fluid-motion wave can move into the cochlea and potentially improve hearing. Specifically, as shown in Fig. 10(A), the model results for BC stimulation at low frequencies (e.g., 0.2 kHz) show that, with the dehiscence, the magnitude of the volume velocity of the round window (URW) is almost the same as that of the SCs (USC), but not the same as that of the OW (UOW). The phases of the URW and USC differ by 180° (Fig. 10C). USC is calculated by summing the volume velocities entering the two surfaces connecting the vestibule to the SCs (Fig. 11A).
Fig. 10.
Individual and summed volume velocities of the oval window (OW), semicircular canals containing a dehiscence (SC), and round window (RW), for BC excitations in the x and y directions. The top row (A and B) contains volume-velocity magnitudes, and the bottom row (C and D) contains the phase. The first column (A and C) contains the individual volume velocities of the OW, SCs, and RW, while the second column (B and D) contains the volume velocities of two different groups, i.e., OW + RW and the SCs. The volume velocity of the SCs is calculated at the contact surfaces between the vestibule and the SCs (see Fig. 11A). In the legend, subscripts x and y represent the directions of the BC excitations.
Fig. 11.
Geometric features of the inner ear important for fluid volume-velocity calculations. (A) Four surfaces (the OW, RW, and two entrances into the SCs from the vestibule) for which volume velocity is calculated in this study (see Fig. 10) are shown, with the middle-ear structure masked for better visualization. (B) A simplified 2-D conceptual diagram of the cochlea with a semicircular canal shows how the x direction of the 3-D diagram relates to the orientation of the scalae fluid chambers in the hook region and a center dehiscence on the SSC. The 2-D diagram was drawn to show the relationship between the orientation of the scalae fluid chambers in the hook region, the x direction, and the normal direction to the dehiscence surface for a center dehiscence, but is not intended to accurately convey the location of a center dehiscence and the y direction as they appear in the 3-D diagram.
At high frequencies (above approximately 4 kHz), the x-directional BC input with the center dehiscence causes a decrease in vBM (Fig. 6B), but this is different from the AC, BCy, and BCz results at high frequencies, for which the center dehiscence does not significantly affect vBM (within 5 dB). To understand why the BCx results differ from the others, it is necessary to analyze the model responses in terms of the direction of the BC excitation and the location of the SSCD. First, considering the volume velocities of the OW, RW, and SCs, as Fig. 10(B) and (D) show, the combined volume velocity of the OW and RW (UOW + URW) matches the magnitude of USC (USC is the combined volume velocity of the two ‘entrances into the SCs’ shown in Fig. 11) and has a phase that is shifted 180° from that of USC. At low frequencies (below about 0.3 kHz) in Fig. 10(A), UOW is negligible, such that URW is essentially the same as USC, whereas at high frequencies (above 0.5 kHz) URW is negligible such that UOW is essentially the same as USC. This means that when there is a dehiscence, at low frequencies the fluid-motion wave in the cochlea flows mostly from the SCs to the RW (through the SV and ST), whereas at high frequencies the fluid-motion wave instead flows mostly from the SCs to the OW. This is mostly because the RW impedance is lower than the OW impedance at the lower frequencies, whereas the relationship between these two impedances becomes comparable or reversed at the higher frequencies. Factors responsible for the x-directional results being so different from the y- and z-directional results are explored next.
As shown in Fig. 11(B), the x direction happens to be aligned with the longitudinal direction of the SV fluid chamber in the hook region at the base of the cochlea. Since the x direction runs essentially parallel to the BM in the hook region, one could conclude that an x-directional BC stimulation would cause a relatively large symmetric pressure component (corresponding to the “fast wave” in the cochlea) and a relatively insignificant anti-symmetric pressure component (corresponding to the “slow wave” in the cochlea) to be established across the two fluid chambers in the hook region. The anti-symmetric pressure component in the hook region has been found to be the most important factor for driving BM motion (Peterson and Bogert, 1950; Kim, 2012), so it would follow that the lower BM velocity observed for the input could be due in part to a lower anti-symmetric pressure in the hook region. On the other hand, the other stimulus directions, which are not parallel to the longitudinal direction of the scalae chambers or the BM in the hook region, are able to make the anti-symmetric pressure component dominant in the scalae fluid chambers of the hook region. A final consideration is the SSCD location. As Fig. 2 shows, the normal directions to the top and bottom SSCD surfaces are roughly aligned with the x direction, whereas the normal direction of the center SSCD surface is roughly perpendicular to the x direction. Therefore, at high frequencies, the x-directional vibration can produce less volume velocity through the center SSCD. While the relatively easier volume-velocity communication between the SCs and the OW through the top or bottom SSCDs can produce a difference in fluid pressure between the SV and ST, the more difficult volume-velocity communication between the SCs and the OW through the center SSCD may make it more difficult for the difference in fluid pressure to be established. Therefore, for the center SSCD, it is expected that the fluid motion between the SCs and the OW would be less significant than for the other SSCD locations, since the x-directional vibration produces less volume velocity through the center SSCD. This is supported by the low magnitude of the RW volume velocity calculated for the case with x-directional vibration and a center SSCD shown Fig. 10(A). In short, since the x direction is aligned with the longitudinal direction of the SV in the hook region, and the center SSCD causes less fluid motion from the SCs to the OW, the anti-symmetric pressure component across the BM (in the SV and ST) of the hook region cannot be generated effectively for BC stimuli in the x direction. Therefore, the input causes the BM velocity to decrease at high frequencies in comparison to stimuli in the other directions.
4.2.2. The effects of normalizing by vstapes vs. UOW
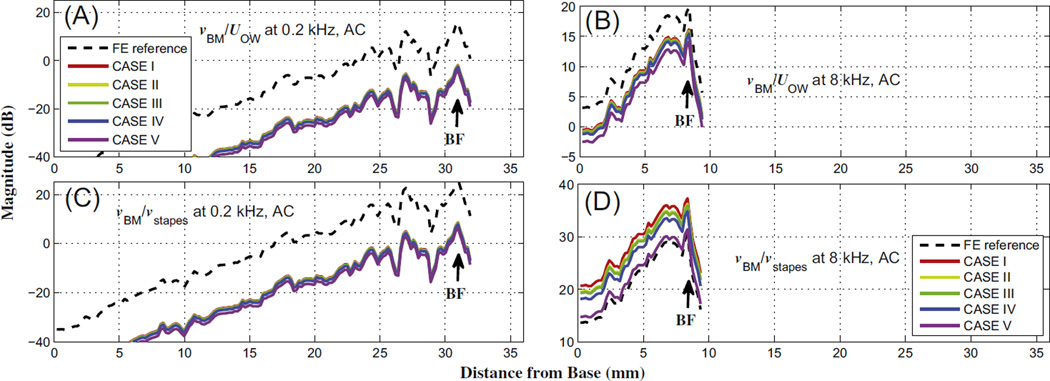
As shown in Figs.5 and 6, the BM velocity was normalized by the OW volume velocity, UOW, for AC excitation. In many experiments and simulated calculations, however, the BM velocity is typically normalized by the center point of the stapes-footplate velocity, vstapes (Gundersen et al., 1978; Stenfelt et al., 2003; Gan et al., 2007). In the current simulations, the normalized BM velocity at the low frequency (0.2 kHz), when normalized by vstapes, shows almost identical results to the case normalized by UOW, as shown in Figs. 12(A) and (C). However, Fig. 12(D) shows that, for the high frequency (8 kHz), normalizing by vstapes increases the normalized BM velocities relative to the pre-dehiscence case. This result is unexpected, in that the normalized vBM is increased in spite of the dehiscence, which it had been assumed would instead be shunting away the fluid-motion wave by acting as a third window. This apparent inconsistency can be resolved by changing the normalization factor from vstapes to UOW (see Fig. 12B). vstapes is calculated as a velocity in a direction normal to the stapes footplate, which can be a good assumption at low frequencies when the stapes footplate exhibits piston-like motion. However it cannot work at high frequencies when the stapes footplate exhibits rocking motions in addition to piston-like motion. If vstapes is still considered as a 1-D velocity at high frequencies, then the effects of these rocking motions of the stapes footplate are lost, such that the input energy into the cochlea ends up being underestimated at high frequencies. Therefore, for the current simulations, vBM is instead normalized by UOW, which is a more accurate input indicator at high frequencies.
Fig. 12.
Normalized BM velocities at 0.2 kHz (A and C) and 8 kHz (B and D), for AC excitation. The normalization factors are the oval-window volume velocity, UOW, for the top row (A and B), and the stapes-footplate velocity, vstapes, for the bottom row (C and D).
To calculate vstapes in the current study using the FE model, the 3-D velocity of one node on the stapes footplate was calculated, then the inner product was taken of that velocity and a directional vector normal to the stapes footplate, resulting in the 1-D velocity of the stapes footplate, vstapes. To calculate UOW, as the first step the directional vectors normal to every triangular element composing the stapes footplate were calculated. Then, an inner product was performed between the average of the velocities of the three nodes of each triangular element and the normal directional vector corresponding to the triangular element. Multiplying this inner product value by the area of the triangular element results in the volume velocity of the element. The calculated volume velocities of every element of the stapes footplate were then summed to obtain the OW volume velocity, UOW.
4.3. Air-bone gap
Due to the difficulty of measuring BC thresholds for frequencies above 4 kHz, most clinical measurements of the air-bone gap (ABG) are only performed for frequencies up to and including 4 kHz (Popelka et al., 2010). However, the ABG can be predicted to much higher frequencies from the model calculations. As shown in Fig. 7, the dehiscence size (indicated by different symbols) does not affect the ABG significantly, such that the lines representing the same direction of BC input (represented by the same shade) are almost aligned with one another. On the other hand, the different directions of BC input (represented by different shades) do have an effect on the calculated ABG. The x-directional BC input makes the magnitude of the ABG for center and bottom SSCDs continue to decrease as the frequency changes from 0.25 kHz to 10 kHz. However, the x-directional BC input cannot make the magnitude of the ABG for the top SSCD decrease in the 1–2 kHz frequency range. Specifically, above 4 kHz, the x-directional BC input produces a negative ABG, in dB, for the center SSCD. This is related to the decreased BM velocities due to the center SSCD at high frequencies (see Fig. 6B). The decreased BM velocity due to the center SSCD (i.e., the max is smaller than the max ) causes HLBC to become greater than zero , while HLAC remains nearly zero above 4 kHz. Therefore, the ABG has a negative value in dB (ABG = HLAC – HLBC).
In the case of y- and z-directional BC inputs, the ABG is reasonably consistent with clinical measurement values (Mikulec et al., 2004), to within a 10 dB difference, in that the ABG decreases below 2 kHz and increases a little up to 4 kHz. Based on the FE-model calculations, a dehiscence causes the ABG to converge to 0 dB from 4 kHz to 8 kHz. In other words, no significant effect on hearing sensitivity is expected from the dehiscence at high frequencies, for either AC or BC stimulus. Furthermore, the ABG shows a maximum difference, due to the SSCD location, of 15 dB at the lowest frequency and 5–20 dB at the highest frequency.
5. Conclusion
A finite-element (FE) model of the human middle ear and inner ear was constructed in order to predict the effects of a superior-semicircular-canal (SSC) dehiscence (SSCD) on hearing sensitivity. The change in hearing sensitivity due to a dehiscence was obtained through the FE model by comparing the maximum basilar-membrane (BM) velocity for the baseline normal conditions to those with a simulated dehiscence. The simulation results support the hypothesis that a dehiscence acts as a mobile third window, additional to the oval and round windows, that provides a pathway through which a fluid-motion wave can be shunted away from the cochlea and into the SSC. The model results are consistent with clinical audiograms for patients with an SSCD-associated hearing loss (Mikulec et al., 2004), in that they show an improvement in bone-conducted (BC) thresholds of 5–15 dB and a worsening in air-conducted (AC) thresholds of 20–40 dB for frequencies below 1 kHz. Furthermore, the model predicts the importance of the width of the side of the dehiscence closest to the oval window. In addition, changing the direction of the BC input can have an effect on the BM velocity. Specifically, vibrations aligned longitudinally with the scalae fluid chambers in the hook region (i.e., in the x direction) decrease the BM velocity at high frequencies for a ‘center’ dehiscence located midway along the SSC, whereas vibrations in other directions (y and z) do not exhibit this high-frequency decrease in BM velocity, regardless of the dehiscence location. Finally, the model predicts that the air-bone-gap (ABG) of SSCD patients will converge to 0 dB as the stimulus frequency increases to 10 kHz, provided that the vibrational stimulus is not in the x direction. Thus, the differential diagnosis of the center vs. top (or bottom) SSCD may be possible in the future when the ABG is measured with several directional BC stimulations above 8 kHz.
Acknowledgments
The authors would like to thank Kevin N. O’Connor for several critical readings of this paper, leading to numerous improvements. Work supported in part by grants R01-DC07910 and R01-DC05960 from the National Institute of Deafness and other Communication Disorders (NIDCD) of the NIH.
Abbreviations
- AC
air conduction
- BC
bone conduction
- BM
basilar membrane
- FE
finite element
- SC
semicircular canal
- SCD
semicircular-canal dehiscence
- SSC
superior-semicircular canal
- SSCD
superior-semicircular-canal dehiscence
Appendix
Basic equations
The 1-D equation for a compressible fluid is:
| (A1) |
where u is the displacement of the fluid, ω is the frequency (rad/sec), and c is the speed of sound in the fluid. A partial derivative with respect to x is represented by a subscripted comma (i.e. ). Two subscripted x’s represent a second partial derivative.
The pressure is defined as:
| (A2) |
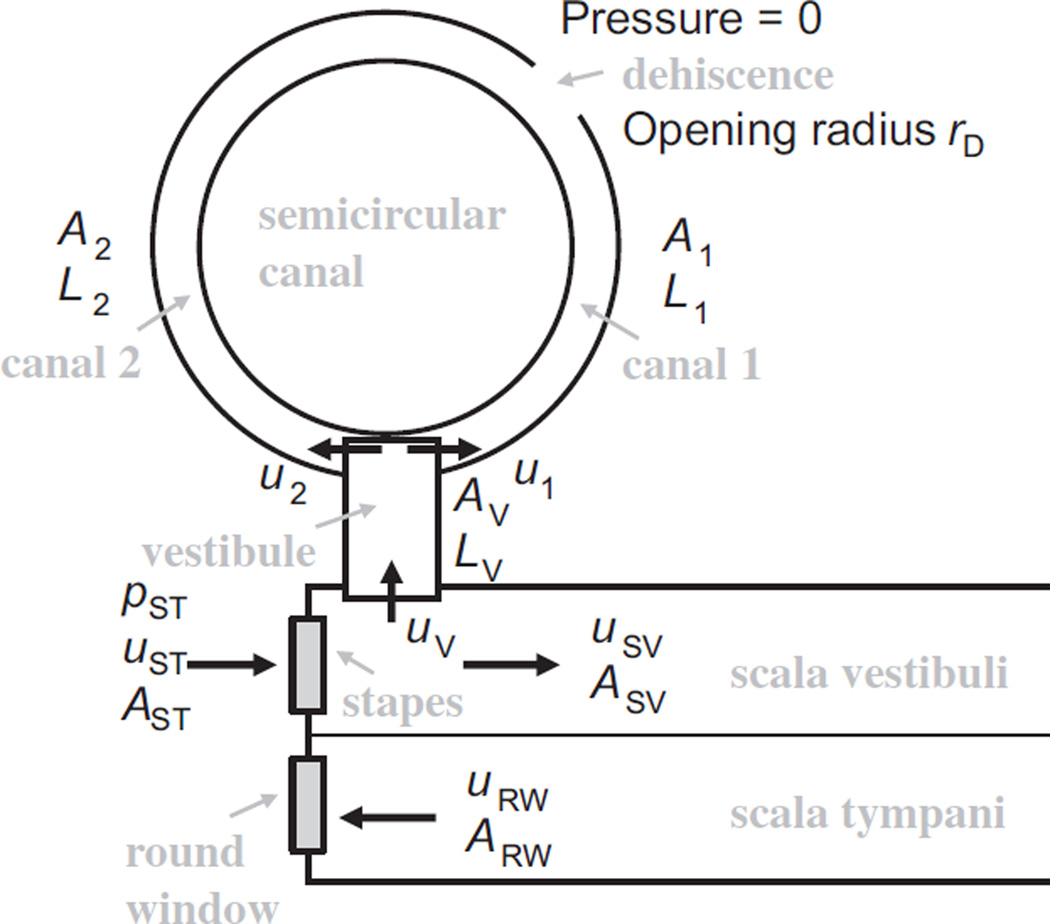
where the elastic modulus, E, is ρc2 and ρ is the density of the scalae fluid. The input impedances of the two portions of the semicircular canal (i.e., canal 1 and canal 2 in Fig. A1), with respective lengths L1 and L2 from the end of the vestibule to the point of zero pressure, are:
| (A3) |
Fig. A1.
A semicircular canal with a dehiscence approximated by a zero-pressure region. L, u, and p represent length, fluid displacement, and fluid pressure, respectively. rD is the radius of the dehiscence opening. A1 and A2 are the cross-sectional areas of canal 1 and canal 2, respectively. AVAST and ARW indicate the respective cross-sectional areas of the vestibule, stapes footplate, and round window.
Here, the dot notation (e.g., u̇) indicates a partial derivative with respect to time. The two canals act like two springs in series, so the combined impedance of the two canals is:
| (A4) |
Typically the length L1 is smaller than L2, so the smaller impedance dominates, and:
| (A5) |
The “vestibule” shown in Fig. A1 is treated as a 1-D region of length LV and area AV, with an input impedance represented as:
| (A6) |
The fluid-volume displacement of the stapes is equal to the sum of the displacement of the vestibule and that of the scala vestibuli:
| (A7) |
Again, this is a case of two springs acting in series, so the impedance of the stapes is:
| (A8) |
When the impedance of the semicircular canal is less than that of the scala vestibuli, then the impedance of the semicircular canal will dominate and the fluid-motion wave will flow into the semicircular canal rather than into the cochlea. The fraction of fluid flowing into the cochlea with respect to the stapes input is then:
| (A9) |
Restricting the opening of the dehiscence
Fig. A1 would be applicable to an extracted temporal bone with a dehiscence exposed to the air, but for the in-vivo situation, with a dehiscence open to the brain, the dehiscence can be approximated as a semi-infinite fluid space. The impedance of the opening can be approximated as:
| (A10) |
where rD is the radius of the dehiscence opening, and the dehiscence area, AD, is . The impedance of the canal (i.e., of the semicircular canal, consisting of canal 1 + canal 2 in Fig. A1) is then:
| (A11) |
This is then used in the expression for the vestibular impedance ZV (Eq. (A6)).
For low to moderate frequencies and for typical dimensions, the impedances are dominated by the mass of the fluid, such that the vestibular impedance can be approximated as:
| (A12) |
Example Typical values for some components of the human auditory periphery are summarized in Table A1.
Table A1.
Summary of typical values of critical components of the human auditory periphery.
| Parameter | Values | Definition |
|---|---|---|
| C | 1500 m/s | Speed of sound in the scalae fluid |
| ρ | 1000 kg/m3 | Density of the scalae fluid |
| L1 | 2.5 mm | Length of canal 1 (i.e., the shorter distance from the end of the vestibule to the dehiscence) |
| LV | 2.5 mm | Length of the vestibule |
| A1 | 0.2 mm2 | Cross-sectional area of canal 1 |
| AV | 1.1 mm2 | Cross-sectional area of the vestibule |
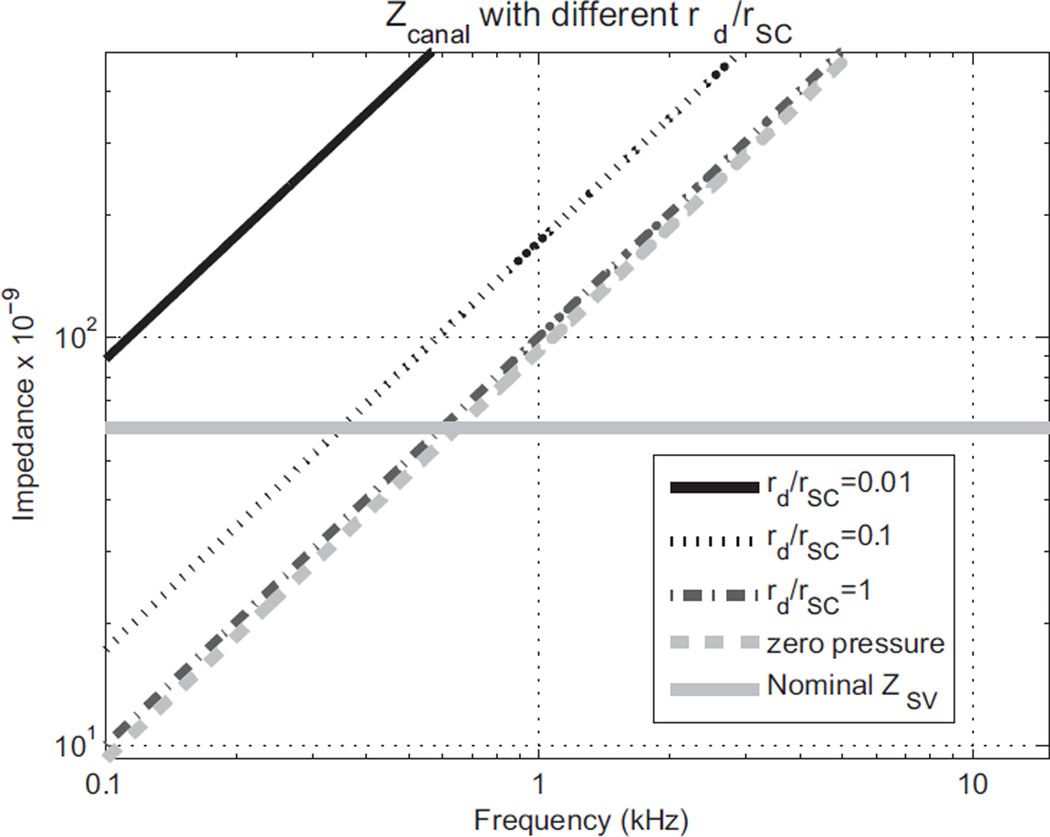
These values yield the impedances shown in Fig. A2. The mass effect of the semicircular canal in Fig. A1 causes the impedance to increase linearly with frequency. This confirms the idea that a dehiscence can act as a third window for the cochlea that shunts the fluid-motion wave flowing from the stapes away from the cochlea and into the semicircular canal. A small opening with a radius of just 10% of the canal radius causes a significant effect.
Fig. A2.
Impedances of a semicircular canal (SC) with dehiscence openings of different sizes relative to the SC radius (rSC). With an opening radius of the dehiscence (rd) equal to the radius of the canal (rd/rSC = 1), the impedance is about the same as for the zero-pressure case. The thick gray solid line shows the nominal impedance of the human scala vestibuli. For frequencies over which the SC impedance is less than the SV impedance, the cochlear response will be decreased. The impedance of the nominal SV was roughly calculated based on a 20 GΩ cochlear impedance (Aibara et al., 2001).
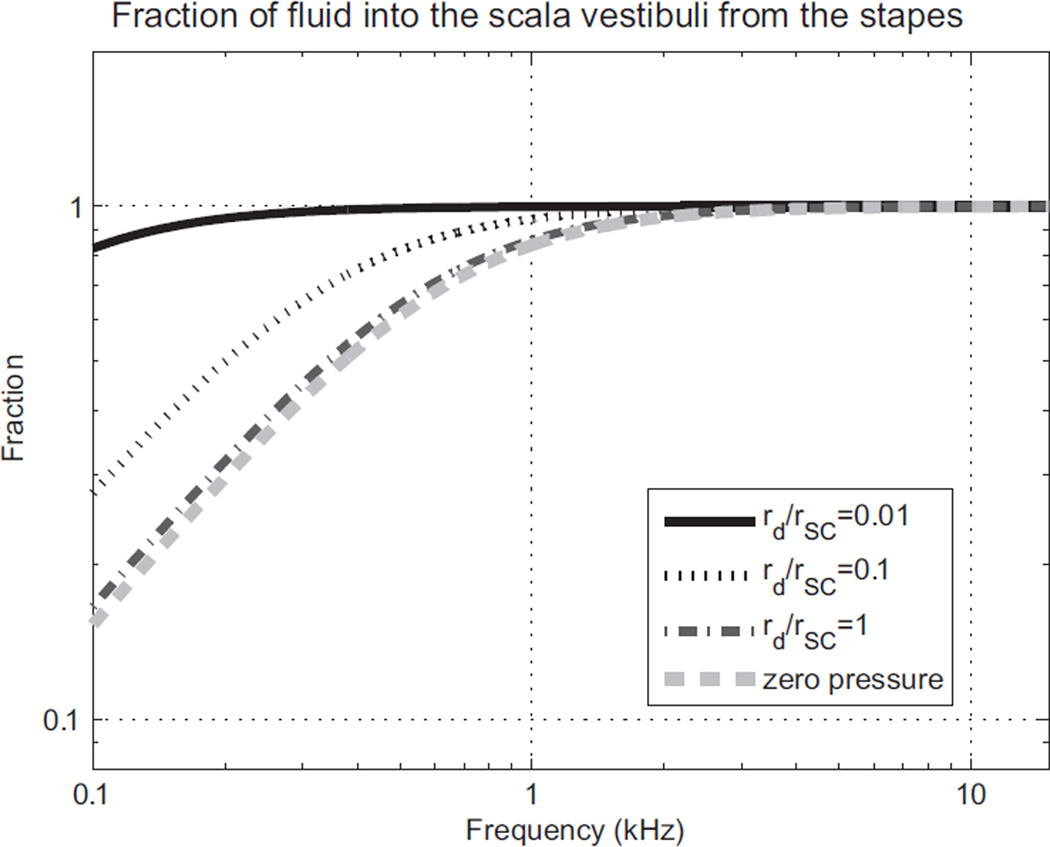
The corresponding fraction of fluid-volume displacement going into the scala vestibuli from the stapes is shown in Fig. A3. Of course, the impedance of the cochlea is not constant, but actually depends somewhat on frequency. Furthermore, the geometry of the semicircular canals probably varies with each individual. However, Fig. A2 and A3 show the general behavior that appears to be consistent with clinical observations of the hearing loss at low frequencies due to a dehiscence.
Fig. A3.
Fraction of the fluid-volume displacement going into the scala vestibuli from the stapes, f, for different radius ratios between the dehiscence and the semicircular canal (rd/rSC).
References
- Aibara R, Welsh JT, Puria S, Goode RL. Human middle ear sound transfer function and cochlear input impedance. Hear. Res. 2001;152:100–109. doi: 10.1016/s0378-5955(00)00240-9. [DOI] [PubMed] [Google Scholar]
- Attias J, Nageris BI, Shemesh R, Shvero J, Preis M. Superior canal dehiscence effect on hearing thresholds: animal model. OtoLaryn Head Neck Surg. 2011;145:648–653. doi: 10.1177/0194599811410535. [DOI] [PubMed] [Google Scholar]
- Chien WW, Carey JP, Minor LB. Canal dehiscence. Curr. Opin. Neurol. 2011;24:25–31. doi: 10.1097/WCO.0b013e328341ef88. [DOI] [PubMed] [Google Scholar]
- Chien WW, Janky K, Minor LB, Carey JP. Superior canal dehiscence size: multivariate assessment of clinical impact. Otol. Neurotol. 2012;33:810–815. doi: 10.1097/MAO.0b013e318248eac4. [DOI] [PMC free article] [PubMed] [Google Scholar]
- Cremer PD, Minor LB, Carey JP, Santina CC. Eye movements in patients with superior canal dehiscence syndrome align with the abnormal canal. Neurology. 2000;55:1833–1841. doi: 10.1212/wnl.55.12.1833. [DOI] [PubMed] [Google Scholar]
- Gan RZ, Reeves BP, Wang X. Modeling of sound transmission from ear canal to cochlea. Ann. Biomed. Eng. 2007;32:847–859. doi: 10.1007/s10439-007-9366-y. [DOI] [PubMed] [Google Scholar]
- Gundersen T, Skarstein Φ, Sikkeland T. A study of the vibration of the basilar membrane in human temporal bone preparations by the use of the Mössbauer effect. Acta Otolaryngol. 1978;86:225–232. doi: 10.3109/00016487809124740. [DOI] [PubMed] [Google Scholar]
- Kim N. Ph.D. thesis. Stanford University; 2012. Anti-symmetric Inputs at the Cochlear Windows Drive Bone- and Air-conduction Hearing: Finite Element Analysis. [Google Scholar]
- Kim N, Homma K, Puria S. Inertial bone conduction: symmetric and anti-symmetric components. J. ARO. 2011;12:261–279. doi: 10.1007/s10162-011-0258-3. [DOI] [PMC free article] [PubMed] [Google Scholar]
- Liu YW, Neely ST. Distortion product emissions from a cochlear model with nonlinear mechnoelectrical transduction in outer hair cells. J. Acoust. Soc. Am. 2010;127:2420–2432. doi: 10.1121/1.3337233. [DOI] [PMC free article] [PubMed] [Google Scholar]
- Mikulec AA, McKenna MJ, Ramsey MJ, Rosowski JJ, Herrmann BS, Rauch SD, Curtin HD, Merchant SN. Superior semicircular canal dehiscence presenting as conductive hearing loss without vertigo. Otol. Neurotol. 2004;25:121–129. doi: 10.1097/00129492-200403000-00007. [DOI] [PubMed] [Google Scholar]
- Minor LB, Solomon D, Zinreich J, Zee D. Sound- and/or pressure-induced vertigo due to bone dehiscence of the superior semicircular canal. Arch. Otolaryngol. Head Neck Surg. 1998;124:249–258. doi: 10.1001/archotol.124.3.249. [DOI] [PubMed] [Google Scholar]
- Minor LB. Superior canal dehiscence syndrome. Am. J. Otol. 2000;21:9–19. [PubMed] [Google Scholar]
- Nakajima HH, Pisano DV, Merchant SN, Rosowski JJ. The effect of superior semicircular canal dehiscence on intracochlear sound pressures. In: Shera CA, Olson ES, editors. What Fire is in Mine Ears: Progress in Auditory Biomechanics; Proceedings of the 11th International Mechanics of Hearing Workshop, Williamstown, AIP Conf. Proc; 2011. pp. 110–115. [Google Scholar]
- Niesten M, Hamber L, Silverman J, Lou K, McCall A, Windsor A, Curtin H, Herrmann B, Grolman W, Nakajima HH, Lee D. Association of Size and Location of Superior Canal Dehiscence with Clinical Presentation, Audiometric and Vestibular Testing. Association for Research in Oto-Laryngology, Mid-Winter Meeting; San Diego, CA. 2012. [Google Scholar]
- Peterson LC, Bogert BP. A dynamical theory of the cochlea. J. Acoust. Soc. Am. 1950;22:369–381. [Google Scholar]
- Popelka GR, Telukuntla G, Puria S. Middle-ear function at high frequencies quantified with advanced bone-conduction measures. Hear. Res. 2010;263:85–92. doi: 10.1016/j.heares.2009.11.002. [DOI] [PMC free article] [PubMed] [Google Scholar]
- Rajan GP, Leaper MR, Goggin L, Atlas MD, Boeddinghaus R, Eikelboom RK. The effects of superior semicircular canal dehiscence on the labyrinth: does size matter? Otol Neurotol. 2008;29:972–975. doi: 10.1097/MAO.0b013e31817f7382. [DOI] [PubMed] [Google Scholar]
- Ren T. The cochlea amplifier and Ca2+ current-driven active stereocilia motion. Nat. Neurosci. 2005;8:132–134. doi: 10.1038/nn0205-132. [DOI] [PubMed] [Google Scholar]
- Rosowski JJ, Songer JE, Nakajima HH, Brinsko KM, Merchant SN. Clinical, experimental, and theoretical investigations of the effect of superior semicircular canal dehiscence on hearing mechanisms. Otol. Neurotol. 2004;25:323–332. doi: 10.1097/00129492-200405000-00021. [DOI] [PubMed] [Google Scholar]
- Shera CA. Laser amplification with a twist: traveling-wave propagation and gain functions from throughout the cochlea. J. Acoust. Soc. Am. 2007;122:2738–2758. doi: 10.1121/1.2783205. [DOI] [PubMed] [Google Scholar]
- Sohmer H, Freeman S, Perez R. Semicircular canal fenestration-improvement of bone- but not air-conducted auditory thresholds. Hear. Res. 2004;187:105–110. doi: 10.1016/s0378-5955(03)00335-6. [DOI] [PubMed] [Google Scholar]
- Songer JE, Rosowski JJ. The effect of superior canal dehiscence on cochlear potential in response to air-conducted stimuli in chinchilla. Hear. Res. 2005;210:53–62. doi: 10.1016/j.heares.2005.07.003. [DOI] [PMC free article] [PubMed] [Google Scholar]
- Songer KE, Rosowski JJ. The effect of superior-canal opening on middle-ear input admittance and air-conducted stapes velocity in chinchilla. J. Acoust. Soc. Am. 2006;120:258–269. doi: 10.1121/1.2204356. [DOI] [PMC free article] [PubMed] [Google Scholar]
- Songer JE, Rosowski JJ. A mechano-acoustic model of the effect of superior canal dehiscence on hearing in chinchilla. J. Acoust. Soc. Am. 2007;122:943–951. doi: 10.1121/1.2747158. [DOI] [PMC free article] [PubMed] [Google Scholar]
- Songer JE, Rosowski JJ. A superior semicircular canal dehiscence-induced air-bone gap in chinchilla. Hear. Res. 2010;269:70–80. doi: 10.1016/j.heares.2010.07.002. [DOI] [PMC free article] [PubMed] [Google Scholar]
- Stenfelt S, Puria S, Hato N, Goode RL. Basilar membrane and osseous spiral lamina motion in human cadavers with air and bone conduction stimuli. Hear. Res. 2003;181:131–143. doi: 10.1016/s0378-5955(03)00183-7. [DOI] [PubMed] [Google Scholar]
- Yoon YJ, Puria S, Steele CR. Feed-forward and feed-backward amplification model from cochlear cytoarchitecture: an interspecies comparison. Biophys. J. 2011;100:1–10. doi: 10.1016/j.bpj.2010.11.039. [DOI] [PMC free article] [PubMed] [Google Scholar]


