

Abstract
Objective:
Immunosenescence and cognitive decline are common markers of the aging process. Taking into consideration the heterogeneity observed in aging processes and the recently described link between lymphocytes and cognition, we herein explored the possibility of an association between alterations in lymphocytic populations and cognitive performance.
Methods:
In a cohort of cognitively healthy adults (n = 114), previously characterized by diverse neurocognitive/psychological performance patterns, detailed peripheral blood immunophenotyping of both the innate and adaptive immune systems was performed by flow cytometry.
Results:
Better cognitive performance was associated with lower numbers of effector memory CD4+ T cells and higher numbers of naive CD8+ T cells and B cells. Furthermore, effector memory CD4+ T cells were found to be predictors of general and executive function and memory, even when factors known to influence cognitive performance in older individuals (e.g., age, sex, education, and mood) were taken into account.
Conclusions:
This is the first study in humans associating specific phenotypes of the immune system with distinct cognitive performance in healthy aging.
The identification of factors contributing to healthy aging is increasingly relevant in modern societies in order to define strategies to sustain and improve quality of life for older individuals. Immunosenescence and cognitive decline are common changes accompanying aging, but their potential interaction is far from being understood. In fact, the interaction between cognition and parameters of the immune system has been explored mostly in the last decade, and largely through studies using animal models.1–6 The current view is that the immune system plays a modulatory role in brain function, including in cognitive abilities and neurogenesis,7,8 which supports the notion that throughout life the brain is not “immune privileged” but rather “enjoys the privilege” of immune-dependent maintenance. So far, it is established that (1) severe combined immune deficient mice, which lack B and T cells, and nude mice, which are devoid of T cells, present a significant impairment in hippocampal-dependent spatial learning and memory,3,9,10 and, importantly, these cognitive deficits are reversed by reconstituting the mouse immune system with T cells3,9,10 but not with other immune cells10; (2) CD4+ T cell–depleted mice present impaired performance in reversal learning in the Morris water maze4; and (3) acute suppression of T cells by immunosuppressive drugs currently used in clinical trials or in disease treatment is sufficient to cause cognitive deficits in adult wild-type mice.1,3,10 In addition, very recent studies revealed that bloodborne factors from old mice are able to impair spatial learning and memory as well as neurogenesis and synaptic plasticity in young animals.11 In contrast, blood from young animals is able to reverse age-related impairments in cognitive function and synaptic plasticity.12 While the precise bloodborne factors influencing cognition remain to be elucidated, they may relate to immune cells and/or immune mediators.
Taking into consideration the data available from animal studies and recognizing that both age-associated cognitive decline and modifications on the immune cells vary greatly between individuals,13,14 we hypothesized that there is an association between age-associated alterations in leukocytes and cognitive performance in healthy aging individuals. To test this hypothesis, we explored the association of the immune system cells profile and the cognitive phenotype in a well-characterized cohort of senior individuals with distinct cognitive performances.
METHODS
Participant characterization.
The 114 participants enrolled were selected from a cohort of 1,051 individuals, as representative of good and poor cognitive performers based on neurocognitive/psychological performance patterns.15,16 The participants from the initial cohort are senior community-dwelling individuals living in the Minho region of Portugal and are representative of the country's population in terms of age distribution, sex, and school years. Participants who were unable to attend the clinical and neuropsychological sessions, were diagnosed with dementia and/or unable to understand informed consent, or who had disorders of the central nervous system or overt thyroid pathology, were excluded from the larger cohort. The cohort was established in accordance with the principles expressed in the Declaration of Helsinki, and the work was approved by the Portuguese national ethical committee (Comissão Nacional de Protecção de Dados) and by local ethics review boards. All the participants gave voluntary informed written consent.
A team of trained psychologists assessed the cognitive and mood profile of the participants as described in Santos et al.16 Briefly, the cognitive profile was established using a battery of neurocognitive and psychological tests selected to evaluate short-term verbal memory, verbal working memory, response inhibition/cognitive flexibility, verbal fluency, multiple trial verbal learning and memory, high-level information processing speed, global cognitive status, and mood. Using a principal component analysis, the neurocognitive/psychological test variables were grouped into 3 dimensions: memory (MEM), general and executive function (GENEXEC), and mood (GDS) (for details see Santos et al.16). The cognitive groups were classified as good and poor performers following cluster analysis. All the statistical analysis of the cognitive evaluation and individual clustering followed the method in our previous publication.16 Descriptive information regarding age, sex, school years, and scores for GDS, MEM, and GENEXEC for all participants and for the good and poor cognitive performance groups is described in table e-1 at Neurology.org/nn.
While the full characterization of the acquired immune system was performed for all 114 individuals, the innate immune system was analyzed for only 79 individuals (table e-2). The presence of anti-cytomegalovirus (CMV) immunoglobulin G was determined, and only 7 of the 114 participants were considered nonimmune to CMV; no correlations were observed between CMV antibody titers and the cognitive performance of the participants. All participants presented C-reactive protein levels below the limit associated with active inflammation/infection (10 mg/L).17 Information about anti-inflammatory/immunomodulatory medication was collected at the time of clinical interview; 18 of the participants were receiving this type of therapy (information provided in table e-1).
Flow cytometry analysis.
Blood was collected to EDTA blood collection tubes and processed for standard hospital leukogram (Braga's Hospital) and multiparametric flow cytometry analyses on the same day of collection (see e-methods for details). Leukogram analysis was conducted at the certified pathology laboratory of Braga's Hospital, following standard procedures. A code was assigned to each participant and all the analyses were assessed blindly.
Statistical analysis.
Data for MEM, GENEXEC, and GDS were used in the analysis as z scores, as previously determined by Santos et al.16 To evaluate normal distribution of the variables, skewness and kurtosis values were calculated and the approximate normal distribution was defined for variables with absolute values of skewness below 3 and of kurtosis below 8.18 Levene test was used to evaluate equality of variances.
To compare immune systems' cell populations (cell counts per mL of blood) between good and poor cognitive performance groups (descriptive statistics of variables are presented in table e-2), an independent-sample t test was performed for variables with normal distribution and a Mann-Whitney U test for variables with non-normal distribution. p Values below 0.05 were considered significant, and to quantify the strength of the differences, Cohen d was calculated as a measure of effect size (0.2 is considered a small effect size, 0.5 a medium effect size, and 0.8 a large effect size).19
To correlate immune systems' cell populations (cell counts) with cognitive (MEM and GENEXEC) dimensions, a Pearson correlation coefficient test was performed for variables with normal distribution and a Spearman rank correlation coefficient test for variables with non-normal distribution. The coefficient of determination (R2) was calculated as a measure of effect size (0.0196 is considered a small effect size, 0.1300 a medium effect size, and 0.2600 a large effect size).19
Hierarchical regression analysis was performed to compare different models to predict MEM or GENEXEC dimensions (dependent variables) and to test whether successive models fit better than the previous ones. Variables with non-normal distribution and with tolerance values below 0.4 (to avoid multicollinearity between variables) were excluded from the model. The statistical procedures were performed in IBM SPSS Version 20 (IBM Corp, Armonk, NY).
RESULTS
B cells, naive CD8+ T cells, and effector memory CD4+ T-cell counts correlate with cognitive performance.
When characterizing the overall immune system, no differences between good and poor cognitive performers were observed in the leukogram cell subpopulations (lymphocytes, monocytes, neutrophils, basophils, and eosinophils; figure e-1). A more detailed flow cytometry analysis of the acquired immune system cells revealed that, when compared to poor performers, good cognitive performers presented significantly higher B-cell counts (figure 1A; t(110) = 2.354, p = 0.020, d = 0.45). No differences were seen between good and poor cognitive performers regarding total T-cell counts (figure 1B; t(110) = 0.355, p = 0.723) or the 2 main T-cell populations (figure 1C; CD4+ [t(110) = 0.617, p = 0.539] and CD8+ [t(110) = −0.196, p = 0.845]). The CD4+ and CD8+ T-cell compartments (naive, central memory [CM], effector memory [EM], and late differentiated [LD]), whose proportion has been shown to change with aging,20 displayed a distribution pattern (figure 1, D and E) in accordance with the described dynamics of these T-cell compartments in aging.20 It is interesting that the poor cognitive performers presented higher numbers of EM CD4+ T cells (figure 1D; t(110) = − 2.510, p = 0.014, d = 0.48), with no differences in other CD4+ T-cell compartments (figure 1D; naive t(109.9) = 1.770, p = 0.080; CM t(110) = 0.780, p = 0.480; LD U(110) = 1,545, z = −0.108, p = 0.919), and lower numbers of naive CD8+ T cells (figure 1E; t(93.75) = 2.600, p = 0.011, d = 0.54), with no differences among the CD8+ T-cell compartments (figure 1E; CM U(110) = 1,375, z = −1.096, p = 0.273; EM t(110) = −0.774, p = 0.440; LD t(110) = −0.332, p = 0.746).
Figure 1. Distinct cognitive performers present differences in the cell populations of the adaptive immune system.

The profile (cell counts per mL of blood) of good (black) and poor (red) cognitive performers with regard to B cells (A); T cells (B); CD4+ and CD8+ T-cell subpopulations (C); CD4+ and CD8+T-cell compartments (D and E), subdivided as naive, central memory (CM), effector memory (EM), and late differentiated (LD) T cells; CD4+ regulatory T cells (Tregs) (F), subdivided as naive Tregs, activated Tregs, and nonsuppressive Tregs (G). Each dot represents one individual and the line represents the mean of the group. *p < 0.05.
No differences were noted in total regulatory T cell (Treg) counts (figure 1F; t(106) = 0.046, p = 0.963) or in the Treg compartments (figure 1G; naive Tregs t(106) = 1.667, p = 0.098; activated Tregs t(106) = 0.480, p = 0.632; nonsuppressive Tregs U(106) = 1,387, z = −0.361, p = 0.718), possibly indicating that this cell population is not associated with cognitive performance.
There were no differences in the dendritic and natural killer cell counts (figure e-2).
EM CD4+ T-cell numbers predict memory and executive performance.
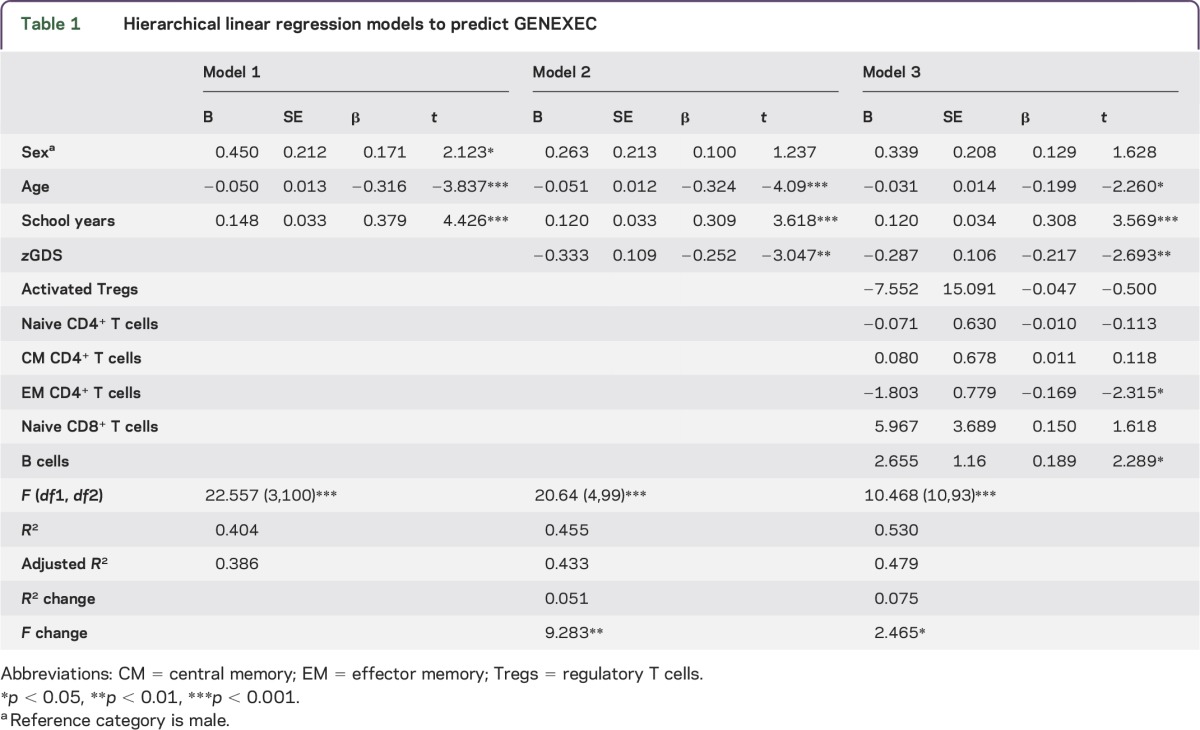
Cognitive performance is known to relate directly or indirectly to sex, age, mood and, particularly, education.13,15,21–24 In addition, variations in the immune system are associated with age and mood.20,25,26 Therefore, we next investigated whether these factors influenced the differences observed in the immune system between distinct cognitive performers. To do so, hierarchical linear regression models were used to predict the GENEXEC and MEM dimension performances. The adaptive immune system variables appeared to be the most promising, so those that presented statistically significant correlations with GENEXEC and MEM (table e-3) were included in the regression model to determine to what extent they were able to predict the cognitive performance in both domains. The first block of variables included age, sex, and school years, which are known to strongly relate to cognitive performance.13,15,16,21,24 The second block addressed mood, which also affects cognitive function.15,16,22,23,27 The third (last) block included the immune system variables (activated Tregs, naive CD4+ T cells, CM CD4+ T cells, EM CD4+ T cells, naive CD8+ T cells and B cells in the GENEXEC model; naive CD4+ T cells, EM CD4+ T cells, naive CD8+ T cells and B cells in the MEM model). The hierarchical linear regression analysis revealed that the first block predicted 38.6% (adjusted R2) of the GENEXEC dimension variance and that all variables were statistically significant predictors (table 1; model 1). Adding the second block to the model increased the prediction of GENEXEC significantly 5.1% (R2 change), with the sex variable ceasing to be a significant predictor (table 1; model 2). Finally, the inclusion of the third block further increased the predictive power by 7.5% (table 1; model 3). Overall, model 3, which comprises all the variables, predicted 47.9% (adjusted R2) of the GENEXEC variance. Moreover, in addition to age, mood, and school years, EM CD4+ T cells and B cells were statistically significant predictors of GENEXEC. This means that even when considering the variables previously known to affect cognitive function as predictors, the variables of the immune system proved to be good predictors (although as expected with lower impact [lower β]). Altogether these observations indicate that better cognitive performers in the GENEXEC dimension are not just younger individuals with higher education levels and better mood, as shown previously, but also those with lower EM CD4+ T-cell counts and higher B-cell counts in the blood.
Table 1.
Hierarchical linear regression models to predict GENEXEC
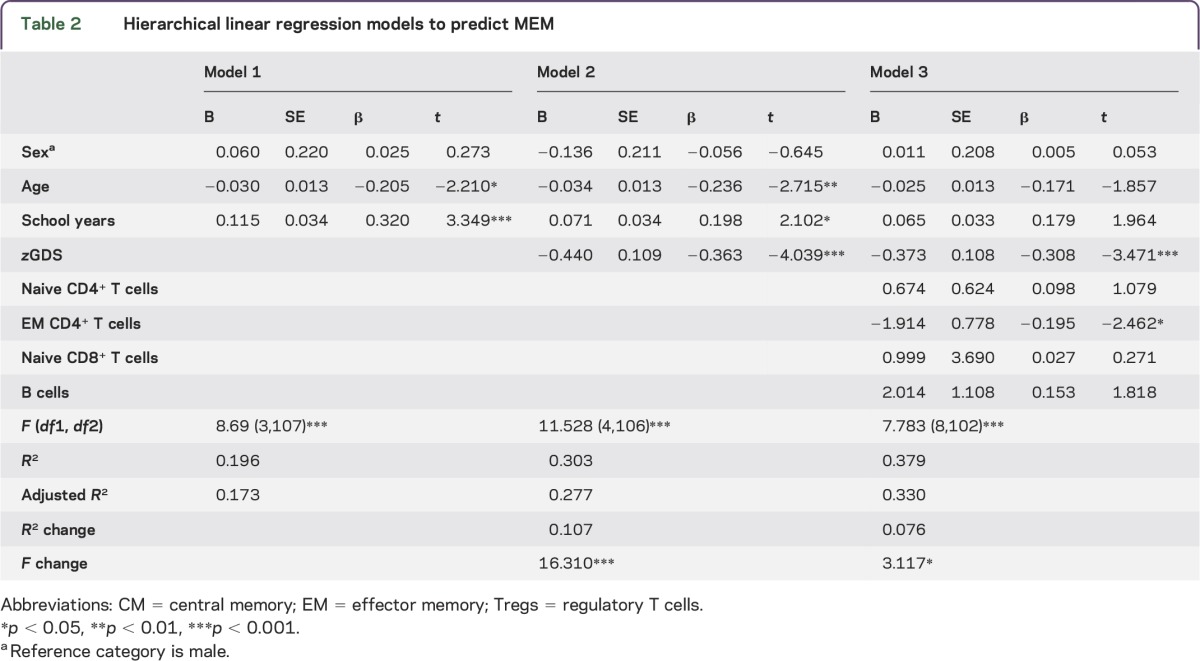
With respect to the MEM dimension, the hierarchical regression showed that the first block predicted almost 20% (adjusted R2) of the MEM dimension variance, with age and school years being statistically significant predictors (table 2; model 1). The addition of the second block significantly increased the predictive power 10.7% (R2 change), with mood being the variable with the highest impact on MEM prediction (table 2; model 2). The addition of the last block raised statistical significance by 7.6% (table 2; model 3) for MEM. Following the GENEXEC findings, in model 3 all variables comprehensively explained 33% of the MEM dimension, in which, in addition to mood, EM CD4+ T cells were again statistically significant predictors. The approach indicated that better cognitive performers in memory function have better mood scores and lower EM CD4+ T-cell counts.
Table 2.
Hierarchical linear regression models to predict MEM
It is also important to highlight that in this cohort only 18 participants were receiving anti-inflammatory/immunoodulatory treatment, and no differences were detected in the cellular populations analyzed when comparing individuals receiving treatment to those not receiving treatment (data not shown). We also included this factor in the hierarchical regression models as a factor to control, and anti-inflammatory/immunomodulatory treatment showed no impact on cognitive function or on the correlation between EM CD4+ T cells and cognitive performance (data not shown).
DISCUSSION
This study shows that better cognitive performance in a healthy senior population is associated with lower numbers of EM CD4+ T cells, higher numbers of naive CD8+ T cells and higher numbers of B cells. Furthermore, EM CD4+ T cells are predictors of GENEXEC and MEM, even when factors known to influence cognitive performance (e.g., age, sex, education and mood) are taken into account.
The immune cell population strongly associated with cognitive performance in our healthy senior cohort is the EM CD4+ T cells population. Higher EM CD4+ T-cell numbers negatively predict MEM and GENEXEC performance. Of interest, other authors reported that patients diagnosed with probable Alzheimer disease and cognitive deficits according to the Mini-Mental State Examination presented with significantly lower levels of CD4+ naive T cells (CD45RA+) and an increase in the activated/naive CD4+ T-cell ratio (CD45RO+/CD45RA+) compared with age-matched cognitively healthy individuals.28 This suggests that pathologically related cognitive deficits are associated with alterations in the CD4+ T-cell compartments.28 Of note, we also observed more EM CD4+ T cells in the poor cognitive performers, even though the individuals enrolled in our study presented no detectable pathologic cognitive alteration. The link between CD4+ T cells and cognitive performance has been proposed based on preclinical studies. In fact, systemic depletion of CD4+ T cells in mice significantly reduced hippocampal neurogenesis and impaired reversal learning; such effects were not observed for CD8+ T cells neither for B cells.4,29 Recent studies showed that a substantial increase in CD4+ T cells, but not in CD8+ T cells, was observed in the meninges of mice that performed a cognitive task.1 Moreover, the recruited cells were activated CD4+ T cells (CD69+; CD25+Foxp3-) producing IL-4 (Th2 phenotype) and not IFN-γ (Th1 phenotype),1 suggesting that the cytokines produced by CD4+ T cells may play a role in cognition. In fact, a more proinflammatory profile has been associated with cognitive impairments in older individuals.30,31 Because EM CD4+ T cells are the major cytokine producers among T cells,32 the association found in our population between higher EM CD4+ T cells and poor cognition may be related to a more proinflammatory profile. Further studies are needed to better understand the interplay between the CD4+ T-cell populations, their specific cytokine production profile, and cognitive performance. This study also identified an association between B-cell counts and cognition (individuals with better cognitive performance presented with higher B-cell counts).
We next used hierarchical regression models to investigate the impact of the immune system in both the MEM and GENEXEC cognitive domains. The analysis revealed that all the immune system variables included in the models increased the predictive power of both cognitive domains almost 8%. Because this effect is in addition to the effect of other factors known to explain cognitive performance in senior populations, the effect of the immune system variables should be included when addressing cognitive differences among older individuals. Regarding the models used in this study, all variables explained GENEXEC better than MEM. We previously demonstrated that the predicted cognitive score (a “latent” cognitive score calculated using structural equation modeling based on 3 identified cognitive dimensions [general and executive function, memory, and a higher-level executive processing capacity] and 4 predictors [sex, age, school years, and GDS]) is more strongly explained by GENEXEC than by MEM, which is in agreement with the present observations. Furthermore, in the structural equation model, the included variables explained 62% of the variability of the latent cognitive score,16 indicating that other unknown factors are also of relevance. Based on the current findings, the inclusion of immune system parameters as predictors (mainly EM CD4+ T cells and/or B cells) can probably increase the explanation of the variability of cognition observed among senior individuals.
In summary, to the best of our knowledge, this is the first study identifying a phenotype of the immune system associated with poorer/better cognitive performance in individuals with healthy cognitive aging. This study is potentially limited by the relatively small number of participants; thus, the present findings must be confirmed in other human cohorts fully characterized for their neurocognitive/psychological performance patterns in order to establish these “immunomarkers” as predictors of cognitive performance in aging. In addition, prospective studies must follow on how the immune system profile further relates to cognitive decline.
Supplementary Material
ACKNOWLEDGMENT
The authors acknowledge the Portuguese Foundation for Science and Technology (FCT) for providing a postdoctoral fellowship to S.R. (SFRH/BPD/72710/2010). C.S.-M. and C.P.-N. are supported by research fellowships of MyHealth (DoIT—Desenvolvimento e Operacionalização da Investigação de Translação, Contract 13853). N.C.S. is supported by a SwitchBox postdoctoral fellowship. The authors thank Teresa Castanho and all study participants.
GLOSSARY
- CM
central memory
- CMV
cytomegalovirus
- EM
effector memory
- GDS
mood
- GENEXEC
general and executive function
- LD
late differentiated
- MEM
memory
- Treg
regulatory T cell
Footnotes
Supplemental data at Neurology.org/nn
AUTHOR CONTRIBUTIONS
C.S.-M. and S.R. performed the immune cell phenotyping experiments and analysis. N.C.S. and C.P.-N. performed the recruitment of the individuals. C.S.-M., N.C.S., and P.C. performed the statistical analysis of the data. J.A.P., N.S., and M.C.-N. designed the study and established the cohort. All authors contributed to the planning of the experiments, data interpretation, writing of the manuscript, and approval of the final version of the manuscript.
STUDY FUNDING
This work was funded by the European Commission (FP7): “SwitchBox” (Contract HEALTH-F2-2010-259772) and co-financed by the Portuguese North Regional Operational Program (ON.2—O Novo Norte) under the National Strategic Reference Framework (QREN), through the European Regional Development Fund (FEDER).
DISCLOSURE
C. Serre-Miranda, S. Roque, N.C. Santos, C. Portugal-Nunes, and P. Costa report no disclosures. J.A. Palha is a coeditor on an issue in Frontiers in Neurosciences. N. Sousa is Editor-in-Chief for Frontiers in Behavioral Neuroscience and Associate Editor for Molecular Neurodegeneration. M. Correia-Neves reports no disclosures. Go to Neurology.org/nn for full disclosures.
REFERENCES
- 1.Derecki NC, Cardani AN, Yang CH, et al. Regulation of learning and memory by meningeal immunity: a key role for IL-4. J Exp Med 2010;207:1067–1080. [DOI] [PMC free article] [PubMed] [Google Scholar]
- 2.Kipnis J, Gadani S, Derecki NC. Pro-cognitive properties of T cells. Nat Rev Immunol 2012;12:663–669. [DOI] [PMC free article] [PubMed] [Google Scholar]
- 3.Ron-Harel N, Segev Y, Lewitus GM, et al. Age-dependent spatial memory loss can be partially restored by immune activation. Rejuvenation Res 2008;11:903–913. [DOI] [PubMed] [Google Scholar]
- 4.Wolf SA, Steiner B, Akpinarli A, et al. CD4-positive T lymphocytes provide a neuroimmunological link in the control of adult hippocampal neurogenesis. J Immunol 2009;182:3979–3984. [DOI] [PubMed] [Google Scholar]
- 5.Ziv Y, Ron N, Butovsky O, et al. Immune cells contribute to the maintenance of neurogenesis and spatial learning abilities in adulthood. Nat Neurosci 2006;9:268–275. [DOI] [PubMed] [Google Scholar]
- 6.Ziv Y, Schwartz M. Immune-based regulation of adult neurogenesis: implications for learning and memory. Brain Behav Immun 2008;22:167–176. [DOI] [PubMed] [Google Scholar]
- 7.Kipnis J, Derecki NC, Yang C, Scrable H. Immunity and cognition: what do age-related dementia, HIV-dementia and “chemo-brain” have in common? Trends Immunol 2008;29:455–463. [DOI] [PubMed] [Google Scholar]
- 8.Schwartz M, Shechter R. Protective autoimmunity functions by intracranial immunosurveillance to support the mind: the missing link between health and disease. Mol Psychiatry 2010;15:342–354. [DOI] [PubMed] [Google Scholar]
- 9.Kipnis J, Cohen H, Cardon M, Ziv Y, Schwartz M. T cell deficiency leads to cognitive dysfunction: implications for therapeutic vaccination for schizophrenia and other psychiatric conditions. Proc Natl Acad Sci U S A 2004;101:8180–8185. [DOI] [PMC free article] [PubMed] [Google Scholar]
- 10.Brynskikh A, Warren T, Zhu J, Kipnis J. Adaptive immunity affects learning behavior in mice. Brain Behav Immun 2008;22:861–869. [DOI] [PubMed] [Google Scholar]
- 11.Villeda SA, Luo J, Mosher KI, et al. The ageing systemic milieu negatively regulates neurogenesis and cognitive function. Nature 2011;477:90–94. [DOI] [PMC free article] [PubMed] [Google Scholar]
- 12.Villeda SA, Plambeck KE, Middeldorp J, et al. Young blood reverses age-related impairments in cognitive function and synaptic plasticity in mice. Nat Med 2014;20:659–663. [DOI] [PMC free article] [PubMed] [Google Scholar]
- 13.Paulo AC, Sampaio A, Santos NC, et al. Patterns of cognitive performance in healthy ageing in Northern Portugal: a cross-sectional analysis. PLoS One 2011;6:e24553. [DOI] [PMC free article] [PubMed] [Google Scholar]
- 14.Salthouse TA. Selective review of cognitive aging. J Int Neuropsychol Soc 2010;16:754–760. [DOI] [PMC free article] [PubMed] [Google Scholar]
- 15.Santos NC, Costa PS, Cunha P, et al. Mood is a key determinant of cognitive performance in community-dwelling older adults: a cross-sectional analysis. Age (Dordr) 2013;35:1983–1993. [DOI] [PMC free article] [PubMed] [Google Scholar]
- 16.Santos NC, Costa PS, Cunha P, et al. Clinical, physical and lifestyle variables and relationship with cognition and mood in aging: a cross-sectional analysis of distinct educational groups. Front Aging Neurosci 2014;6:21. [DOI] [PMC free article] [PubMed] [Google Scholar]
- 17.Clyne B, Olshaker JS. The C-reactive protein. J Emerg Med 1999;17:1019–1025. [DOI] [PubMed] [Google Scholar]
- 18.Kline RB. Principles and Practice of Structural Equation Modeling. New York, NY: Guilford Press; 2005. [Google Scholar]
- 19.Kotrlik JW, Williams HA. The incorporation of effect size in information technology, learning, and performance research. Inf Technol Learn Perform J 2003;21:1–7. [Google Scholar]
- 20.Saule P, Trauet J, Dutriez V, Lekeux V, Dessaint JP, Labalette M. Accumulation of memory T cells from childhood to old age: central and effector memory cells in CD4(+) versus effector memory and terminally differentiated memory cells in CD8(+) compartment. Mech Ageing Dev 2006;127:274–281. [DOI] [PubMed] [Google Scholar]
- 21.Ardila A, Ostrosky-Solis F, Rosselli M, Gomez C. Age-related cognitive decline during normal aging: the complex effect of education. Arch Clin Neuropsychol 2000;15:495–513. [PubMed] [Google Scholar]
- 22.Forstmeier S, Maercker A. Motivational reserve: lifetime motivational abilities contribute to cognitive and emotional health in old age. Psychol Aging 2008;23:886–899. [DOI] [PubMed] [Google Scholar]
- 23.Harvey PD, Reichenberg A, Bowie CR. Cognition and aging in psychopathology: focus on schizophrenia and depression. Annu Rev Clin Psychol 2006;2:389–409. [DOI] [PubMed] [Google Scholar]
- 24.Minicuci N, Marzari C, Maggi S, Noale M, Senesi A, Crepaldi G. Predictors of transitions in vitality: the italian longitudinal study on aging. J Gerontol A Biol Sci Med Sci 2005;60:566–573. [DOI] [PubMed] [Google Scholar]
- 25.Dowlati Y, Herrmann N, Swardfager W, et al. A meta-analysis of cytokines in major depression. Biol Psychiatry 2010;67:446–457. [DOI] [PubMed] [Google Scholar]
- 26.Miller AH, Maletic V, Raison CL. Inflammation and its discontents: the role of cytokines in the pathophysiology of major depression. Biol Psychiatry 2009;65:732–741. [DOI] [PMC free article] [PubMed] [Google Scholar]
- 27.Stine-Morrow EA, Parisi JM, Morrow DG, Park DC. The effects of an engaged lifestyle on cognitive vitality: a field experiment. Psychol Aging 2008;23:778–786. [DOI] [PMC free article] [PubMed] [Google Scholar]
- 28.Tan J, Town T, Abdullah L, et al. CD45 isoform alteration in CD4+ T cells as a potential diagnostic marker of Alzheimer's disease. J Neuroimmunol 2002;132:164–172. [DOI] [PubMed] [Google Scholar]
- 29.Radjavi A, Smirnov I, Kipnis J. Brain antigen-reactive CD4+ T cells are sufficient to support learning behavior in mice with limited T cell repertoire. Brain Behav Immun 2014;35:58–63. [DOI] [PMC free article] [PubMed] [Google Scholar]
- 30.Dimopoulos N, Piperi C, Salonicioti A, et al. Indices of low-grade chronic inflammation correlate with early cognitive deterioration in an elderly Greek population. Neurosci Lett 2006;398:118–123. [DOI] [PubMed] [Google Scholar]
- 31.Trollor JN, Smith E, Baune BT, et al. Systemic inflammation is associated with MCI and its subtypes: the Sydney Memory and Aging Study. Dement Geriatr Cogn Disord 2010;30:569–578. [DOI] [PubMed] [Google Scholar]
- 32.Okada R, Kondo T, Matsuki F, Takata H, Takiguchi M. Phenotypic classification of human CD4+ T cell subsets and their differentiation. Int Immunol 2008;20:1189–1199. [DOI] [PubMed] [Google Scholar]
Associated Data
This section collects any data citations, data availability statements, or supplementary materials included in this article.