Abstract
The influence of adaptation to pH (from pH 5.0 to 9.0) on membrane lipid composition, verotoxin concentration, and resistance to acidic conditions in simulated gastric fluid (SGF) (pH 1.5, 37°C) was determined for Escherichia coli O157:H7 (HEC, ATCC 43895), an rpoS-deficient mutant of ATCC 43895 (HEC-RM, FRIK 816-3), and nonpathogenic E. coli (NPEC, ATCC 25922). Regardless of the strain, D values (in SGF) of acid-adapted cells were higher than those of non-acid-adapted cells, with HEC adapted at pH 5.0 having the greatest D value, i.e., 25.6 min. Acid adaptation increased the amounts of palmitic acid (C16:0) and decreased cis-vaccenic acid (C18:1ω7c) in the membrane lipids of all strains. The ratio of cis-vaccenic acid to palmitic acid increased at acidic pH, causing a decrease in membrane fluidity. HEC adapted to pH 8.3 and HEC-RM adapted to pH 7.3 exhibited the greatest verotoxin concentrations (2,470 and 1,460 ng/ml, respectively) at approximately 108 CFU/ml. In addition, the ratio of extracellular to intracellular verotoxin concentration decreased at acidic pH, possibly due to the decrease of membrane fluidity. These results suggest that while the rpoS gene does not influence acid resistance in acid-adapted cells it does confer decreased membrane fluidity, which may increase acid resistance and decrease verotoxin secretion.
Escherichia coli O157:H7 is a foodborne pathogen that causes hemorrhagic colitis (29), hemolytic uremic syndrome (16, 17), and thrombotic thrombocytopenic purpura (25). Traditionally it had been believed that acidic foods were safe because organic acids force a microbe's internal pH to decrease by influx of hydrogen ions, thereby interrupting various functions related to metabolism. For this reason, the food industry has long applied low pH to control the growth of pathogens in foods. However, several investigators have found that E. coli O157:H7 can persist in acidic foods (pH ≤ 4.5) such as apple cider (5), mayonnaise (39), buttermilk (27), fermented sausage (14), and salad dressing (30).
The importance of gastric fluid as a first line of defense against enteric pathogens is well recognized. To cause illness in humans, an invading microorganism must survive the acidic environment in the stomach before it reaches the intestine (4, 20). The ability of E. coli O157:H7 to resist acidic conditions contributes to its low infectious dose by allowing small numbers of the organism to pass through the stomach acidity barrier (5, 24). The infectious dose of enteric pathogens corresponds to their relative abilities to withstand gastric acid (24). In addition, cells adapted to low pH by exposure to short or long periods in moderate acidic conditions (pH 4.5 to 5) should be more resistant to the strong acidic environment (pH 1.5 to 2.0) found in the stomach. In fact, the resistance of E. coli to low pH can be induced by prior exposure of the bacterium to sublethal pH conditions (15).
In 1992, the United States Department of Agriculture approved the application of organic acid rinses to beef carcasses to reduce microbial contamination (31). However, Brackett et al. (7) reported that hot acid sprays did not control E. coli O157:H7 on raw beef, which suggests that adaptation of surviving E. coli O157:H7 to acid may occur during the rinsing of animal carcasses with acid and the subsequent storage period. Consequently, improper cooking of beef contaminated by acid-adapted cells may increase the risk of illness. Another situation in which adaptation to acid might occur is during fermentation, when the pH of the food gradually decreases from pH 7.0 to 4.5. Fermented foods contaminated with pathogens may contribute to exposure to moderate acidic conditions that could render pathogens more resistant to gastric fluid. Therefore, exposure to nonlethal acidic pH can enhance pathogen resistance to a more acidic condition (24).
The virulence properties of E. coli O157:H7 have been associated with the ability of the bacterium to attach to and efface intestinal mucosal cells and to elaborate cytotoxic verotoxins I and II (18). These toxins are secreted through the cell envelope via vesicles, which are spherical fragments of the bacterial outer membrane (19). Thus, membrane fluidity may play an important role in the secretion of verotoxins. Generally, environmental stresses induce the alteration of membrane lipid composition as cells attempt to cope with these stresses. For example, growth temperature affects membrane fluidity by regulating the ratio of saturated to unsaturated fatty acids (35, 36, 37).
Although there are reports of acid-adapted E. coli O157:H7 resistance in various foods and media, there exists a paucity of information concerning the influence of pH adaptation on membrane fluidity and verotoxin secretion. To help understand the responses of E. coli O157:H7 to acid and alkali stresses, the relationships between (i) acid resistance and membrane lipid composition, (ii) membrane lipid composition and verotoxin secretion, and (iii) pH and verotoxin secretion were elucidated in the present study.
MATERIALS AND METHODS
Bacterial strains and culture conditions.
Enterohemorrhagic E. coli O157:H7 ATCC 43895 (HEC) and nonpathogenic E. coli ATCC 25922 (NPEC) were purchased from the American Type Culture Collection (Manassas, Va.). E. coli O157:H7 FRIK 816-3, an rpoS-deficient mutant (HEC-RM) of ATCC 43895, was obtained from Charles W. Kaspar of the Food Research Institute, University of Wisconsin—Madison (11). Frozen stock cultures were activated on Trypticase soy agar (BBL, Cockeysville, Md.) slants at 4°C, with biweekly transfers to retain viability during use. Prior to use, working cultures of all strains were grown in Trypticase soy broth (TSB) (BBL) at 37°C with two consecutive transfers after 18-h periods for a total of 36 h of incubation. Cultures were confirmed monthly on sorbitol-MacConkey agar (Oxoid, Basingstoke, England) by the absence of sorbitol fermentation for HEC and HEC-RM and by a sorbitol-positive reaction for NPEC. The presence of the insertional mutation in HEC-RM was confirmed monthly by the ability to grow in TSB containing 250 μg of penicillin G (Sigma, St. Louis, Mo.)/ml (11, 21).
Preparation of pH-adapted cells.
Strains were adapted at 37°C in TSB to various pH values by incubating 102 CFU/ml at pH 7.3 for 18 h, transferring the cultures to pH 6.0 or 8.3 for 18 h, and then effecting an additional transfer of the pH 6.0 and 8.3 cultures to pH 5.0 or 9.0, respectively, for 24 h. For each transfer, fully growing cells (about 108 CFU/ml) were diluted with 0.1% peptone water to achieve an inoculum of 102 CFU/ml. The TSB pH was adjusted with sterile 1 N HCl or 1 N NaOH. Strains grown in pH 7.3 TSB for 18 h at 37°C were used as controls. Initial and final pH values of each treatment are shown in Table 1.
TABLE 1.
TSB pH adaptation treatments
| Initial pH | Final pH (difference) for strain:
|
||
|---|---|---|---|
| HEC | HEC-RM | NPEC | |
| 5.0 | 4.5 (0.5) | 4.6 (0.4) | 4.6 (0.4) |
| 6.0 | 5.0 (1.0) | 5.1 (0.9) | 5.4 (0.6) |
| 7.3 | 5.8 (1.5) | 5.9 (1.4) | 6.0 (1.3) |
| 8.3 | 6.8 (1.5) | 6.8 (1.5) | 7.2 (1.1) |
| 9.0 | 7.4 (1.6) | 7.4 (1.6) | 7.7 (1.3) |
Determination of resistance to acid.
Cells adapted to each pH value and nonadapted cells were diluted in 0.1% peptone water to a concentration of 108 CFU/ml, and 1.0 ml of each inoculum was transferred to 99 ml of simulated gastric fluid (6). Suspensions were incubated in a circulating water bath prewarmed to 37°C, and survival was monitored periodically. Simulated gastric fluid consisted of 8.3 g of proteose-peptone (Difco, Detroit, Mich.)/liter, 3.5 g of d-glucose (Sigma)/liter, 2.05 g of NaCl (Fisher Scientific, Pittsburgh, Pa.)/liter, 0.6 g of KH2PO4 (Sigma)/liter, 0.11 g of CaCl2 (Fisher Scientific)/liter, 0.37 g of KCl (Sigma)/liter, 0.05 g of ox bile (Sigma)/liter, 0.1 g of lysozyme (Sigma)/liter, and 13.3 mg of pepsin (Sigma)/liter. The final pH was adjusted to 1.5 by using sterile 5.0 N HCl (Fisher Scientific). All compounds were autoclaved separately except for ox bile, lysozyme, and pepsin, which were filter sterilized, followed by aseptic mixing. Viable cell densities were determined by spiral plating (model D; Spiral Biotech, Bethesda, Md.) appropriate dilutions in 0.1% peptone water on Trypticase soy agar plates that were incubated at 37°C for 24 h prior to automated colony counting.
Membrane lipid composition.
After each culture was habituated to the acidic conditions, membrane fatty acid methyl esters in 40 mg of bacterial pellets were analyzed by using a gas chromatography-fatty acid methyl ester procedure described elsewhere (37). Sherlock Microbial Identification System (MIDI Inc., Newark, Del.) was used for analyzing fatty acid profiles.
Determination of verotoxin concentration.
To observe the influence of pH adaptation on verotoxin production, intracellular and extracellular verotoxin concentrations of cells adapted to each pH were measured by using a procedure described elsewhere (22, 37). Briefly, a 5-μl volume of a 108-CFU/ml culture was added to 245 μl of sample diluent provided by the manufacturer (Meridian Diagnostics, Inc., Cincinnati, Ohio) in a microtube. Rabbit antibodies specific for verotoxins, goat anti-rabbit antibody conjugated to horseradish peroxidase as an enzyme conjugate, and urea peroxide as a substrate were used for this assay. Reaction mixture aliquots were read spectrophotometrically at 450 nm with a microtiter plate spectrophotometer (Spectra Max 250; Molecular Devices Corp., Sunnyvale, Calif.). Samples were considered verotoxin positive when the optical density was ≥0.18. For quantification of verotoxins, a standard curve of optical density versus verotoxin I (Sigma) concentration was prepared to determine unknown verotoxin concentrations produced by HEC and HEC-RM. To extract intracellular verotoxins, cell pellets collected by centrifugation were mechanically disrupted by using ultrasonication (model 100 Ultrasonic Dismembrator; Fisher Scientific) at 22.5 kHz for 15 s.
Statistical analysis.
D values (in minutes) in simulated gastric fluid were determined by plotting the log10 number of survivors against time for each pH-adapted strain. The line of best fit for survivor plots was determined by linear regression with Sigma Plot (SPSS Science, Chicago, Ill.), and the negative reciprocal of the slope was used for the D value. A completely randomized experimental design was used with D value means, membrane lipid composition data, and verotoxin concentrations obtained from duplicate observations from three replicate experiments. All data were analyzed by analysis of variance, and means were separated by least significant difference (P < 0.05) (Statistical Analysis Software, version 8.0; SAS Institute, Cary, N.C.).
RESULTS AND DISCUSSION
Acid resistance.
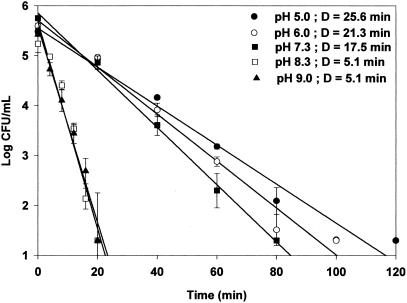
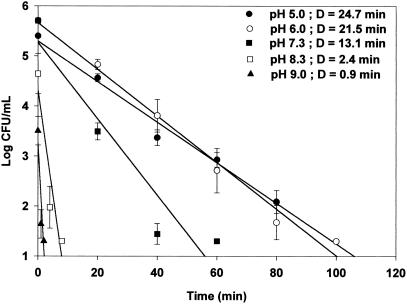
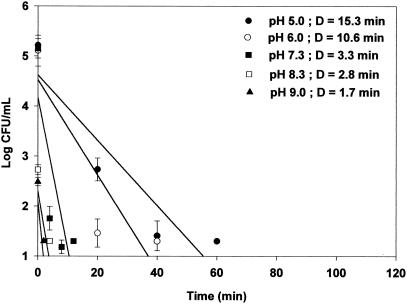
The acid resistance of cells grown at each pH was measured in simulated gastric fluid (pH 1.5) at 37°C to determine if the acid resistance of E. coli O157:H7 may be sufficient to protect it from the acidic conditions of the stomach. Regardless of the bacterial strain, acid-adapted cells (pH 5.0 and 6.0) exhibited greater D values than nonadapted cells (pH 7.3) and alkali-adapted cells (pH 8.3 and 9.0). Acid-adapted HEC at pH 5.0 exhibited the greatest D value increase from 5.1 (alkali-adapted cells at pH 9.0) to 25.6 min (Fig. 1). D values for acid-adapted HEC-RM cells at pH 5.0 and 6.0 were similar to those of HEC cells, i.e., 24.7 and 21.5 min, respectively. D values for control (pH 7.3) and alkali-adapted HEC-RM cells at pH 8.3 and 9.0 were less than those of HEC cells (Fig. 2). For NPEC, the D value in simulated gastric fluid of acid-adapted cells at pH 5.0 was 9 times greater than that of cells adapted at pH 9.0 and 4.6 times greater than that of control cells at pH 7.3 (Fig. 3). These results clearly demonstrate that cells adapted to moderate acidic conditions were more resistant to strong acidic conditions than were alkali-adapted or nonadapted cells.
FIG. 1.
Survival curve and D values (in minutes) of E. coli O157:H7 (HEC) adapted to pH 5.0, 6.0, 7.3, 8.3, and 9.0 in stimulated gastric fluid (pH 1.5). Detection limit, 20 CFU/ml.
FIG. 2.
Survival curve and D values (in minutes) of HEC-RM adapted to pH 5.0, 6.0, 7.3, 8.3, and 9.0 in stimulated gastric fluid (pH 1.5). Detection limit, 20 CFU/ml.
FIG. 3.
Survival curve and D values (in minutes) of NPEC adapted to pH 5.0, 6.0, 7.3, 8.3, and 9.0 in stimulated gastric fluid (pH 1.5). Detection limit, 20 CFU/ml.
Leyer et al. (23) demonstrated that acid-adapted E. coli O157:H7 has enhanced resistance to acidic pH and extended survival in shredded dry salami and fermented sausage. Cheville et al. (11) reported that the D value of ATCC 43895 was 1 h and that of the rpoS-deficient mutant was 0.4 h in simulated gastric fluid (pH 1.5). In addition, the authors suggested that rpoS-regulated proteins are important to E. coli O157:H7 survival in acidic environments. Arnold and Kaspar (3) reported that ATCC 43895 cells were detectable after 3 h in simulated gastric fluid (pH 1.5). These studies reported longer survival times than those obtained in the present study, despite the use of the same strains. This might be explained by the use of shake cultures in previous experiments, whereas the present work used static cultures. Shake cultures can sometimes result in an overestimation of survivors due to cell adherence to flask walls resulting in subpopulations not being continually exposed to lethal conditions.
In comparison with HEC, HEC-RM had similar D values for acid-adapted cells, but HEC-RM D values for cells adapted to alkaline pH values (pH 8.3 and 9.0) were lower than those of HEC. These results indicate that rpoS deficiency in HEC-RM did not affect acid resistance when they were adapted under moderate acid condition. Although rpoS is a regulatory gene involved in acid resistance, E. coli has two other non-rpoS-dependent acid resistance mechanisms enhanced by either glutamate or arginine, which are associated with the consumption of protons by decarboxylase systems when these amino acids are present in the growth medium (13, 24, 33). TSB contains both amino acids; therefore, the activities of these two non-rpoS-dependent systems probably account for the observation that the rpoS-deficient mutant still possessed acid resistance in simulated gastric fluid by prior exposure to moderate acid condition.
Change in membrane lipid composition.
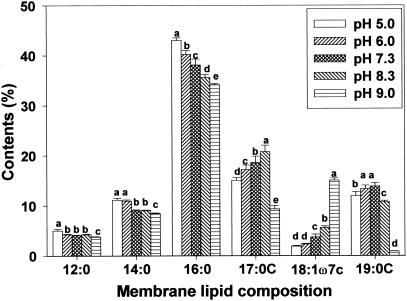
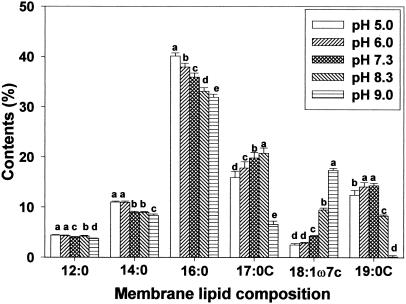
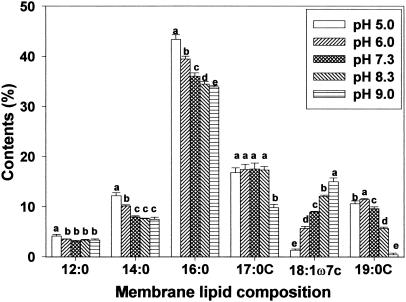
Membrane lipid composition changes after adaptation to pH were investigated by using gas chromatography. Of the fatty acids identified, amounts of palmitic (16:0), cis-vaccenic (18:1ω7c), cycloheptadecanoic (C17:0), and cyclononadecanoic (C19:0) acids were most influenced by the pH at which strains were grown (Fig. 4, 5, and 6). Regardless of bacterial strain, low pH growth induced an increase in palmitic acid and a decrease in cis-vaccenic acid. Obtaining results similar to those of the present study, Brown et al. (8) reported a significant decrease in the percentage of unsaturated fatty acids (16:1ω7c and 18:1ω7c) and an increase in the percentage of saturated fatty acids in acid-adapted E. coli at pH 5.0. Unlike saturated and unsaturated fatty acid profiles, cyclo-fatty acid (CFA) proportions were the lowest in cells grown at pH 9.0. CFA amounts were also lower in cells grown under acidic conditions than in cells grown in neutral pH. Similar fatty acid profiles observed between HEC and HEC-RM indicated that the rpoS gene is not involved in membrane lipid composition changes during adaptation to pH, even though rpoS can cause changes in cellular physiology and morphology. However, different amounts of membrane fatty acids between HEC and HEC-RM were observed.
FIG. 4.
Membrane lipid composition of HEC after adaptation to pH 5.0, 6.0, 7.3, 8.3, and 9.0. Means within each fatty acid having different letters are significantly different (P < 0.05).
FIG. 5.
Membrane lipid composition of HEC-RM after adaptation to various pH values (5.0, 6.0, 7.3, 8.3, and 9.0). Means within each fatty acid having different letters are significantly different (P < 0.05).
FIG. 6.
Membrane lipid composition of NPEC after adaptation to various pH values (5.0, 6.0, 7.3, 8.3, and 9.0). Means within each fatty acid having different letters are significantly different (P < 0.05).
It is known that the rpoS gene regulates cfa transcription, which activates CFA synthase (10, 38). Consequently, rpoS has been designated a global stress regulon. It has been suggested that exposure to mild acidity may activate this regulon, subsequently stimulating the conversion of monounsaturated fatty acids to their cyclopropane derivatives and thereby enhancing the survival of bacterial cells exposed to low pH (10, 32). Present results showed that adaptation to acid caused a decrease in the proportion of CFAs (C17:0 and C19:0) compared to the proportion seen with cells grown at pH 7.3, indicating that rpoS did not activate CFA synthase. Brown et al. (8) found that E. coli O157:H7 habituated at pH 5.0 had greater CFA contents than did nonhabituated cells. Also, Chang and Cronan (10) demonstrated that cfa transcription in E. coli increased when cells were adapted to mildly acidic conditions. On the other hand, Arneborg et al. (2) found that E. coli MT102 grown at pH 6.4 had lower proportions of unsaturated and cyclopropane fatty acids than did the same strain grown at pH 8.4. They demonstrated that E. coli increases the synthesis of saturated fatty acyl chains at the expense of both unsaturated and cyclopropane fatty acyl chains as a response to lower pH. Several other reports also suggest that changes in cyclization of fatty acids are not absolute requirements for adaptation to variations in temperature (1, 28, 34). Although these results focused on growth temperature rather than pH, they suggest that the change in cyclization of membrane fatty acids in environmentally stressed cells is questionable.
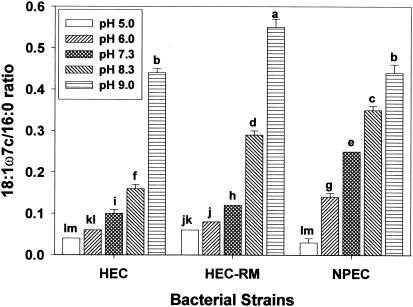
Membrane fluidity is important for cells because it affects membrane functions such as biochemical reactions, transport systems, and protein secretion. In general, the ratio of unsaturated to saturated fatty acids affects membrane fluidity. In the present study, the ratio of cis-vaccenic to palmitic acids (18:1ω7c/16:0) was used as a proxy for membrane fluidity because the short-chain fatty acids are found principally in the lipid A component of the outer membrane and therefore do not contribute substantially to the fluidity of the membrane (9). Due to melting point differences (generally greater for saturated fatty acids than for unsaturated fatty acids), an increase in the ratio represents increased membrane fluidity, whereas a decrease in the ratio represents decreased membrane fluidity. Data contained in Fig. 7 reveal the change in the 18:1ω7c/16:0 ratio of pH-adapted cells. In all cell types, the ratio decreased at acidic pH, thereby implying decreased membrane fluidity. The ratio in HEC-RM increased more than that of HEC at each pH, which indicates that the rpoS gene may affect the regulation of the ratio of unsaturated to saturated fatty acids in the membrane.
FIG. 7.
Ratios of membrane lipid 18:1ω7c to membrane lipid 16:0 (membrane fluidity) of HEC, HEC-RM, and NPEC adapted to various pH values (5.0, 6.0, 7.3, 8.3, and 9.0). Means within each fatty acid having different letters are significantly different (P < 0.05).
Change in verotoxin concentration.
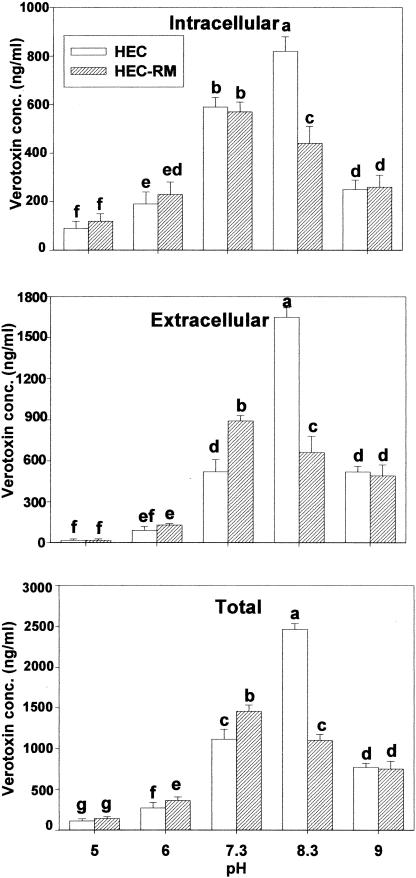
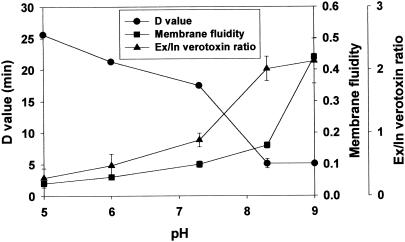
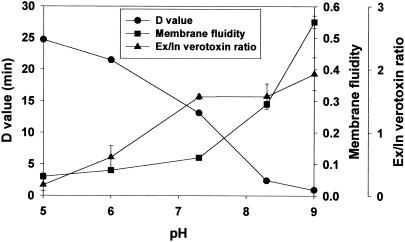
Data presented in Fig. 8 show the effect of each adaptation to a different pH on verotoxin production by HEC and HEC-RM. NPEC was not studied because it is not able to produce verotoxin. A preliminary experiment revealed that the enzyme-linked immunosorbent assay-based Premier EHEC assay kit (Meridian Diagnostics, Inc.) used for verotoxin detection was not sensitive to the pH values used in the study (results not shown). For HEC, cells adapted to pH 8.3 produced the greatest total toxin amount (2,470 ng/ml), whereas HEC-RM cells adapted to pH 7.3 produced the greatest total toxin amount (1,460 ng/ml). Obtaining results similar to those of the present study, MacLeod and Gyles (26) observed that a pH of 8.0 to 8.5 was optimal for production of verotoxin IIv by E. coli O157:H7 in syncase broth. In both strains, acid-adapted cells produced less total verotoxin than nonadapted and alkali-adapted cells, which was consistent with the findings of Duffy et al. (12), who reported that acid-adapted cells at pH 5.6 produced less toxin than non-acid-adapted cells at pH 7.4 after 48 h. The present results also show that the ratio of extracellular to intracellular verotoxin increased at an alkaline pH for HEC and HEC-RM. This finding suggests that membrane fluidity may play an important role in verotoxin synthesis and secretion because increased extracellular verotoxin was associated with increased membrane fluidity (Fig. 9 and 10).
FIG. 8.
Intracellular, extracellular, and total verotoxin concentration (in nanograms per milliliter) of HEC and HEC-RM adapted to various pH values (5.0, 6.0, 7.3, 8.3, and 9.0). Means within each figure having different letters are significantly different (P < 0.05).
FIG. 9.
Correlation among D value, membrane fluidity (18:1ω7c/16:0), and verotoxin secretion (extracellular/intracellular verotoxin concentration) at different pH values (5.0, 6.0, 7.3, 8.3, 9.0) for HEC.
FIG. 10.
Correlation among D value, membrane fluidity (18:1ω7c/16:0), and verotoxin secretion (extracellular/intracellular verotoxin concentration) at different pH values (5.0, 6.0, 7.3, 8.3, and 9.0) for HEC-RM.
Slightly lower amounts of verotoxin were produced by HEC than by HEC-RM, except for cells adapted to pH 8.3 and 9.0. This indicates a possible role for rpoS in the production of verotoxin. Leenanon et al. (22) also reported higher verotoxin amounts in HEC-RM than in HEC at 37°C after adaptation to acid conditions (pH 4.8 to 4.9). Together, these observations suggest that rpoS may act either directly or indirectly as a repressor of toxin expression in acid conditions. In contrast to what was observed at an acidic pH, rpoS promoted the formation of verotoxin at alkaline pH.
It is unclear why verotoxin amounts decreased in acid- and alkali-adapted cells. Perhaps sublethal pH extremes repress the expression of the verotoxin gene or perhaps the energy involved in toxin production is diverted to other metabolic processes necessary for growth and survival. Further research is required to elucidate the mechanism for decreased verotoxin production in pH-stressed cells.
Conclusion.
Acid-adapted E. coli O157:H7 strains (pH 5.0 and 6.0) were more acid resistant than nonadapted (pH 7.3), alkali-adapted (pH 8.3 and 9.0), or nonpathogenic E. coli cells. Although the presence of rpoS slightly increased the acid resistance of E. coli O157:H7 grown at alkaline pH, it did not affect the acid resistance of acid-adapted cells, presumably due to the activation of other mechanisms to cope with acid stress. Decreased membrane fluidity was associated with increased acid resistance for both HEC (Fig. 9) and HEC-RM (Fig. 10). The decrease in membrane fluidity under acidic growth conditions may be associated with changes in proton flux whereby adapted cells do not allow protons to flow into the cell as easily as nonadapted cells. In contrast, increased fluidity in alkali condition may allow metabolic organic acids or protons to more readily flow out of the cell to decrease the environmental pH. Decreased membrane fluidity also was associated with decreased verotoxin secretion in E. coli O157:H7 (Fig. 9 and 10). Acid adaptation reduced the total amount of verotoxin produced, perhaps by repressing the production of toxin. The results presented in this study may be helpful in understanding the relationships among acid resistance, membrane fluidity, and verotoxin secretion in E. coli O157:H7 after long-term exposure to sublethal pH extremes.
Acknowledgments
We thank Charles W. Kaspar of the University of Wisconsin—Madison Food Research Institute for the rpoS mutant.
This work was supported in part by a USDA-CSREES special grant (00-34231-9797) and by the Mississippi Agricultural and Forestry Experiment Station under project MIS-081392.
Footnotes
Approved for publication as Journal Article no. J-10401 of the Mississippi Agricultural and Forestry Experiment Station.
REFERENCES
- 1.Aibara, S., M. Kato, M. Ishinaga, and M. Kito. 1972. Changes in positional distribution of fatty acids in the phospholipids of Escherichia coli after shift-down in temperature. Biochim. Biophys. Acta 270:301-306. [PubMed] [Google Scholar]
- 2.Arneborg, N., A. S. Salskov-Iversen, and T. E. Mathiasen. 1993. The effect of growth rate and other growth conditions on the lipid composition of Escherichia coli. Appl. Microbiol. Biotechnol. 39:353-357. [Google Scholar]
- 3.Arnold, K. W., and C. W. Kaspar. 1995. Starvation- and stationary-phase-induced acid tolerance in Escherichia coli O157:H7. Appl. Environ. Microbiol. 61:2037-2039. [DOI] [PMC free article] [PubMed] [Google Scholar]
- 4.Benjamin, M., and A. R. Datta. 1995. Acid tolerance of enterohemorrhagic Escherichia coli. Appl. Environ. Microbiol. 61:1669-1672. [DOI] [PMC free article] [PubMed] [Google Scholar]
- 5.Besser, R. E., S. M. Lett, J. T. Weber, M. P. Doyle, T. J. Barrett, J. G. Wells, and P. M. Griffin. 1993. An outbreak of diarrhea and hemolytic uremic syndrome from Escherichia coli O157:H7 in fresh-pressed apple cider. JAMA 269:2217-2220. [PubMed] [Google Scholar]
- 6.Beumer, R. R., J. de Vries, and F. M. Rombouts. 1992. Campylobacter jejuni non-culturable coccoid cells. Int. J. Food Microbiol. 15:153-163. [DOI] [PubMed] [Google Scholar]
- 7.Brackett, R. E., Y.-Y. Hao, and M. P. Doyle. 1994. Ineffectiveness of hot acid sprays to decontaminate Escherichia coli O157:H7 on beef. J. Food Prot. 57:198-203. [DOI] [PubMed] [Google Scholar]
- 8.Brown, J. L., T. Ross, T. A. McMeekin, and P. D. Nichols. 1997. Acid habituation of Escherichia coli and the potential role of cyclopropane fatty acids in low pH tolerance. Int. J. Food Microbiol. 37:163-173. [DOI] [PubMed] [Google Scholar]
- 9.Casadei, M. A., P. Manas, G. Niven, E. Needs, and B. M. Mackey. 2002. Role of membrane fluidity in pressure resistance of Escherichia coli NCTC 8164. Appl. Environ. Microbiol. 68:5965-5972. [DOI] [PMC free article] [PubMed] [Google Scholar]
- 10.Chang, Y. Y., and J. E. Cronan. 1999. Membrane cyclopropane fatty acid content is a major factor in acid resistance of Escherichia coli. Mol. Microbiol. 33:249-259. [DOI] [PubMed] [Google Scholar]
- 11.Cheville, A. M., K. W. Arnold, C. Buchrieser, C.-M. Cheng, and C. W. Kaspar. 1996. rpoS regulation of acid, heat and salt tolerance in Escherichia coli O157:H7. Appl. Environ. Microbiol. 62:1822-1824. [DOI] [PMC free article] [PubMed] [Google Scholar]
- 12.Duffy, G., D. C. Riordan, J. J. Sheridan, J. E. Call, R. C. Whiting, I. S. Blair, and D. A. McDowell. 2000. Effect of pH on survival, thermotolerance, and verotoxin production of Escherichia coli O157:H7 during simulated fermentation and storage. J. Food Prot. 63:12-18. [DOI] [PubMed] [Google Scholar]
- 13.Foster, J. W. 2000. Microbial responses to acid stress, p. 99-115. In G. Storz and R. Hengge-Aronis (ed.), Bacterial stress responses. American Society for Microbiology, Washington, D.C.
- 14.Glass, K. A., J. M. Loeffelholz, J. P. Ford, and M. P. Doyle. 1992. Fate of E. coli O157:H7 as affected by pH or sodium chloride and in fermented, dry sausage. Appl. Environ. Microbiol. 58:2513-2516. [DOI] [PMC free article] [PubMed] [Google Scholar]
- 15.Goodson, M., and R. J. Rowbury. 1989. Habituation to normal lethal acidity by prior growth of Escherichia coli at a sublethal pH value. Lett. Appl. Microbiol. 8:77-79. [Google Scholar]
- 16.Griffin, P. M., and R. V. Tauxe. 1991. The epidemiology of infections caused by Escherichia coli O157:H7, other enterohemorrhagic E. coli and the associated hemolytic uremic syndrome. Epidemiol. Rev. 13:60-98. [DOI] [PubMed] [Google Scholar]
- 17.Karmali, M. A., M. Petric, C. Lim, P. C. Fleming, G. S. Arbus, and H. Lior. 1985. The association between idiopathic hemolytic uremic syndrome and infection by verotoxin-producing Escherichia coli. J. Infect. Dis. 151:775-781. [DOI] [PubMed] [Google Scholar]
- 18.Karmali, M. A. 1989. Infection by verocytotoxin-producing Escherichia coli. Clin. Microbiol. Rev. 2:15-38. [DOI] [PMC free article] [PubMed] [Google Scholar]
- 19.Kolling, G. L., and K. R. Matthews. 1999. Export of virulence genes and Shiga toxin by membrane vesicles of Escherichia coli O157:H7. Appl. Environ. Microbiol. 65:1843-1848. [DOI] [PMC free article] [PubMed] [Google Scholar]
- 20.Koo, J., D. L. Marshall, and A. Depaola. 2001. Antacid increases survival of Vibrio vulnificus and Vibrio vulnificus phage in a gastrointestinal model. Appl. Environ. Microbiol. 67:2895-2902. [DOI] [PMC free article] [PubMed] [Google Scholar]
- 21.Leenanon, B., and M. A. Drake. 2001. Acid stress, starvation, and cold stress affect poststress behavior of Escherichia coli O157:H7 and nonpathogenic Escherichia coli. J. Food Prot. 64:970-974. [DOI] [PubMed] [Google Scholar]
- 22.Leenanon, B., D. Elhanafi, and M. A. Drake. 2003. Acid adaptation and starvation effects on Shiga toxin production by Escherichia coli O157:H7. J. Food Prot. 66:970-977. [DOI] [PubMed] [Google Scholar]
- 23.Leyer, G. J., L. L. Wang, and E. A. Johnson. 1995. Acid adaptation of Escherichia coli O157:H7 increases survival in acidic foods. Appl. Environ. Microbiol. 61:3752-3755. [DOI] [PMC free article] [PubMed] [Google Scholar]
- 24.Lin, J., M. P. Smith, K. C. Chapin, H. S. Baik, G. N. Bennett, and J. W. Foster. 1996. Mechanisms of acid resistance in enterohemorrhagic Escherichia coli. Appl. Environ. Microbiol. 62:3094-3100. [DOI] [PMC free article] [PubMed] [Google Scholar]
- 25.Machin, S. J. 1984. Clinical annotation: thrombotic thrombocytopenic purpura. Br. J. Haematol. 56:191-197. [DOI] [PubMed] [Google Scholar]
- 26.MacLeod, D. L., and C. S. Gyles. 1989. Effects of culture conditions on yield of Shiga-like toxin IIv from Escherichia coli. Can. J. Microbiol. 35:623-629. [DOI] [PubMed] [Google Scholar]
- 27.McIngvale, S. C., X. Q. Chen, J. L. McKillip, and M. A. Drake. 2000. Survival of E. coli O157:H7 in buttermilk as affected by contamination point and storage temperature. J. Food Prot. 63:441-444. [DOI] [PubMed] [Google Scholar]
- 28.Okuyama, H. 1969. Phospholipid metabolism in Escherichia coli after a shift in temperature. Biochim. Biophys. Acta 176:125-134. [PubMed] [Google Scholar]
- 29.Padhye, N. V., and M. P. Doyle. 1992. Escherichia coli O157:H7: epidemiology, pathogenesis and methods for detection in food. J. Food Prot. 55:555-565. [DOI] [PubMed] [Google Scholar]
- 30.Raghubeer, E. V., J. S. Ke, M. L. Campbell, and R. S. Meayer. 1995. Fate of Escherichia coli O157:H7 and other coliforms in commercial mayonnaise and refrigerated salad dressings. J. Food Prot. 58:13-18. [DOI] [PubMed] [Google Scholar]
- 31.Reagan, J. O. 1994. Foodborne pathogens, p. 119-123. In Proceedings of the 46th Annual Reciprocal Meats Conference. National Livestock and Meat Board, Chicago, Ill.
- 32.Rock, C. O., S. Jackowski, and J. E. Cronan. 1996. Lipid metabolism in prokaryotes, p. 35-74. In D. E. Vance, and J. B. Vance (ed.), Biochemistry of lipids, lipoproteins and membranes. Elsevier, Amsterdam, The Netherlands.
- 33.Rowbury, R. J., T. J. Humphrey, and M. Goodson. 1999. Properties of an l-glutamate-induced acid tolerance response which involves the functioning of extracellular induction components. J. Appl. Microbiol. 86:325-330. [DOI] [PubMed] [Google Scholar]
- 34.Shaw, M. K., and J. L. Ingraham. 1965. Fatty acid composition of Escherichia coli as a possible controlling factor of the minimal growth temperature. J. Bacteriol. 90:141-146. [DOI] [PMC free article] [PubMed] [Google Scholar]
- 35.Sinensky, M. 1974. Homeoviscous adaptation—a homeostatic process that regulates the viscosity of membrane lipids in Escherichia coli. Proc. Natl. Acad. Sci. USA 71:522-525. [DOI] [PMC free article] [PubMed] [Google Scholar]
- 36.Suutari, M., and S. Laakso. 1994. Microbial fatty acids and thermal adaptation. Crit. Rev. Microbiol. 20:285-328. [DOI] [PubMed] [Google Scholar]
- 37.Yuk, H. G., and D. L. Marshall. 2003. Heat adaptation alters Escherichia coli O157:H7 membrane lipid composition and verotoxin production. Appl. Environ. Microbiol. 69:5115-5119. [DOI] [PMC free article] [PubMed] [Google Scholar]
- 38.Wang, A. Y., and J. E. Cronan. 1994. The growth phase-dependent synthesis of cyclopropane fatty acids in Escherichia coli is the result of an RpoS (KatF)-dependent promoter plus enzyme instability. Mol. Microbiol. 11:1009-1017. [DOI] [PubMed] [Google Scholar]
- 39.Zhao, T., and M. P. Doyle. 1994. Fate of enterohemorrhagic E. coli O157:H7 in commercial mayonnaise. J. Food Prot. 57:780-783. [DOI] [PubMed] [Google Scholar]


