Abstract
Objective:
To study the accuracy of CT for staging T3a (TNM 2009) renal cell carcinoma (RCC).
Methods:
Unenhanced and nephrographic phase CT studies of 117 patients (male:female = 82:35; age range, 21–86 years) with T1–T3a RCC were independently reviewed by 2 readers. The presence of sinus or perinephric fat, or renal vein invasion and tumour characteristics were noted.
Results:
Median (range) tumour size was 5.5 (0.9–19.0) cm; and 46 (39%), 16 (14%) and 55 (47%) tumours were pT1, pT2 and pT3a RCC, respectively. The sensitivity/specificity for sinus fat, perinephric fat and renal vein invasion were 71/79%, 83/76% and 59/93% (Reader 1) and 88/71%, 68/72% and 69/91% (Reader 2) with κ = 0.41, 0.43 and 0.61, respectively. Sinus fat invasion was seen in 47/55 (85%) cases with T3a RCC vs 16/55 (29%) and 33/55 (60%) for perinephric fat and renal vein invasion. Tumour necrosis, irregularity of tumour edge and direct tumour contact with perirenal fascia or sinus fat increased the odds of local invasion [odds ratio (OR), 2.5–3.7; p < 0.05; κ = 0.42–0.61]. Stage T3a tumours were centrally located (OR, 3.9; p = 0.0009).
Conclusion:
Stage T3a RCC was identified with a sensitivity of 59–88% and specificity of 71–93% (κ = 0.41–0.61). Sinus fat invasion was the most common invasive feature.
Advances in knowledge:
Centrally situated renal tumours with an irregular tumour edge, inseparable from sinus structures or the perirenal fascia and CT features of tumour necrosis should alert the reader to the possibility of Stage T3a RCC (OR, 2.5–3.9).
Current guidelines1 recommend nephron-sparing procedures (either partial nephrectomy or ablation) for Stage T1a (<4 cm) renal cell carcinomas (RCCs), but the indications for nephron-sparing procedures are widening.2 Successful surgical series have been reported with Stage T1b (<4–7 cm) tumours and even Stage T2 RCCs.3 Central location is not necessarily a barrier to good clinical outcome after partial nephrectomy,3 but nephron-sparing procedures are contraindicated for stage ≥T3a renal cancers.1 Thus, prior accurate recognition of T3a stage is important, especially with central renal masses, as any pre-operative suspicion of local invasion should contraindicate nephron-sparing surgery or ablation.
In the most recent TNM iteration, Stage T1 and T2 tumours are defined by tumour diameter (T1a, ≤4 cm; T1b, 4–7 cm; T2a, 7–10 cm; and T2b, ≥10 cm) and the absence of any local invasion. Stage T3a RCC was redefined to include invasion of either renal sinus or perinephric fat.4 Renal vein invasion [main renal vein and/or segmental (muscle-containing) branch invasion], without caval involvement, was downgraded from Stage T3b to Stage T3a, whilst adrenal invasion was upgraded from Stage T3a to Stage T4. Size is not a governing factor with ≥T3a tumours, and some renal masses <7 cm in diameter will be locally advanced. Nearly half of all pT3a RCCs (n = 309/623) in one study were <7 cm in diameter.5 Other studies have confirmed the poor prognostic significance of sinus fat or venous invasion in masses <7 cm, with a 4–6 times increased risk of cancer-related death.6,7 Centrally located masses are more likely to demonstrate local invasion with positive surgical resection margins after partial nephrectomy,8,9 and unrecognized sinus invasion may explain the recurrence of cancer, and subsequent death from metastatic disease, in some cases of presumed T1 RCCs.8
However, in previous studies, CT staging has been variably accurate10–18 for RCCs, and staging inaccuracies, usually understaging, are said to be most common with Stage T3a disease.12,17 For venous invasion, the specificity and sensitivity have ranged between 58–97% and 32–96%,10,14–16 and for perinephric infiltration, the figures have been 32–96% and 85–93%,14–16 respectively. The CT accuracy for sinus fat invasion has not been previously investigated. The primary aim of this study was to define the accuracy of contrast-enhanced CT for identifying any of the three defining features of Stage T3a RCC, that is, sinus or perinephric fat invasion, or renal vein invasion. Secondary study objectives were to identify any tumour characteristics that increase the odds of T3a disease and may be used as accessory CT signs to alert the reader to an increased likelihood of local invasion by RCC.
METHODS AND MATERIALS
Study design
This was a retrospective, cross-sectional study of consecutive patients who had undergone surgical resection (partial or total nephrectomy) of RCC after pre-operative staging by CT. Two radiologists (3 and 18 years' experience in abdominal radiology) independently reviewed the pre-operative CT scans on picture archiving and communication system workstations. The need to obtain informed consent was waived following discussion with the institutional review board of our hospital (St George's Hospital, London, UK), as this was a retrospective study with no change in clinical management.
Study population
The electronic pathology database of a university teaching hospital was searched by a third radiologist for surgically operated renal tumours between 2005 and 2010. 345 cases were identified, and these reports were extracted. The pathology records of our institute routinely record the tumour type, and the text of the report includes data on the presence of microscopic or macroscopic perinephric fat, and renal vein (main or muscular branch) and/or renal sinus fat invasion. These were used as the defining features of Stage T3a disease.4 Patients with stage T1 or T2 tumours were used as the control group, but patients with vena cava involvement (Stage T3c disease in the previous TNM iteration but Stage T3b in the current TNM classification) or T4 disease were excluded (n = 10 and 14, respectively), as these patients were known to have extensive venous invasion, had undergone nephrectomy with venous reconstruction and were not candidates for nephron-sparing procedures or nephrectomy with curative intent. Those with incomplete pathological information (e.g. it was not stated whether fat invasion was either perinephric or sinus, or both) or of non-RCC pathology (benign or malignant, for example, oncocytoma or transitional cell carcinoma) were also excluded (n = 57). Patients who had undergone pre-operative MRI for staging (n = 34) or had only a single-phase CT (e.g. no unenhanced study), or those who had had a CT scan more than 3 months before the operation were also excluded (n = 113). A total of 117 patients were recruited, and all cases had been deemed suitable for either nephron-sparing procedures or nephrectomy with curative intent. No patient had undergone renal tumour biopsy or renal intervention prior to the CT study. The study cases were assigned a unique number, and their clinical and radiological data were anonymized.
CT examination
In all cases, unenhanced and nephrographic or portal-venous phase studies were evaluated at a slice thickness of 3 mm. Each patient had received 100 ml of intravenous iodinated contrast medium (iodixanol 300 or iohexol 300) injected at a rate of 3 ml s−1. To reduce measurement error and to standardize methods, the axial enhanced images were used for primary diagnostic interpretation, and the other planes were used for supportive information. Some patients had additional studies, for example, arterial or excretory phase CT, but these were not used for study analysis.
Data collection
The two readers were blinded to the clinical and pathological information, and there was no consensus reading. First, the reader evaluated each study for the presence or absence of sinus fat, perinephric fat or venous invasion. The primary CT diagnostic sign for sinus fat infiltration was an ill-defined or irregular margin between the central tumour edge and any part of the renal sinus fat, and/or enhancing tumour tissue seem within the sinus fat. Perinephric fat invasion was diagnosed if an ill-defined or irregular margin was seen between the peripheral tumour edge and the perinephric fat and/or enhancing tumour tissue was seem within the perinephric fat, and the definition of venous invasion was an intraluminal filling defect seen within a segmental (branch) or main renal vein on the post-contrast studies. Next, any potentially useful secondary diagnostic CT features were looked for. Some of these signs (e.g. nodules in the perinephric space) have already been reported in the existing literature, whilst others were novel signs that the authors considered potentially useful for the diagnosis of T3a disease; for example, the thickness of perirenal fascia, asymmetric perinephric vascularity, perinephric septation or stranding and/or nodularity, and these definitions are given in Table 1. A standardized data sheet was formulated and the presence or absence of each CT sign described above was scored on a four-point scale (1, definitely present; 2, probably present; 3, probably absent; and 4, definitely absent). The location of the tumour was also noted to study whether this had a bearing on the likelihood of local invasion. Polarity was defined according to the level of the upper and lower pole calyces and listed as upper polar, interpolar or lower polar (similar to that used for the RENAL nephrometry score19). A tumour was deemed centrally located if >50% of the tumour volume was considered endophytic in location, as also defined in the nephrometry score.19 For consistency, tumour size was measured in the axial plane only.
Table 1.
Tumour characteristics and the odds of local invasion by renal cell carcinoma on CT
| Tumour characteristica | Venous invasion | Sinus fat invasion | Perinephric fat invasion | κ (95% CI) |
|---|---|---|---|---|
| Tumour necrosisb | ||||
| Number of cases | 13/30 | 21/30 | 10/30 | |
| OR (95% CI), p-value | 0.95 (0.45–2), 0.9 | 0.94 (0.5–1.8), 0.8 | 0.38 (0.18–0.85), 0.01 | 0.61 (0.45–0.67) |
| Irregular tumour edgec | ||||
| Number of cases | 22/24 | 34/24 | 23/24 | |
| OR (95% CI), p-value | 3.1 (1.5–6.4), 0.007 | 1.8 (1.03–3.14), 0.04 | 3.2 (1.6–6.4), 0.001 | 0.5 (0.38–0.62) |
| Tumour reaches up to the perirenal fasciad | ||||
| Number of cases | 13/15 | 21/15 | 15/15 | |
| OR (95% CI), p-value | 2.6 (1.1–6.1), 0.02 | 2.2 (1.05–4.5), 0.04 | 2.8 (1.3–6.4), 0.01 | 0.46 (0.3–0.6) |
| Tumour reaches up to the sinus structurese | ||||
| Number of cases | 26/53 | 64/53 | 25/53 | |
| OR (95% CI), p-value | 1.4 (0.71–2.65), 0.35 | 3.4 (1.86–6.1), 0.001 | 1.17 (0.61–2.24), 0.6 | 0.42 (0.29–0.49) |
| Thickened perirenal fasciaf | ||||
| Number of cases | 19/17 | 23/17 | 19/17 | |
| OR (95% CI), p-value | 3.7 (1.7–8), 0.0008 | 2.14 (1.1–4.3), 0.03 | 3.5 (1.63–7.5), 0.001 | 0.24 (0.01–0.34) |
| Accentuated perinephric septationg | ||||
| Number of cases | 20/25 | 37/25 | 20/25 | |
| OR (95% CI), p-value | 2.5 (1.2–5.1), 0.01 | 2.8 (1.5–5.1), 0.001 | 2.4 (1.17–4.8), 0.02 | 0.09 (0.02–0.17) |
| Accentuated perinephric strandingh | ||||
| Number of cases | 29/50 | 50/50 | 33/50 | |
| OR (95% CI), p-value | 1.9 (0.1–3.7), 0.05 | 1.8 (1.1–3.2), 0.03 | 1.6 (0.86–2.9), 0.4 | 0.21 (0.09–0.32) |
| Increased perinephric vascularityi | ||||
| Number of cases | 33/52 | 54/52 | 29/52 | |
| OR (95% CI), p-value | 2.5 (1.2–5), 0.008 | 2.1 (1.18–3.6), 0.01 | 1.1 (0.63–2.12), 0.65 | 0.19 (0.1–0.28) |
| Perinephric nodulesj | ||||
| Number of cases | 3/1 | 4/1 | 3/1 | |
| OR (95% CI), p-value | 7.5 (0.7–74), 0.08 | 5.6 (0.6–51), 0.12 | 17 (0.86–336), 0.06 | 0.2 (0.1–0.4) |
| Calcification | ||||
| Number of cases | 13/30 | 21/30 | 10/30 | |
| OR (95% CI), p-value | 0.95 (0.45–2), 0.9 | 0.94 (0.5–1.8), 0.8 | 0.38 (0.18–0.85), 0.01 | 0.65 (0.5–0.8) |
CI, confidence interval; OR, odds ratio.
The definition of each tumour characteristic studied is given below. The figure for number of cases relates to the number of times both readers cited that the given CT characteristic was present. The first figure relates to the number of times this was seen in those with pathological evidence of venous invasion, sinus fat or perinephric fat invasion as appropriate. The second figure is the number of times the same CT characteristic was noted in those without invasive disease. From these figures, the odds ratio was calculated (see text for further details).
An irregular, poorly enhancing and heterogeneous cavity within the tumour on post-contrast studies.
Irregular or poorly defined edge of the tumour when compared with the adjacent or contralateral normal renal capsule or sinus structures.
The tumour edge is inseparable from the anterior or posterior renal fascia.
Tumour abuts and/or invades the central sinus structures (e.g. calyx/infundibulum/renal pelvis) with no definable intervening normal renal parenchyma.
Perirenal fascia subjectively thicker when compared with the contralateral perirenal fascia.
Subjectively increased linear structures perpendicular to the renal outline when compared with the contralateral perinephric space.
Subjectively increased linear structures parallel to the renal outline when compared with the contralateral perinephric space.
Perinephric vascularity subjectively greater than the contralateral perinephric space.
Discrete nodules within the confines of the perinephric space, but not medial to the renal hila (which were interpreted as lymph nodes).
Data analysis
Study data were entered onto a common spreadsheet and used to generate summary statistics. Using the pathological findings as the “truth” data, the performance (sensitivity and specificity) of each reader for CT staging of sinus or perinephric fat, or renal vein invasion, was calculated using contingency tables (Fisher's test), and the inter-rater agreement was explored by calculating the weighted Cohen κ score. To explore the secondary aims of the study, two groups were defined—those with ≤T2 stage disease and those with T3a tumours. The value of the various CT signs for predicting renal vein, perinephric or sinus fat invasion were studied by calculating the odds of sinus or perinephric fat, or renal vein invasion in the presence of a given CT sign. For this, all signs scored as definitely or probably present (Scores 1 or 2) were grouped together as test positive (or feature present) and those with Scores 3 or 4 were grouped as negative (or CT sign not present) and entered into a 2 × 2 contingency table (Fisher's test) to calculate the odds ratio (OR). To further explore the practical diagnostic value of these various signs, the agreement between the two readers regarding the presence (or absence) of any given sign was measured. For this, the two readers' scores were used to calculate the inter-rater agreement (κ score) for any given CT feature. A p-value of ≤0.05 was considered a statistically significant finding. For inter-rater agreement, a κ score ≤0.40 was taken as poor agreement; 0.40–0.59 as moderate agreement; 0.60–0.74 as good agreement; and ≥0.75 as excellent agreement. Figures for κ are given with 95% confidence intervals (95% CIs). MedCalc for Windows v. 11.3.3 (MedCalc Software bvba, Ostend, Belgium) was used for statistical analysis, and the statistical test used is given where appropriate.
RESULTS
The male:female distribution was 82:35, and the age range of the patients was 21–86 years. The median (range) size of the 117 tumours was 5.5 cm (0.9–19 cm). 11 patients had papillary RCC, 82 had clear-cell RCC, 8 proved to have chromophobe RCC and the rest were of miscellaneous cell type. According to their histology, 15 (13%) tumours were Stage pT1a, 31 (26%) Stage pT1b, 16 (14%) were Stage pT2 and the rest (n = 55; or 47%) were Stage pT3a cancers. In those samples staged as T3a cancer, sinus fat invasion was most common and seen in 47/55 (85%) samples; venous invasion was found in 33/55 (60%); and perinephric fat infiltration was found in 16/55 (29%). Some samples had more than one invasive feature; most commonly, simultaneous sinus fat and venous invasion (seen in 24/55 samples). Only a minority (10/55) had evidence of both central and peripheral invasion (i.e. the perinephric fat as well as the sinus fat and/or veins). Gender [male:female = 15:47 and 20:35 for Stages T1–2 and Stage T3a tumours, respectively (p = >0.05, Fisher's test)] and tumour laterality were not significant risk factors for Stage 3a disease [right:left = 30:32 and 25:30 for Stages T1–2 and Stage T3a tumours, respectively (p ≥ 0.05, Fisher's test)]. As expected, median tumour size in the Stage T3a group was significantly larger [median (range) being 4.5 cm (0.9–14.0 cm) vs 8 cm (2.5–19.0 cm) for Stage T1–2 and Stage T3a tumours, respectively; p = 0.002; Mann–Whitney test], but the range of sizes overlapped and 20/55 (36%) Stage T3a tumours were <7 cm in diameter (of which 5/20 were <4 cm in diameter).
Accuracy of CT for the identifying sinus fat, perinephric fat or renal vein invasion
The performance of each reader for identifying the three diagnostic features of Stage T3a disease on CT is given in Table 2. There was a moderate to good inter-rater agreement between the two readers with agreement being best for venous invasion with a κ value of 0.61 (0.40–0.70). The κ values for sinus fat and perinephric fat invasion were 0.41 (0.21–0.48) and 0.43 (0.17–0.48), respectively.
Table 2.
Performance of readers for the identification of sinus fat, perinephric fat or renal vein invasion by renal cell carcinoma on contrast-enhanced CT scans
| Reader | Invasive feature | Sensitivity | Specificity |
|---|---|---|---|
| Reader 1 | Sinus fat invasion | 71 (58–84) | 79 (67–88) |
| Perinephric fat invasion | 83 (62–95) | 76 (66–84) | |
| Venous invasion | 59 (39–77) | 93 (84–98) | |
| Reader 2 | Sinus fat invasion | 88 (76–96) | 71 (38–63) |
| Perinephric fat invasion | 68 (36–77) | 72 (62–84) | |
| Venous invasion | 69 (48-85) | 91 (83–96) |
Figures are given as percentage (with 95% confidence interval).
Accessory CT signs useful for predicting local invasion
Tumour necrosis, tumour edge reaching up to and inseparable from the renal sinus structures, a perceived irregularity of the tumour edge or accentuated perinephric septa and stranding, thickening of the perirenal fascia or increased perinephric vascularity significantly increased the odds of local invasion (OR = 1.5–3.4; p = <0.05; Table 1). These accessory signs are illustrated in Figures 1–7. However, only a few of these can be considered clinically useful or reproducible. Inter-rater agreement was best for recognizing tumour necrosis (κ = 0.61), followed by a perceived irregularity or poor definition of the tumour edge (κ = 0.50) and direct contact with the perirenal fasciae (κ = 0.46) or sinus structures (κ = 0.42). The 95% CI of these κ values are given in Table 1. The agreement regarding the other signs was either poor or very poor (κ ≤ 0.39 for all; Table 1). Most of the features commonly seen with venous invasion were also associated with sinus fat invasion (Table 1) and should be considered jointly as signs of central invasion (Figure 5).
Figure 1.
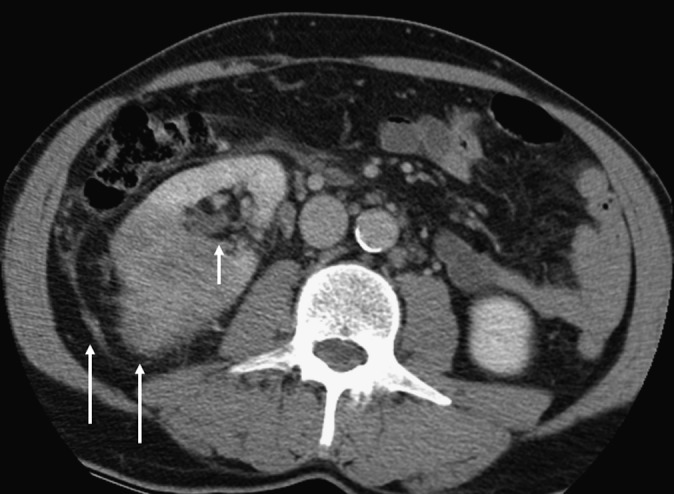
A 71-year-old female with clear-cell renal carcinoma with microscopic venous and sinus fat invasion and macroscopic perinephric fat invasion. An irregular tumour edge and thickened perirenal fascia are seen (long arrows), and these CT features were found to be significantly more common in those with perinephric fat invasion. Medially, the tumour edge is seen to be in contact with the renal sinus (short arrow). This is a risk factor for sinus fat and/or venous invasion.
Figure 7.
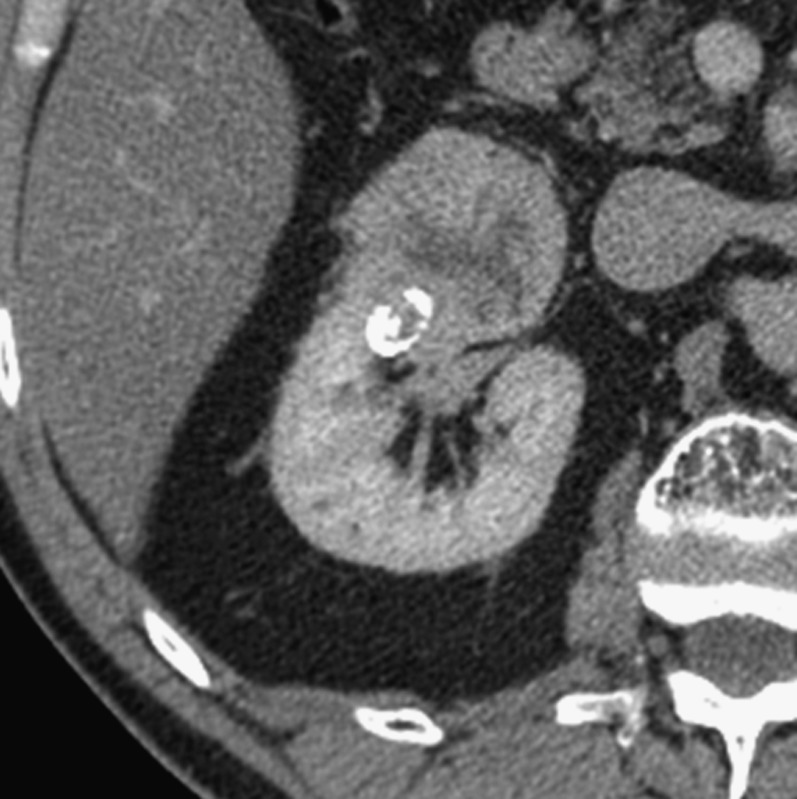
A 63-year-old male with a 5.5-cm grade 2 clear-cell carcinoma, with microscopic renal vein invasion as the sole feature of T3a stage disease. This axial CT scan shows that the tumour reaches up to the renal sinus structures, which is associated with central invasion (either of the sinus fat or the veins).
Figure 5.
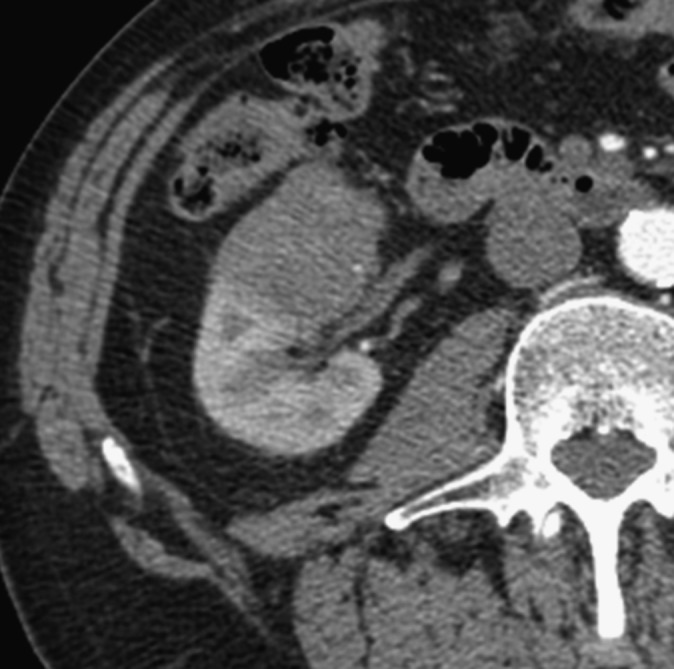
A 47-year-old male who underwent right total nephrectomy. The tumour proved to be a 5.6-cm grade 4, clear-cell renal carcinoma (eosinophilic variant). Microscopic sinus fat and venous invasion were found. There was no perinephric fat invasion. Sinus fat and venous invasion were found to often coexist in our study.
Figure 3.
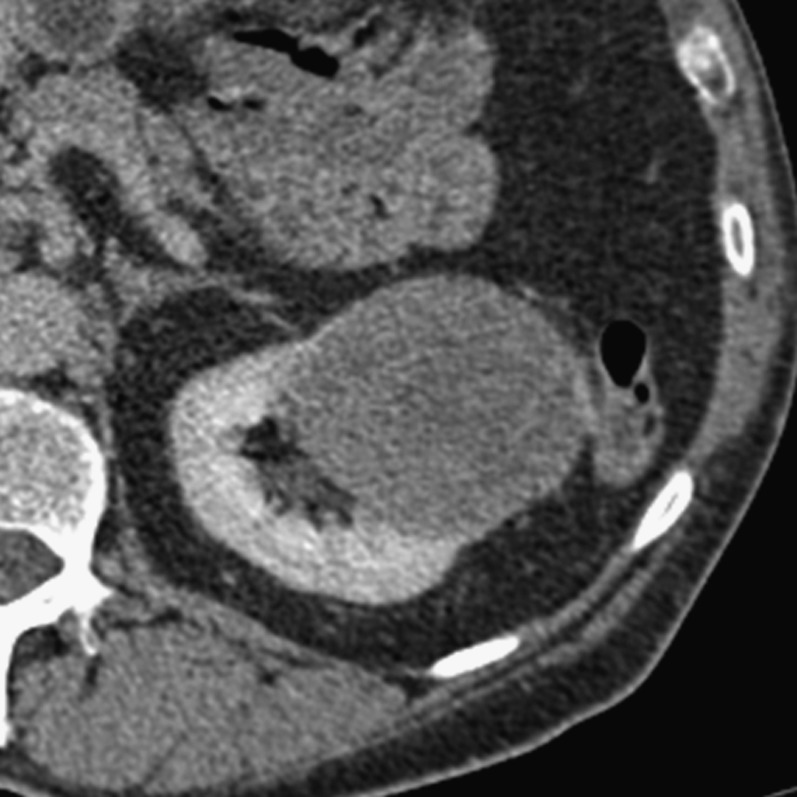
A 47-year-old female with a Type I papillary renal cell carcinoma, nuclear grade 2 who underwent total left nephrectomy. The tumour abuts the sinus fat, and microscopic sinus fat invasion was the only invasive feature on histology.
Performance regarding microscopic vs macroscopic T3a disease
Microscopic local invasion (fat or venous invasion) was the sole histological evidence of T3a stage in 25/55 (45%). Microscopic sinus fat invasion in 14 samples, venous invasion in 6 masses and microscopic perinephric disease in 5 cases. Because of the small numbers, it was not possible to meaningfully compare the readers' performance regarding macroscopic vs microscopic disease, but both readers identified only a minority of cases with microscopic disease; for example, microscopic sinus fat invasion was predicted in only 5/14 and 6/14 cases by Readers 1 and 2, respectively. Performance in identification of main renal vein invasion vs branch vein involvement was also not evaluated as the numbers were also small.
Location of tumour and likelihood of local invasion
The polar position was found to be not important, but Stage T3a tumours were more likely to be centrally located—28/55 vs 13/62 for Stage T3a vs Stage T1–2 stage tumours, respectively [OR 3.9 (1.7–8.2); p = 0.0009; Fisher's test]. Centrally located tumours were also more likely to infiltrate sinus fat rather than the veins—of the 28/55 centrally situated Stage T3a tumours, 26 had sinus fat invasion and 16 showed venous invasion (some of the samples had both fat and venous invasion).
DISCUSSION
The three diagnostic features of Stage T3a RCC were identified on CT with a sensitivity of 59–88% and specificity 71–93%. The highest sensitivity was recorded for sinus fat invasion and the best specificity for renal vein invasion. But performance varied according to the type of invasion and reader. Renal vein invasion demonstrated the best inter-rater agreement (κ = 0.61), and these aspects are further discussed below. The presence of tumour necrosis, tumour edge irregularity, direct perirenal fascial or sinus fat contact by the tumour, thickened perirenal fascia and accentuated perinephric stranding increased the odds of local invasion. However, of all these features, only tumour necrosis, an irregular tumour edge and contact with the renal fascia or sinus fat had a moderate or good inter-rater agreement (κ = 0.42–0.61). Size was not a reliable indicator of T3a stage, as over a third (36%) were <7 cm in diameter, but centrally situated tumours were significantly more likely to be locally invasive (OR, 3.9) and also more likely to invade sinus fat rather than the veins.
Sinus fat invasion by locally advanced RCC has been the focus of many recent clinical outcome studies.6,20–25 It is recognized as a common sign of Stage T3a RCC and signifies a poorer prognosis,6,20,21 hence its recent inclusion into the TNM classification. Yet, invasion of sinus fat has not been investigated in the radiological literature. Previous studies have looked at perinephric fat involvement alone.12–16,26,27 Hallscheidt et al15 explored central invasion by RCC and reported a sensitivity of 75–100% with specificity of only 41–58%, but only a few of their cases actually had central invasion (n = 11/56), and they did not separate sinus fat from venous invasion. Using an ill-defined or indistinct margin between medial tumour edge and the sinus fat as the primary CT diagnostic sign, we identified sinus fat invasion with a sensitivity of 71–88% and specificity of 71–79% (Figures 1–4). It was also more common than perinephric fat invasion, which has also been noted before in surgical series;24 but we suggest that sinus fat invasion and venous invasion should be approached jointly, as they commonly coexist (in 43% of cases in our study).
Figure 4.
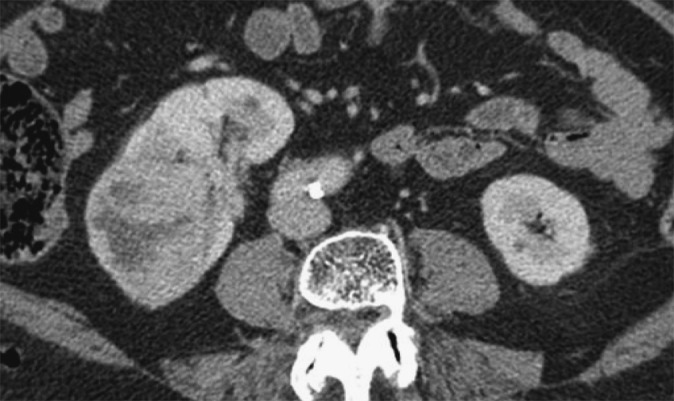
Axial post-intravenous contrast-enhanced CT image demonstrating a 7-cm, grade 2 right renal cancer with microscopic sinus fat invasion but no venous or perinephric fat invasion on histology. The mass is seen to reach up to and efface the sinus structures. The perinephric space and the perirenal fascia are normal.
The reported accuracy of CT for detecting perinephric fat has been 32–64%;15,27 with sensitivity of 32–96%16,27 and specificity between 85% and 93%.14,16 In our series, perinephric fat invasion was identified with a specificity of 72–76% and sensitivity of 68–83%. It was more common if the tumour was necrotic with an irregular capsule and was inseparable from a thickened perirenal fascia (Figures 2 and 6). Perinephric nodules have been reported to be a highly specific sign of perinephric invasion,17 but the practical value of this sign is debatable, as it was an uncommon sign in our series. Perinephric nodules were seen in only five cases in our series and were too few for meaningful analysis.
Figure 2.
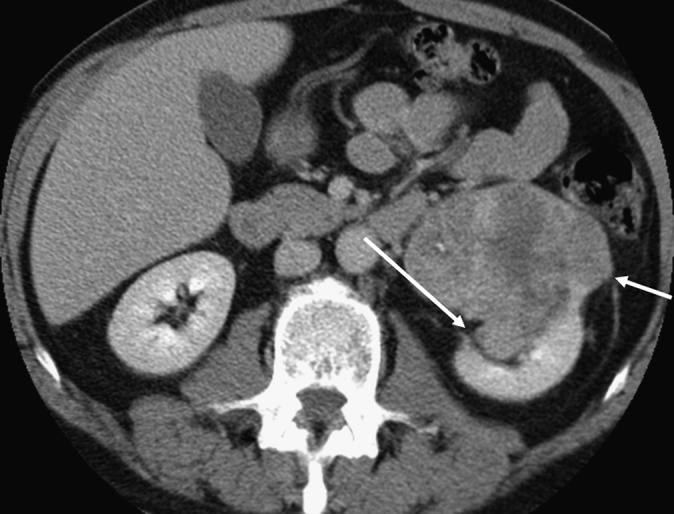
A 64-year old male with a 6-cm grade 4 clear-cell renal carcinoma with sarcomatoid elements and macroscopic sinus fat invasion, microscopic perinephric invasion and no venous involvement. The tumour abuts sinus fat (long arrow) and the perirenal fascia (short arrow). Contact with the perirenal fascia was a risk factor for perinephric invasion (see text).
Figure 6.
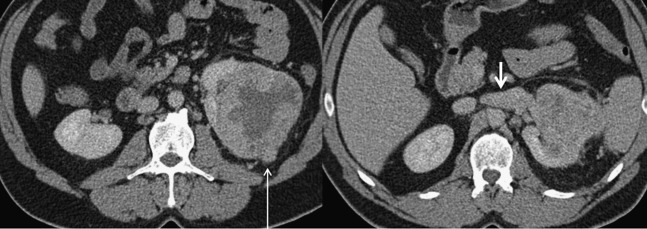
A 42-year-old female who underwent total left nephrectomy for a grade 3, clear-cell renal cancer. Macroscopic venous, perinephric fat and sinus fat invasions were found. These two axial contrast-enhanced CT images demonstrate left renal vein invasion (short arrow) and nodular breach of the renal capsule (long arrow). The images show tumour necrosis, increased stranding of the perinephric fat, thickening of the perirenal fascia and tumour edge abutting the perirenal fascia and sinus structures, and all these features are associated with an increased likelihood of Stage T3a disease.
Regarding CT staging of venous invasion, specificity of 58–97%,10,14,15 sensitivity 78%10 and accuracy of between 75% and 100%12,13,16 have been reported, but these figures refer to all grades of venous invasion, including caval involvement. Some studies have even specifically excluded intra-renal vein invasion.11 The most recent study in the literature focused on branch vein invasion only28 and reported a sensitivity of 94% but a specificity of only 30%. Our results relate to either segmental or main renal vein invasion and lie in the mid-range, with a specificity of 91–93%, but sensitivity was lower at 59–69%. A filling defect in the renal vein,17 tumour thrombus enhancement (a surrogate sign of neovascularity), venous enlargement18 and contiguity with the primary tumour are described CT signs of renal vein invasion. We also have shown that the presence of suspected sinus fat invasion, numerous perinephric septa, stranding or vascularity and thickened perirenal fascia, especially in the presence of a necrotic and irregular tumour edge, should alert the radiologist to more critically evaluate the renal veins. Karlo et al28 found that tumour edge abutting the sinus fat was a good CT indicator of branch renal vein invasion, and our data support the value of this accessory CT sign (Figure 7).
The current European guidelines1 list nephron-sparing procedures as the first choice for T1 tumours and as second choice for Stage T2 tumours, if technically feasible and particularly in those with a solitary functional kidney. For Stage T3 or T4 tumours, the recommendation is for total nephrectomy. Thus, any radiological suspicion of local invasion would have a significant impact on treatment recommendations, and we have shown that local infiltration can be identified with good accuracy using the primary diagnostic signs as used in this study. Moreover, we have shown that many small central masses will be locally invasive, most commonly invading the sinus fat. Central location also has a bearing on the surgical suitability for partial nephrectomy. Scoring systems such as the RENAL nephrometry scale,19 or the PADUA or centrality index29 can be used to predict the likelihood of post-operative complications. These systems were developed to assist surgical planning, but have been reported to have some use for predicating tumour aggressiveness.
Some limitations of our study merit discussion. Firstly, this is a retrospective study with modest study numbers. The study group was also selected from a larger cohort. The reasons for exclusion are given above, and the most common was non-availability of both an unenhanced and a nephrographic series, as the presence of both studies was felt to ensure better evaluation of local invasion. Those with vena cava involvement were also excluded, as these cases would have biased the study in favour of local invasion and these patients were not candidates for nephron-sparing procedures. Those with CT studies more than 3 months were also excluded, but although as a group the excluded cases were not statistically different in their overall demographics, we cannot discount the possibility of selection bias, and further studies are needed to confirm our findings. Also, the diagnostic value of the described secondary CT signs needs confirmation.
The figures presented here also represent the performance with a two-phase CT protocol (unenhanced and portal/venous or nephrographic phase). The best staging performance for perinephric fat infiltration has been reported by Catalano et al16 who used a four-phase (unenhanced, arterial, nephrographic and excretory phase) CT study, reconstructed at 1-mm thickness, and found a 95% staging accuracy (they did not evaluate either intra-renal venous invasion or sinus fat infiltration). These excellent figures have not been replicated in any published series but suggest that staging of RCC demands a more comprehensive CT protocol than that used for diagnosis of renal masses. To subject every patient with suspected RCC to a full four-phase protocol from the outset would be impractical and excessively irradiating, but a case could be made for recalling those with small central masses being considered for nephron-sparing procedures for a dedicated multiphase staging study. The possibility that dedicated renal staging studies, such as the full four-phase study as described above, can better stage RCC, especially microscopic Stage T3a disease, where both readers performed poorly, merits further study.
In summary, sinus fat invasion is the commonest locally invasive feature of RCC, followed by venous and perinephric fat infiltration. These features of Stage T3a RCC can be identified with a sensitivity of 59–88% and specificity of 71–93% on contrast-enhanced CT scans in the portal venous or nephrographic phase. Some secondary CT signs may assist staging. Perceived tumour necrosis, or an irregular or ill-defined tumour edge that is inseparable from the sinus structures or the perirenal fascia should alert the radiologist to the possibility of local invasion, especially in the presence of a centrally located renal mass, even if it is small.
REFERENCES
- 1.Ljungberg B, Cowan NC, Hanbury DC, Hora M, Kuczyk MA, Merseburger AS, et al. ; European Association of Urology Guideline Group. EAU guidelines on renal cell carcinoma: the 2010 update. Eur Urol 2010; 58: 398–406. doi: 10.1016/j.eururo.2010.06.032 [DOI] [PubMed] [Google Scholar]
- 2.Rogers CG. Expanding the indications of partial nephrectomy. Eur Urol 2011; 59: 938–9. doi: 10.1016/j.eururo.2011.02.041 [DOI] [PubMed] [Google Scholar]
- 3.Becker F, Roos FC, Janssen M, Brenner W, Hampel C, Siemer S, et al. Short-term functional oncologic outcomes nephron-sparing surgery renal tumours ≥ 7 cm. Eur Urol 2011; 59: 931–7. doi: 10.1016/j.eururo.2011.02.017 [DOI] [PubMed] [Google Scholar]
- 4.Kidney Edge SB, Byrd DR, Compton CC, Fritz AG, Greene FL, Trotti A, eds. AJCC cancer staging manual. 7th edn. New York, NY: Springer; 2010. pp. 479–89. [Google Scholar]
- 5.Lam JS, Klatte T, Patard JJ, Goel RH, Guillè F, Lobel B, et al. Prognostic relevance of tumour size in T3a renal cell carcinoma: a multicentre experience. Eur Urol 2007; 52: 155–62. [DOI] [PubMed] [Google Scholar]
- 6.Bertini R, Roscigno M, Freschi M, Strada E, Petralia G, Pasta A, et al. Renal sinus fat invasion in pT3a clear cell renal cell carcinoma affects outcomes of patients without nodal involvement or distant metastases. J Urol 2009; 181: 2027–32. doi: 10.1016/j.juro.2009.01.048 [DOI] [PubMed] [Google Scholar]
- 7.Siddiqui SA, Frank I, Leibovich BC, Cheville JC, Lohse CM, Zincke H, et al. Impact of tumour size on the predictive ability of the pT3a primary tumour classification for renal cell carcinoma. J Urol 2007; 177: 59–62. [DOI] [PubMed] [Google Scholar]
- 8.Thompson RH, Blute ML, Krambeck AE, Lohse CM, Magera JS, Leibovich BC, et al. Patients with pT1 renal cell carcinoma who die from disease after nephrectomy may have unrecognized renal sinus fat invasion. Am J Surg Pathol 2007; 31: 1089–93. [DOI] [PubMed] [Google Scholar]
- 9.Nadu A, Kleinmann N, Laufer M, Dotan Z, Winkler H, Ramon J. Laparoscopic partial nephrectomy for central tumours: analysis of perioperative outcomes and complications. J Urol 2009; 181: 42–7. doi: 10.1016/j.juro.2008.09.014 [DOI] [PubMed] [Google Scholar]
- 10.Johnson CD, Dunnick NR, Cohan RH, Illescas FF. Renal adenocarcinoma: CT staging of 100 tumours. AJR Am J Roentgenol 1987; 148: 59–63. [DOI] [PubMed] [Google Scholar]
- 11.Guzzo TJ, Pierorazio PM, Schaeffer EM, Fishman EK, Allaf ME. The accuracy of multidetector computerized tomography for evaluating tumour thrombus in patients with renal cell carcinoma. J Urol 2009; 181: 486–90. doi: 10.1016/j.juro.2008.10.040 [DOI] [PubMed] [Google Scholar]
- 12.Türkvatan A, Akdur PO, Altinel M, Olçer T, Turhan N, Cumhur T, et al. Preoperative staging of renal cell carcinoma with multidetector CT. Diagn Interv Radiol 2009; 15: 22–30. [PubMed] [Google Scholar]
- 13.Hallscheidt PJ, Bock M, Riedasch G, Zuna I, Schoenberg SO, Autschbach F, et al. Diagnostic accuracy of staging renal cell carcinomas using multidetector-row computerised tomography and magnetic resonance imaging: a prospective study with histopathologic correlation. J Comput Assist Tomogr 2004; 28: 333–9. [DOI] [PubMed] [Google Scholar]
- 14.Nazim SM, Ather MH, Hafeez K, Salam B. Accuracy of multidetector CT scans in staging of renal carcinoma. Int J Surg 2011; 9: 86–90. doi: 10.1016/j.ijsu.2010.07.304 [DOI] [PubMed] [Google Scholar]
- 15.Hallscheidt P, Wagener N, Gholipour F, Aghabozorgi N, Dreyhaupt J, Hohenfellner M, et al. Multislice computerised tomography in planning nephron-sparing surgery in a prospective study with 76 patients: comparison of radiological and histopathological findings in the infiltration of renal structures. J Comput Assist Tomogr 2006; 30: 869–74. [DOI] [PubMed] [Google Scholar]
- 16.Catalano C, Fraioli F, Laghi A, Napoli A, Pediconi F, Danti M, et al. High-resolution multidetector CT in the preoperative evaluation of patients with renal cell carcinoma. AJR Am J Roentgenol 2003; 180: 1271–7. [DOI] [PubMed] [Google Scholar]
- 17.Sheth S, Scatarige JC, Horton KM, Corl FM, Fishman EK. Current concepts in the diagnosis and management of renal cell carcinoma: role of multidetector CT and three-dimensional CT. Radiographics 2001; 21: S237–54. [DOI] [PubMed] [Google Scholar]
- 18.Zeman RK, Cronan JJ, Rosenfield AT, Lynch JH, Jaffe MH, Clark LR. Renal cell carcinoma: dynamic thin-section CT assessment of vascular invasion and tumour vascularity. Radiology 1988; 167: 393–6. [DOI] [PubMed] [Google Scholar]
- 19.Kutikov A, Uzzo RG. The R.E.N.A.L. nephrometry score: a comprehensive standardized system for quantitating renal tumor size, location and depth. J Urol 2009; 182: 844–53. doi: 10.1016/j.juro.2009.05.035 [DOI] [PubMed] [Google Scholar]
- 20.Thompson RH, Leibovich BC, Cheville JC, Webster WS, Lohse CM, Kwon ED, et al. Is renal sinus fat invasion the same as perinephric fat invasion for pT3a renal cell carcinoma?. J Urol 2005; 174: 1218–21. [DOI] [PubMed] [Google Scholar]
- 21.da Costa WH, Moniz RR, da Cunha IW, Fonseca FP, Guimaraes GC, de Cássio Zequi S. Impact of renal vein invasion and fat invasion in pT3a renal cell carcinoma. BJU Int 2012; 109: 544–8. doi: 10.1111/j.1464-410X.2011 [DOI] [PubMed] [Google Scholar]
- 22.Jeon HG, Jeong IG, Kwak C, Kim HH, Lee SE, Lee E. Reevaluation of renal cell carcinoma and perirenal fat invasion only. J Urol 2009; 182: 2137–43. doi: 10.1016/j.juro.2009.07.065 [DOI] [PubMed] [Google Scholar]
- 23.Poon SA, Gonzalez JR, Benson MC, McKiernan JM. Invasion of renal sinus fat is not an independent predictor of survival in pT3a renal cell carcinoma. BJU Int 2009; 103: 1622–5. doi: 10.1111/j.1464-410X.2008.08239.x [DOI] [PubMed] [Google Scholar]
- 24.Margulis V, Tamboli P, Matin SF, Meisner M, Swanson DA, Wood CG. Location of extra renal tumour extension does not impact survival of patients with pT3a renal cell carcinoma. J Urol 2007; 178: 1878–82. [DOI] [PubMed] [Google Scholar]
- 25.Bonsib SM. The renal sinus is the principal invasive pathway: a prospective study of 100 renal cell carcinomas. Am J Surg Pathol 2004; 28: 1594–600. [DOI] [PubMed] [Google Scholar]
- 26.Kopka L, Fischer U, Zoeller G, Schmidt C, Ringert RH, Grabbe E. Dual-phase helical CT of the kidney: value of the corticomedullary and nephrographic phase for evaluation of renal lesions and preoperative staging of renal cell carcinoma. AJR Am J Roentgenol 1997; 169: 1573–8. [DOI] [PubMed] [Google Scholar]
- 27.Liu Y, Song T, Huang Z, Zhang S, Li Y. The accuracy of multidetector computerised tomography for preoperative staging of renal cell carcinoma. Int Braz J Urol 2012; 38: 627–36. [DOI] [PubMed] [Google Scholar]
- 28.Karlo CA, Donati OF, Marigliano C, Tickoo SK, Hricak H, Russo P, et al. Role of CT in the assessment of muscular venous branch invasion in patients with renal cell carcinoma. AJR Am J Roentgenol 2013; 201: 847–52. doi: 10.2214/AJR.12.10496 [DOI] [PubMed] [Google Scholar]
- 29.Simmons MN. Morphometric characterization of kidney tumors. Curr Opin Urol 2011; 21: 99–103. doi: 10.1097/MOU.0b013e32834208d6 [DOI] [PubMed] [Google Scholar]


