Abstract
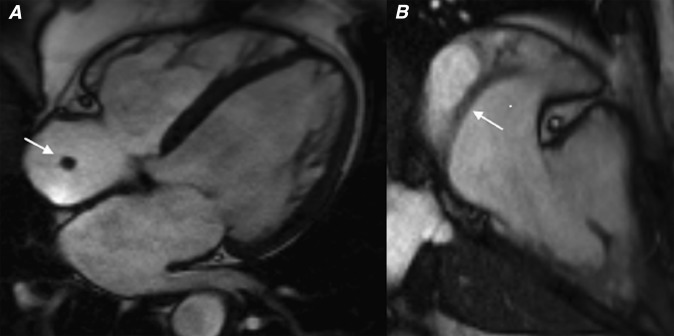
Cardiac myxomas are the most common benign primary cardiac tumour to present in adulthood. While most patients present with symptoms of cardiac obstruction, embolic phenomena or constitutional impairment, up to a fifth of patients remain asymptomatic and are incidentally diagnosed on imaging. Although echocardiography is usually the initial imaging modality used to evaluate these patients, cardiac MRI (CMR) has emerged over the past decade as the primary imaging modality in the assessment of patients with cardiac tumours. The superior tissue characterization capability of CMR means that it is able to determine the nature of some tumours pre-operatively and performs well in differentiating myxomas from thrombus. We present a pictorial review highlighting the key CMR features of myxomas and show how these lesions can be differentiated from thrombus and other cardiac masses.
Primary cardiac tumours are uncommon with a reported prevalence at autopsy of 0.002%.1 The majority are benign, with myxomas accounting for almost 50% of all primary cardiac tumours.2 Myxomas are more common in female patients, and while they can occur at any age, they usually present in adults between the fourth and seventh decades of life.3,4 Most patients typically present with at least one manifestation of the classic triad of cardiac obstructive symptoms, embolic phenomena and constitutional symptoms, but 20% are identified in asymptomatic patients as an incidental imaging finding.3
Echocardiography is usually the initial imaging modality used in the assessment of a suspected cardiac mass but remains rather operator dependent with a restricted field of view and can be particularly challenging in patients with large body habitus.2,4,5 Cardiac MRI (CMR) enables accurate assessment of the location and functional impact of cardiac masses in any imaging plane without exposing patients to ionizing radiation.2,5 In particular, CMR performs better than echocardiography at determining the nature of cardiac lesions and can differentiate myxomas from thrombus.2,5 Given that most cardiac lesions are not easily amenable to catheter-directed biopsy, accurate imaging differentiation of cardiac myxomas from other types of cardiac masses is of vital importance in guiding further management.
PATHOLOGY AND CLINICAL PRESENTATION
Myxomas arise from pluripotent mesenchymal cells within the endocardium.3 75–80% of myxomas arise in the left atrium, 15–20% arise in the right atrium and 5% are ventricular or multifocal.3 Macroscopically, most are polypoidal with smooth lobulated contours.3,6 The less common villous type of myxoma demonstrates friable frond-like contours, which have a greater propensity for fragmentation and subsequent embolization.3,6,7 Microscopically, myxomas are extremely heterogeneous and usually consist of a polysaccharide-rich myxoid matrix, with some areas of haemorrhage, haemosiderin and fibrosis.3,6 Both microscopic and macroscopic calcification may be seen in up to 10% of cases, particularly in myxomas located in the right atrium.3,6 The heterogeneous nature and variation in tissue types seen in individual myxomas explains why the imaging appearances of these lesions can be variable.2,3,6
Left atrial myxomas usually present with symptoms of intermittent mitral valve obstruction, including dyspnoea and orthopnoea related to pulmonary oedema.8 Although patients with right atrial myxomas are more likely to be asymptomatic, these lesions may obstruct the tricuspid valve causing symptoms of right-sided cardiac dysfunction.3,8 Ventricular-based lesions can obstruct the outflow tract of either ventricle resulting in syncope or even sudden cardiac death.8 Embolic phenomena are seen in 35% of left-sided and 10% of right-sided myxomas.3,9,10 Left-sided myxomas embolize systemically to the cerebral circulation, kidneys and lower extremities, whereas right-sided myxomas embolize to the pulmonary circulation.3,10 Constitutional symptoms are common regardless of the site of the lesion and include fever, lethargy and anaemia.3,8
While myxomas usually arise sporadically, up to 7% may demonstrate familial predilection or association with Carney's complex, an autosomal dominant multiple neoplasia syndrome consisting neural, cardiac, endocrine and cutaneous tumours along with pigmented lesions of the mucosa and skin.3 Myxomas presenting as part of Carney's complex are more likely to occur in male patients, at younger ages, arise in atypical sites such as the ventricles, be multifocal and have a greater incidence of recurrence following surgical resection.3,6
CARDIAC MRI PROTOCOL AND APPEARANCES
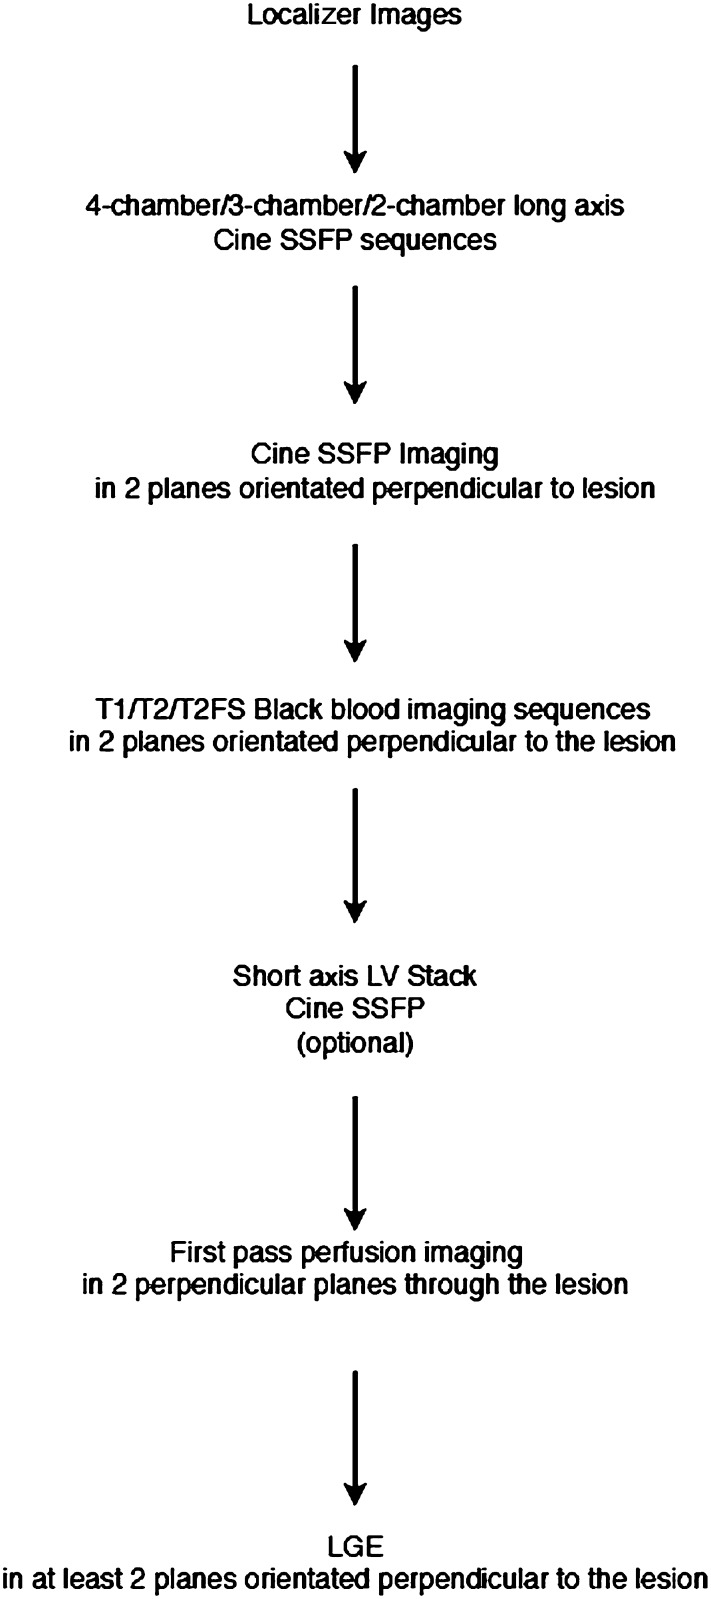
A standard CMR imaging protocol used to image patients with suspected cardiac myxomas is shown in Figure 1. It is important to recognize that myxomas show significant variation in appearance and location. As a result, standardized CMR protocols should be adapted to the individual lesion to ensure that the optimal CMR imaging planes and sequences are acquired. This approach improves differentiation of myxomas from other cardiac masses and has the potential to shorten the overall duration of the study.2
Figure 1.
Schematic showing typical cardiac MRI protocol used for patients being assessed for cardiac myxomas. FS, fat saturated; LGE, late gadolinium enhancement; LV, left ventricle; SSFP, steady-state free procession.
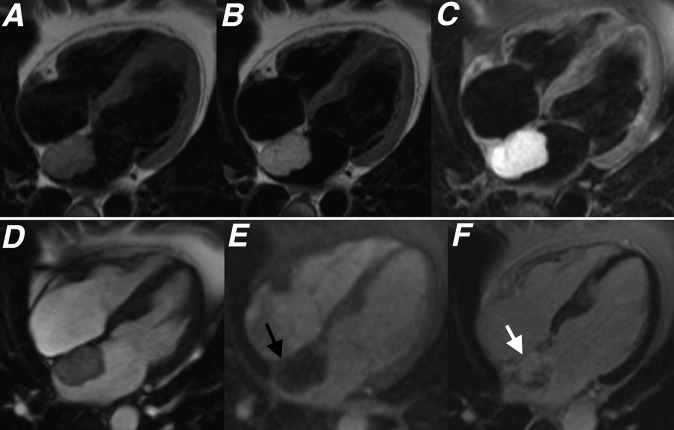
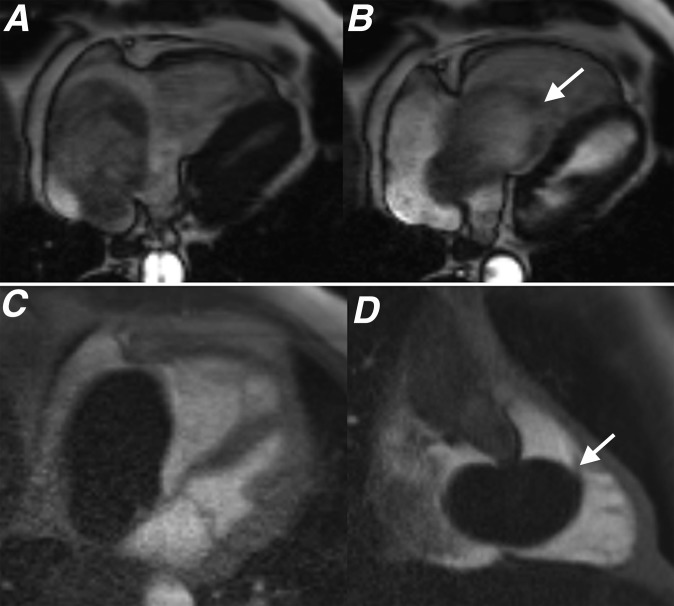
Myxomas usually appear as well-defined, smooth, oval or lobular lesions that are commonly pedunculated. Atrial myxomas often have a narrow attachment close to the fossa ovalis (Figures 2 and 3).2,3 Steady-state free procession (SSFP) cine imaging sequences, acquired in standard cardiac imaging planes, provide an accurate assessment of the location, attachment site and functional impact of myxomas. On cine SSFP sequences, myxomas typically appear hyperintense compared with normal myocardium and hypointense compared with the blood pool (Figures 2 and 3).2,3,6 Cine SSFP imaging is of particular value in the functional assessment of atrial myxomas, as lesions here can be highly mobile and prolapse through the atrioventricular valves during diastole, causing temporary obstruction to blood flow (Figure 4).2,4 Myxomas that extend to involve both atria have been reported, and these typically result from tumour growth across a patent fossa ovalis.6
Figure 2.
(a) T1 weighted, (b) T2 weighted, (c) T2 weighted with fat saturation, (d) cine steady-state free procession, (e) first pass perfusion and (f) late gadolinium enhancement four-chamber sequences showing the typical appearance of a left atrial myxoma (black and white arrows). A diagnosis of cardiac myxoma was histologically confirmed following excision.
Figure 3.

(a) Cine steady-state free procession, (b) first pass perfusion and (c) late gadolinium enhancement (LGE) four-chamber sequences showing a left atrial myxoma. Note how the lesion shows limited enhancement on first pass perfusion sequences (black arrow) and heterogeneous enhancement on LGE sequences (white arrow).
Figure 4.
(a) Four-chamber steady-state free procession (SSFP) during systole, (b) four-chamber SSFP during diastole, (c) four-chamber first pass perfusion and (d) two-chamber right ventricle long axis first pass perfusion sequences showing a right atrial myxoma. The lesion shows no enhancement on first pass perfusion, which is an imaging feature demonstrated by some myxomas. Also note how the lesion prolapses through the tricuspid valve during diastole (white arrows). Following excision, this lesion demonstrated the typical histological features of a cardiac myxoma with a predominant myxoid tissue composition.
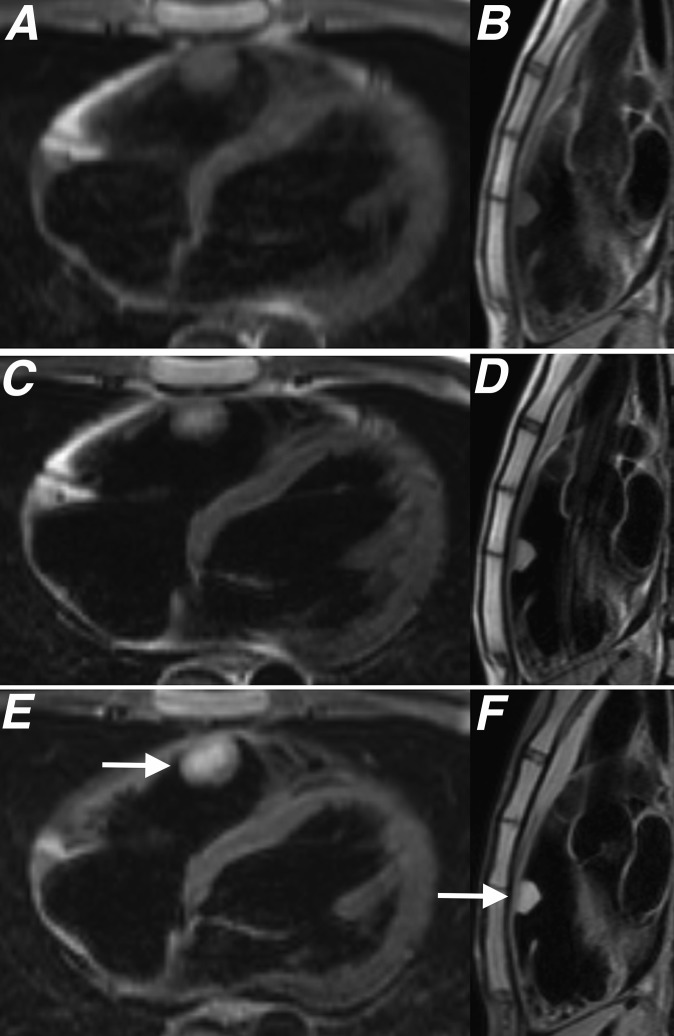
T1 and T2 weighted double inversion recovery fast spin echo sequences that null the blood pool in relation to the myocardium (“black blood”) along with black blood fat-saturated T2 weighted sequences are able to provide some tissue characterization of myxomas (Figure 5).2,4,5 Although there is significant variation in signal characteristics, the majority of myxomas will return intermediate signal on T1 weighted sequences and high signal intensity on T2 and fat-saturated T2 weighted sequences (Figures 2 and 5).3,4 The different composition of myxoid tissue, fibrous tissue, blood and haemorrhagic breakdown products contained within myxomas result in significant variability of the signal characteristics exhibited by these lesions on CMR.3,6 Fluoroscopically visible calcification may be seen in up to 10% of all myxomas and is most commonly identified in lesions located in the right atrium.3 These areas of calcification may also contribute to sites of low T1 and T2 signals seen within some myxomas.3
Figure 5.
(a, b) T1 weighted, (c, d) T2 weighted and (e, f) T2 fat-saturated sequences acquired in two planes orientated perpendicular to a myxoma (white arrows) located in the right ventricular outflow tract. Histological assessment of this lesion after surgical excision showed the lesion to be composed of spindled and stellate cells in a myxoid matrix with associated haemosiderin typical for a cardiac myxoma.
While myxomas may show some mild heterogeneous enhancement on first pass perfusion studies performed at rest immediately following contrast agent administration, these lesions often show more heterogeneous enhancement on late gadolinium enhancement (LGE) sequences, performed 10–15 min after gadolinium contrast administration (Figures 2 and 3).2,4,6 Areas of enhancement within myxomas have been shown to correspond with regions rich with myxomatous tissue and focal inflammation, whereas sites that demonstrate no enhancement correlate with areas of necrosis (Figures 2 and 3).2,3
DIFFERENTIAL DIAGNOSIS
Thrombus represents the principle differential diagnosis for myxomas.7 Intracardiac thrombi are most commonly located in the left atrial appendage in association with atrial fibrillation or mitral valve disease.2,8 Thrombus may also be seen within the left ventricle in patients with severe left ventricular dysfunction following myocardial infarction or within the right atrium in patients with an indwelling central venous catheter.2,8 The age of the thrombus determines its CMR signal characteristics. Acute thrombus, predominantly containing oxyhaemoglobin, returns intermediate signal on T1 and T2 weighted sequences.2,4,6 As the thrombus becomes more organized, the water content diminishes and the methaemoglobin-rich cellular debris is replaced by fibrous tissue.2 As a result, unlike myxomas, chronic thrombi characteristically return uniformly low signal on T1 and T2 weighted sequences.
Contrast-enhanced sequences (first pass perfusion and LGE) are important in distinguishing myxomas from thrombus. Thrombi are avascular masses and therefore do not typically enhance on first pass perfusion sequences (Figure 6).2,6 On rare occasions, highly organized and very chronic thrombi may show faint peripheral enhancement.2 Additional LGEs through the lesion performed at longer inversion times of 550–650 ms can be invaluable.5 Owing to their characteristically long inversion time, thrombi will appear dark on these sequences, whereas myxomas, with a typical inversion time of between 200–300 ms, will not.5
Figure 6.

(a) Parasagittal cine steady-state free procession, (b) parasagittal first pass perfusion and (c) parasagittal late gadolinium enhancement (LGE) sequences through the left atrium showing two separate left atrial thrombi (white and black arrows). Note how these thrombi show no enhancement on first pass perfusion or LGE sequences (black arrow).
Although myxomas tend to be more mobile, have a narrower base of attachment to the wall of the cardiac chamber and arise at different locations, there is considerable overlap of these features between thrombus and myxoma.6,7 Prolapse through the atrioventricular valve is a common feature of myxomas but not of thrombi.2,4,6 Table 1 summarizes the key differences in CMR appearances between myxomas and thrombi.
Table 1.
Cardiac MRI features differentiating myxoma from thrombus
| Features | Myxoma | Thrombus |
|---|---|---|
| Location | Left atrium commonly at fossa ovalis | Left atrium commonly at left atrial appendage or left ventricle in association with infarct |
| Attachment | Narrow often pedunculated | Broad based |
| Mobility | Very mobile | Less mobile |
| Functional impact | Prolapse of lesion through atrioventricular valve | Left ventricular functional impairment common; prolapse through valve not evident |
| T1 signal | Heterogeneous intermediate T1 signal | Homogeneous hypointense T1 signala |
| T2 signal | Heterogeneous hyperintense T2 signal | Homogeneous hypointense T2 signala |
| Gadolinium enhancement | Heterogeneous pattern of enhancement common | Enhancement extremely uncommon unless very organized with high level of fibrous tissue |
| Inversion time on late gadolinium sequences | 200–300 ms | 550–650 ms |
Thrombus signal return is dependent on whether the thrombus is acute, subacute or chronic. Signal characteristics described in the table are those demonstrated by chronic thrombus.
Another important lesion to differentiate from myxomas is papillary fibroelastoma. These lesions arise from the endocardium and are composed of collagen and elastic fibres with an endothelial cap and a connective tissue pedicle.7 Although these lesions are highly mobile, they are usually smaller than myxomas and are typically seen arising from the valvular endocardium.2,7 In addition, fibroelastomas return homogenously low T1 signal and high T2 signal and demonstrate uniform enhancement unlike the typically heterogeneous pattern seen with myxomas (Figure 7).2,7
Figure 7.
(a) Cine steady-state free procession (SSFP), (b) T1 weighted, (c) T2 weighted with fat saturation and (d) late gadolinium enhancement (LGE) sequences showing a small lesion with a thin attachment to the tricuspid valve leaflets (black arrow). This lesion was very mobile on cine SSFP sequences and the relatively homogenous increased signal seen on the LGE sequences suggest focal gadolinium accumulation. These appearances are typical for a fibroelastoma.
Normal intracardiac structures and embryological remnants can sometimes be mistaken for atrial myxomas. The crista terminalis, the muscular ridge originating at the junction of the superior vena cava and right atrium, which separates the smooth and trabeculated muscle fibres of the right atrium, can show significant variation in size and appearance and its presence should not be confused with myxomas or thrombi (Figure 8).2,7 Similarly, the Eustachian valve, right ventricular moderator band and false left ventricular tendons are other normal cardiac structures that can potentially be confused with myxomas on echocardiography but are more easily differentiated on CMR.2
Figure 8.
(a) Four-chamber cine steady-state free procession (SSFP) and (b) parasagittal cine SSFP showing typical appearances of a prominent rather tubular crista terminalis.
CONCLUSION
Myxomas are the most common benign cardiac tumour presenting in adulthood and demonstrate characteristic appearances on CMR. An understanding of how CMR can be used to differentiate myxomas from thrombus and other cardiac masses is vital in guiding the further management of these patients.
REFERENCES
- 1.Lam KY, Dickens P, Chan AC. Tumors of the heart. A 20-year experience with a review of 12,485 consecutive autopsies. Arch Pathol Lab Med 1993; 117: 1027–31. [PubMed] [Google Scholar]
- 2.Motwani M, Kidambi A, Herzog BA, Uddin A, Greenwood JP, Plein S. MR imaging of cardiac tumors and masses: a review of methods and clinical applications. Radiology 2013; 268: 26–43. doi: 10.1148/radiol.13121239 [DOI] [PubMed] [Google Scholar]
- 3.Grebenc ML, Rosado-de-Christenson ML, Green CE, Burke AP, Galvin JR. Cardiac myxoma: imaging features in 83 patients. Radiographics 2002; 22: 673–89. [DOI] [PubMed] [Google Scholar]
- 4.O'Donnell DH, Abbara S, Chaithiraphan V, Yared K, Killeen RP, Cury RC, et al. Cardiac tumors: optimal cardiac MR sequences and spectrum of imaging appearances. AJR Am J Roentgenol 2009; 193: 377–87. doi: 10.2214/AJR.08.1895 [DOI] [PubMed] [Google Scholar]
- 5.Buckley O, Mada R, Kwong R, Rybicki FJ, Hunsaker A. Cardiac masses, part 1: imaging strategies and technical considerations. AJR Am J Roentgenol 2013; 197: W837–41. doi: 10.2214/AJR.10.7260 [DOI] [PMC free article] [PubMed] [Google Scholar]
- 6.Sparrow PJ, Kurian JB, Jones TR, Sivananthan MU. MR imaging of cardiac tumors. Radiographics 2005; 25: 1255–76. [DOI] [PubMed] [Google Scholar]
- 7.Hoey ET, Mankad K, Puppala S, Gopalan D, Sivananthan MU. MRI and CT appearances of cardiac tumours in adults. Clin Radiol 2009; 64: 1214–30. doi: 10.1016/j.crad.2009.09.002 [DOI] [PubMed] [Google Scholar]
- 8.Burke A, Jeudy J, Jr, Virmani R. Cardiac tumours: an update. Heart 2008; 94: 117–23. [DOI] [PubMed] [Google Scholar]
- 9.Bjessmo S, Ivert T. Cardiac myxoma: 40-years experience in 63 patients. Ann Thorac Surg 1997; 63: 697–700. [DOI] [PubMed] [Google Scholar]
- 10.Pinede L, Duhaut P, Loire R. Clinical presentation of left atrial cardiac myxoma. A series of 112 consecutive cases. Medicine (Baltimore) 2001; 80: 159–72. [DOI] [PubMed] [Google Scholar]


