Abstract
Nutrient runoff from the Everglades Agricultural Area resulted in a well-documented gradient of phosphorus concentrations in soil and water, with concomitant ecosystem-level changes, in the northern Florida Everglades. It was recently reported that sulfate-reducing prokaryote assemblage composition, numbers, and activities are dependent on position along the gradient (H. Castro, K. R. Reddy, and A. Ogram, Appl. Environ. Microbiol. 68:6129-6137, 2002). The present study utilized a combination of culture- and non-culture-based approaches to study differences in composition of assemblages of syntrophic and methanogenic microbial communities in eutrophic, transition, and oligotrophic areas along the phosphorus gradient. Methanogenesis rates were much higher in eutrophic and transition regions, and sequence analysis of 16S rRNA gene clone libraries constructed from samples taken from these regions revealed differences in composition and activities of syntroph-methanogen consortia. Methanogens from eutrophic and transition regions were almost exclusively composed of hydrogenotrophic methanogens, with approximately 10,000-fold-greater most probable numbers of hydrogenotrophs than of acetotrophs. Most cultivable strains from eutrophic and transition regions clustered within novel lineages. In non-culture-based studies to enrich syntrophs, most bacterial and archaeal clones were either members of novel lineages or closely related to uncultivated environmental clones. Novel cultivable Methanosaeta sp. and fatty acid-oxidizing bacteria related to the genera Syntrophomonas and Syntrophobacter were observed in microcosms containing soil from eutrophic regions, and different lines of evidence indicated the existence of novel syntrophic association in eutrophic regions.
Wetlands account for approximately 20% of annual global methane emissions of 500 Tg (1012 g) (5). Many wetlands receive allochthonous inputs of organic matter, nutrients, metals, and various toxic compounds from adjacent agricultural and industrial areas. Nutrient impacts on wetlands are of prime concern due to numerous problems associated with eutrophication, including effects on species diversity and ecosystem functioning (4, 29-31). The Florida Everglades is the largest freshwater subtropical wetland in North America and is believed to have developed from organic matter accumulation in a low-nutrient environment within a limestone depression (11). Everglades Water Conservation Area 2-A (WCA-2A) of the northern Everglades encompasses 210 mi2 and has received agricultural drainage for more than 35 years. Approximately 58% of the inflow water entering WCA-2A originates from the Everglades Agricultural Area. Canal inflow waters contain high concentrations of nitrogen and phosphorus (P) resulting from oxidation of organic peat soils within the Everglades Agricultural Area. As a result, the marshes along the northern and southwestern boundaries are highly enriched in P. P enrichment in soils and surface waters in the Everglades has led to a variety of ecosystem-level changes, including shifts in plant community composition, increased peat accumulation, and alterations in rates of biogeochemical cycling (9, 26, 29-31).
Terminal electron acceptors such as O2, NO3−, Fe(III), and Mn(IV) are rapidly depleted in Everglades soils, such that they do not play a significant role in mineralization of organic matter (8, 21). Many previous studies of this marsh focused on the biogeochemistry of elemental cycling and on processes such as methanogenesis and microbial respiration (26, 29-31), but few studies have focused on the effects of eutrophication on the structure and function of microbial assemblages that are responsible for these processes. Studies of the Florida Everglades and other wetlands have linked methane (CH4) production to water table depth and soil moisture, temperature, and pH fluctuations (2, 9, 10, 17, 19, 29-31), but analysis of microbial composition based on analysis of 16S rRNA gene sequences and differences at the organism level leading to methanogenesis in eutrophic regions of the Everglades remains largely undone.
Methanogenesis can be viewed as the end of a complex series of trophic interactions in which several groups of bacteria work together to oxidize organic carbon, leading to the production of methane. Hydrogen-utilizing fatty acid-oxidizing bacteria, frequently referred to as syntrophs, are secondary fermenters that work in concert with methanogens to oxidize fermentation products such as propionate and butyrate that cannot be utilized directly by methanogens (7, 22) and therefore play an important role in decomposition of organic matter under methanogenic conditions. Syntrophs require low H2 concentrations to ferment these substrates to CO2, and hydrogenotrophic methanogens are responsible for maintaining low H2 concentrations. In our attempt to characterize the flow of carbon in the Florida Everglades soil, preliminary results indicated that propionate, butyrate, and acetate accumulated to detectable quantities when eutrophic soils were spiked with glucose or cellulose, suggesting that carbon may be funneled through these fatty acids (I. Uz, A. Ogram, and K. R. Reddy, Abstr. 103rd Gen. Meet. Am. Soc. Microbiol., abstr. N-080, 2003). Most work to date on the ecology of syntrophic-methanogenic consortia has been conducted in wastewater treatment systems, and little is known of the ecology of these important consortia in freshwater marshes or of the impact of eutrophication on these consortia.
The objective of this study was to characterize syntrophic-methanogenic structure-function relationships along nutrient gradients in WCA-2A by a combination of culture-independent and -dependent methods. To the best of our knowledge, this is the first investigation of the relationship between syntrophs and methanogens in eutrophic and oligotrophic areas of a natural wetland.
MATERIALS AND METHODS
Site description and sampling procedures.
Soil samples were collected from three sites in spring 2002 along the P gradient in the northern Florida Everglades (4, 9, 29-31) within WCA-2A under flooded (0.2- to 0.3-m) conditions. A map showing sampling locations was previously published (4). Samples were collected from F1 (eutrophic; cattail [Typha domingensis Pers.] dominated) and U3 (oligotrophic; sawgrass [Cladium jamaicense Crantz] dominated) regions and the transition region, F4 (cattail-sawgrass mix) (4, 9). At each sampling station, three soil cores were obtained within an area of approximately 25 m2 and to a depth of 20 cm. Soil samples were collected after removal of the upper 7 to 8 cm of floc to minimize inclusion of the major O2 interface regions. Cores were stored on ice and transported to the laboratories in Gainesville, where cores were sectioned from 0- to 10-cm substrata of soil, which were used in this study. This section of soil depth represents nutrient impacts for longer than 3 years, as indicated by peat accretion rates calculated from 137Cs distribution (21). Replicate samples were manually mixed to create a single composite sample from each of the three cores from each site, followed by removal of roots and plant matter. Subsamples for DNA analysis were frozen at −70°C until analyzed. Samples intended for enumeration and measurement of rates were kept at 4°C until analysis, which was within a week after sampling. Subsamples were dried to a constant weight in a forced draft oven overnight at 60°C for determination of moisture content. Total phosphorus, total inorganic phosphorus, ammonium, total Kjeldahl nitrogen, extractable total organic carbon, and microbial biomass carbon were determined as described previously (4, 30). In brief, total N analysis was performed on dried, finely ground (<0.2-mm) samples with a Carlo-Erba NA-1500 CNS analyzer (Carlo Erba, Milan, Italy). Total P analysis was performed on separate samples following combustion (ashing) at 550°C for 4 h in a muffle furnace and dissolution of the ash in 6 M HCl. The digestate was analyzed for P by an automated ascorbic acid method (method 365.4, U.S. Environmental Protection Agency, 1983). Microbial biomass carbon was analyzed using the chloroform fumigation-extraction technique modified for wet organic soils (8). The total organic C (soluble organic C) was analyzed in a Dohrmann DC-109 total organic C analyzer (Rosemount Analytical Inc., Santa Clara, Calif.). Microbial biomass C was calculated from the difference in K2SO4-extractable C between fumigated and nonfumigated samples as explained earlier (8).
Enumerations of syntrophic bacteria and methanogens.
Most probable numbers (MPN) of propionate- and butyrate-oxidizing bacteria and acetotrophic-hydrogenotrophic methanogens were determined with a three-tube dilution with basal carbonate-yeast extract-Trypticase (BCYT) medium (24). A hydrogen scavenger is required to estimate numbers of syntrophic bacteria in soil samples (13, 20); therefore, each tube was amended with Methanospirillum hungatei JF-1, and positive tubes were scored after 2 months of incubation on the basis of twice the amount of methane being produced as that in negative control tubes. Negative controls contained similar media, including BCYT, as those for experimental replicates but lacked an exogenous organic carbon donor(s). Therefore, any fermentative contributions from yeast extract and Trypticase components of BCYT medium were ruled out in the estimation of anaerobic carbon-utilizing consortia.
Laboratory microcosm studies and growth conditions.
Rates of potential methane production were studied in selected samples, which represented contrasting field conditions. Each 100-ml serum bottle contained 50 ml of BCYT medium and 0.1% resazurin. Soil samples (1 to 5%, wet weight), which were collected after removal of the upper 7 to 8 cm of floc to minimize inclusion of the major O2 interface regions, were introduced into the medium under a constant stream of N2 with minimal exposure to air and immediately crimped using butyl rubber septa and aluminum seals (Bellco Glass Inc., Vineland, N.J.). These vials were spiked with 20 mM (each) propionate, butyrate, acetate, or formate from anaerobically prepared stock solutions. Cysteine-sodium sulfide (2%) was added by nitrogen-flushed syringe to reduce the medium to a final redox potential of approximately −110 to −200 mV, simulating environmental conditions conducive for methanogenesis (17, 21). All incubations were carried out at 30°C in the dark. Subsequent transfers were made in BCYT or BCT (basal carbonate-Trypticase without yeast extract to discourage background growth of primary fermenters) medium according to standard anaerobic culturing techniques. For H2-CO2 enrichments, the headspace was purged with 80:20 (vol/vol) H2-CO2 gas at 150 kPa and either shaken at 120 rpm or kept horizontally in incubators to allow maximum diffusion of H2 into the medium.
Microscopic analyses and analytical methods.
For differential interference contrast (DIC), cells were plated onto glass slides; coverslips were placed and observed in a microscope viewing chamber. Consortia were then imaged with a short distance condenser and 100× objective in a Nikon Optiphot biological microscope. Fatty acids and end products of syntrophy were quantified by a high-pressure liquid chromatograph (Waters Corp., Milford, Mass.) equipped with a UV detector set at 210 nm and an Aminex HP 87 H column (300 by 7.5 mm). Sulfuric acid (5 mM) with a flow rate of 0.6 ml/min was used as the mobile phase. Methane in the headspace was measured by gas chromatography with a Shimadzu 8A gas chromatograph as described previously (4). All determinations were carried out in triplicate, and average values with 1 standard deviation are reported.
Nucleic acid extraction and PCR amplification.
DNA was extracted from either soil samples (1 g) or microcosms (10 to 15 ml after 2 to 4 weeks of incubation) and pelleted. The Ultra Clean Soil DNA kit (MoBio, Solana Beach, Calif.) was employed for genomic DNA isolation with minor modifications. The pellet was dissolved in the kit's bead solution, and all reagents were doubled for each extraction. DNA was eluted from the spin column by being washed with Tris-EDTA buffer and routinely analyzed on a 0.7 to 1% agarose gel electrophoresis with Tris-acetate-EDTA buffer. The primers used for the PCR amplification of 16S rRNA gene sequences were 27F (5′-AGAGTTTGATCMTGGCTCAG-3′) and 1492R (5′-TACGGYTACCTTGTTACGACTT-3′) (18). Archaeal 16S rRNA genes were amplified with the universal primer 1492R and Archaea-specific primer 23F (5′-TGCAGAYCTGGTYGATYCTGCC-3′) (3). PCR amplification was performed in a GeneAmp PCR system 2400 (Perkin-Elmer Applied Biosystems, Norwalk, Conn.) with HotStarTaq Master Mix (Qiagen, Valencia, Calif.) as reported earlier (25).
Cloning of bacterial and archaeal genes and RFLP analyses.
Fresh PCR amplicons obtained with archaeal and bacterial primers were ligated into pCRII-TOPO cloning vector and were transformed into chemically competent Escherichia coli TOP10F′ cells according to the manufacturer's instructions (Invitrogen, Carlsbad, Calif.). Individual colonies of E. coli were screened by direct PCR amplification, with the appropriate primers according to the previously described PCR program (25). Restriction fragment length polymorphism (RFLP) analyses were conducted using HhaI and AluI in separate reactions, and reaction mixtures were analyzed in a 2% agarose gel. Clone libraries were analyzed by analytic rarefaction with the software aRarefactWin (version 1.3; S. Holland, Stratigraphy Lab, University of Georgia, Athens [http://www.uga.edu/∼strata/software/]) to confirm that sufficient numbers of RFLP groups were selected to represent the clone libraries from soil and microcosms.
DNA sequencing and sequence analysis.
Selected unique and common clones after comparison by RFLP were sequenced at the DNA Sequencing Core Laboratory at the University of Florida with 27F and 23F primers. Phylogenetic analysis and chimera detection were initially carried out with the RDP-II database (6). Sequences were then compared with previously identified sequences in the National Center for Biotechnology Information database with BLAST (1), and sequences were aligned by ClustalX version 1.8 (23, 25). Phylogenetic trees were generated with PAUP version 4.0b8 using maximum parsimony algorithm with default settings (D. L. Swofford, Sinauer Associates, Sunderland, Mass.). Bootstrap resampling analysis for 100 replicates was performed to estimate the confidence of tree topologies.
Nucleotide sequence accession numbers.
The partial 16S rRNA gene sequences obtained in this study have been deposited in GenBank under accession numbers AY422329 through AY422354.
RESULTS
Physical and chemical characteristics of soils.
Table 1 presents physical and chemical data during spring 2002, when soil samples were collected for this study. Moisture content and nitrogen parameters were similar in the eutrophic (F1), transition (F4), and oligotrophic (U3) regions of WCA-2A. Soil redox potentials were maintained due to waterlogged conditions of up to 0.2 to 0.3 m of water (data not shown). These are within the reported theoretical zones of CO2 reduction, which are typically between −100 and −200 mV (9, 21, 22). Samples taken from F1 and F4 exhibited higher total phosphorus and total inorganic phosphorus concentrations than those observed in U3. Concentrations of total carbon, extractable organic carbon, and microbial biomass carbon were higher in F1 and F4 than in U3, which is in agreement with earlier reports (4, 29-31).
TABLE 1.
Selected biogeochemical characteristics of eutrophic (F1), transition (F4), and oligotrophic (U3) regions of WCA-2A during spring 2002a
| Field station | Moisture content (%) | TN (g/kg) | TC (g/kg) | TP (mg/kg) | TPi (mg/kg) | NH4-N (mg/kg) | TKN (mg/kg) | MBC (mg/kg) | Extractable TOC (mg/kg) |
|---|---|---|---|---|---|---|---|---|---|
| F1 | 92 (1.0) | 28.8 (2.1) | 445.8 (24) | 1,110 (352) | 366 (128) | 90 (13) | 463 (44) | 7,705 (1,534) | 2,404 (204) |
| F4 | 93 (1.0) | 25.3 (2.6) | 357.2 (10) | 767 (49) | 310 (72) | 107 (16) | 582 (46) | 8,933 (1,529) | 2,436 (284) |
| U3 | 93 (2.0) | 32.8 (2.8) | 230 (42) | 449 (161) | 221 (131) | 103 (33) | 548 (120) | 2,627 (128) | 1,973 (450) |
Values in parentheses are standard deviations of triplicate analyses. The content of different substances is expressed per kilogram (dry weight) of soil. TN, total nitrogen; TC, total carbon; TP, total phosphorus; TPi, total inorganic phosphorus; NH4-N, extractable ammonium; TKN, total Kjeldahl nitrogen; MBC, microbial biomass carbon; TOC, total organic carbon.
Bacterial and methanogen enumerations in soil.
MPN analyses (Table 2) of methanogens and their syntrophic partners in F1, F4, and U3 indicated several orders of magnitude more methanogens in F1 and F4 soils than in U3 soils. Hydrogenotrophs outnumbered acetotrophs by over 3 orders of magnitude in F1 and by almost 2 orders of magnitude in F4 and U3. Propionate- and butyrate-utilizing syntrophs were significantly higher in F1 than U3, with a greater number of propionate oxidizers observed than butyrate oxidizers.
TABLE 2.
MPN enumerations of syntrophic and methanogenic communities in impacted (F1), transition (F4), and nonimpacted (U3) regions from WCA-2A of Everglades marsh
| Sampling station in WCA-2A | Enumerationa (MPN · g−1)
|
|||
|---|---|---|---|---|
| Acetate-utilizing methanogens | H2-CO2 utilizing methanogens | Propionate-oxidizing syntrophic bacteria | Butyrate-oxidizing syntrophic bacteria | |
| F1 (eutrophic) | 0.094 × 10⁵ (0.005, 0.3) | 10.99 × 10⁶ (2.2, 30.75) | 4.63 × 10⁶ (1.1, 14.98) | 4.63 × 10⁵ (1.1, 14.98) |
| F4 (transition) | 0.94 × 10⁵ (0.2, 2.7) | 4.63 × 10⁶ (1.1, 14.98) | 4.63 × 10⁶ (1.1, 14.98) | 4.63 × 10⁵ (1.1, 14.98) |
| U3 (oligotrophic) | 0.1099 × 10⁵ (0.007, 0.33) | 0.94 × 10⁶ (0.2, 2.7) | 0.15 × 10⁶ (0.019, 0.63) | 0.29 × 10⁵ (0.07, 1) |
All values are expressed in units of MPN per gram (wet weight) of 0- to 10-cm soil and are the averages of three replicates. Lower and upper limits in parentheses reflect 95% confidence intervals.
Methanogenesis from fatty acids.
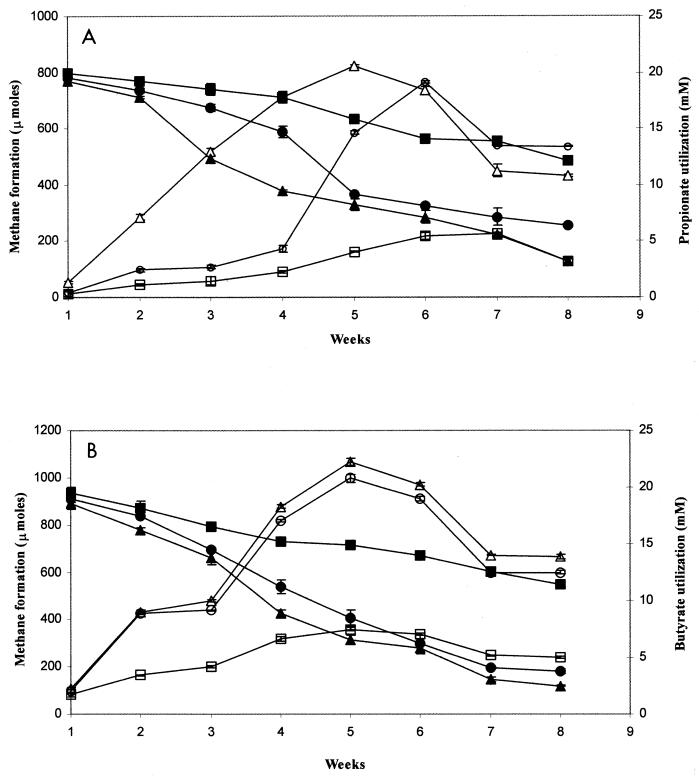
Methanogenesis from propionate and butyrate was monitored in triplicate microcosms constructed from soil taken from F1, F4, and U3 (Fig. 1). Methanogenesis from propionate and butyrate requires secondary fermentation to acetate by syntrophs, coupled with interspecies H2 transfer to hydrogenotrophic methanogens (7, 22). Depletion of propionate (Fig. 1A) or butyrate (Fig. 1B) corresponded with accumulation of CH4, indicating that elevated methanogenesis in F1 and F4 was the result of utilization of spiked fatty acids by syntrophic bacteria and not of endogenous carbon. The rate of propionate- and butyrate-induced methanogenesis in F1 was significantly higher than that observed in F4, which was higher than that observed in U3. Basal levels of methanogenesis exhibited by U3 microcosms may be attributed to low concentrations of total extractable carbon (Table 1) (4). As a consequence of this difference between eutrophic and oligotrophic regions, a low degree of in situ enrichment of syntrophic-methanogenic associations might be reflected in decreased methanogenesis rates.
FIG. 1.
Quantification of weekly depletion of 20 mM spiked fatty acids (filled symbols) in WCA-2A soils leading to formation of methane (open symbols). (A) Propionate; (B) butyrate. Symbols: triangles, F1 (eutrophic); circles, F4 (transition); squares, U3 (oligotrophic). Analyses were conducted in triplicate, and mean values are presented; error bars represent ±1 standard deviation.
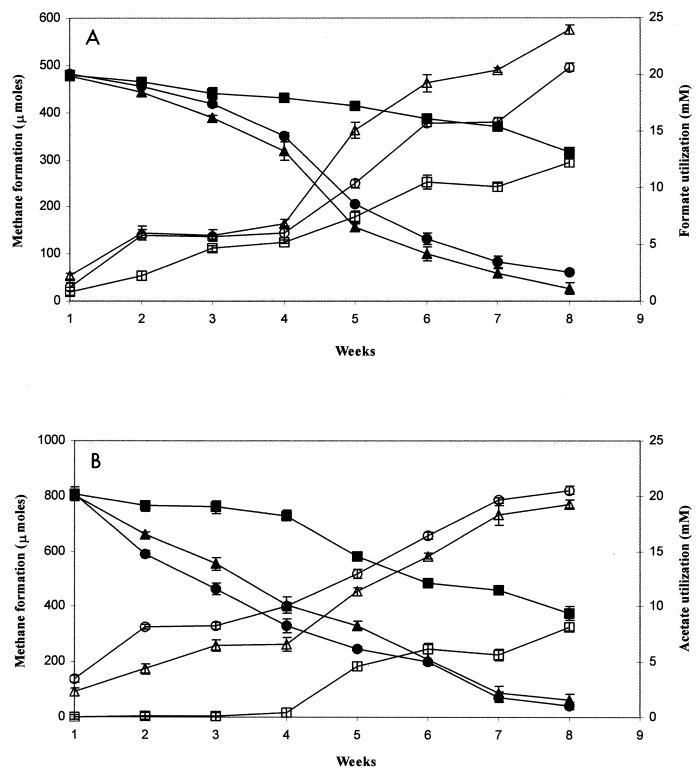
Figure 2 shows total methanogenesis by soil samples with exogenous formate or acetate, substrates that may be used directly by methanogens. Methanogenesis trends were similar to those observed for propionate and butyrate; F1 and F4 microcosms yielded greater depletion of formate and more methanogenesis than did U3 microcosms (Fig. 2A). Addition of acetate produced more CH4 in the F4 microcosms than in either the F1 or U3 microcosm (Fig. 2B).
FIG. 2.
Quantification of weekly depletion of 20 mM formate or acetate (filled symbols) in WCA-2A soils leading to formation of methane (open symbols). (A) Formate; (B) acetate. Symbols: triangles, F1 (eutrophic); circles, F4 (transition); squares, U3 (oligotrophic). Analysis was conducted in triplicate, and mean values are presented; error bars represent ±1 standard deviation.
Phylogeny of methanogens and syntrophs.
Clones of archaeal and bacterial 16S rRNA gene sequences from F1, F4, and U3 microcosms spiked with propionate, butyrate, acetate, or H2 were resolved by RFLP. RFLPs of 16S rRNA genes indicated similar methanogenic assemblages in F1 and F4 microcosms, which differed completely from RFLP patterns observed from the U3 microcosms (data not shown).
Sequence analysis of clones representative of the RFLP groups for methanogens is presented in Fig. 3. Clones from propionate and butyrate enrichments from individual sites were generally similar, and clones from F1 and F4 shared a high degree of sequence similarity. Clones from F1 and F4 microcosms clustered with Methanosaeta, Methanospirillum, and Methanosarcina spp. Methanosaeta species are obligate acetoclastic methanogens and thrive in low acetate concentrations (7 to 70 μM). Methanosarcina spp. are very inefficient in utilizing acetate below concentrations of 0.2 to 1.2 mM but are metabolically versatile, i.e., they function as hydrogenotrophic, methylotrophic, and acetoclastic methanogens (16). The F1 and F4 sequences (sequences F1/P-2, F1/B-2, F4/P-2, and F4/B-2) most closely related to Methanosaeta cluster in a relatively deep branch separate from the primary Methanosaeta cluster and share 93% sequence similarity with known Methanosaeta spp. Attempts are currently under way in our laboratory to isolate this novel strain.
FIG. 3.
Phylogenetic tree of partial 16S rRNA gene sequences from domain Archaea, constructed with PAUP version 4.0b8 using maximum parsimony. Clones were obtained from F1 (eutrophic), F4 (transition), and U3 (oligotrophic) microcosms, spiked with P (propionate) or B (butyrate). Numbers at nodes represent bootstrap values (100 times resampling); only values of >50 are presented. Halobacterium salinarum was used as the outgroup.
Clone libraries from U3 microcosms were less diverse than those from the nutrient-impacted microcosms, and U3 sequences clustered exclusively with Methanosarcina mazei, a versatile methanogen that can utilize acetate or H2-CO2. RFLPs based on archaeal sequences amplified directly from F1, F4, and U3 soils were similar to those sequences obtained from the microcosms (data not shown).
Characterization of syntrophic enrichments.
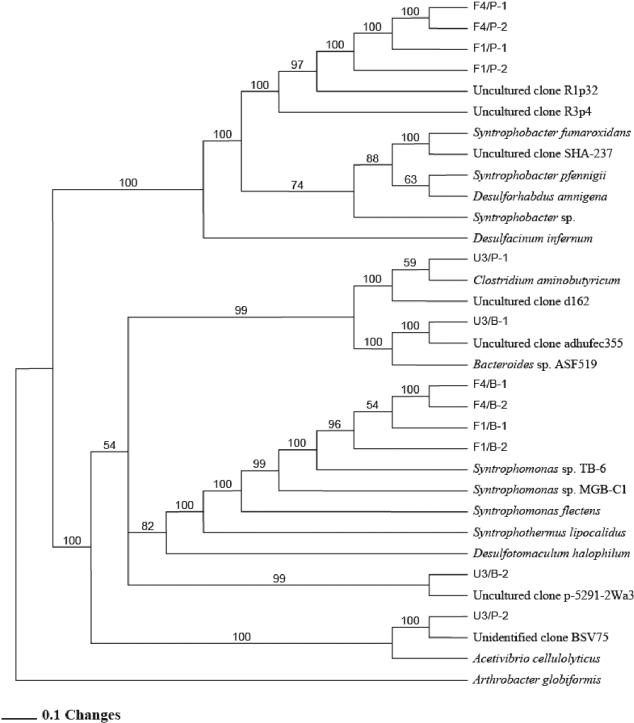
To investigate the diversity of syntrophic bacteria in the propionate and butyrate microcosms, the microcosms were used as starters to enrich for syntrophs. One enrichment transfer was required to observe a majority of sequences clustering with known syntrophs in 16S rRNA gene libraries from F1 and F4 microcosms, and three transfers were required for U3 microcosms.
Sequences from F1 and F4 clustered in deep branches separate from cultivated Syntrophobacter spp. and Syntrophomonas spp., which are known propionate- and butyrate-oxidizing bacteria (Fig. 4). In early U3 enrichments, dominant phylotypes (sequence U3/P-1) did not cluster with syntrophs but with known Clostridium aminobutyricum, which ferments aminobutyrate into acetate and butyrate. Other phylotypes in U3 enrichments clustered in a deeply branching group outside a branch with Desulfotomaculum and Syntrophothermus groups (sequence U3/B-2, Fig. 4). It is not known at this time if these sequences represent syntrophs or sulfate-reducing bacteria that do not function as syntrophs. If they are syntrophs, they represent a novel lineage.
FIG. 4.
Phylogenetic tree of partial 16S rRNA gene sequences from domain Bacteria, constructed with PAUP version 4.0b8 using maximum parsimony. Clones were obtained from F1 (eutrophic), F4 (transition), and U3 (oligotrophic) microcosms, spiked with P (propionate) or B (butyrate). Numbers at nodes represent bootstrap values (100 times resampling analysis); only values of >50 are presented. Arthrobacter globiformis was used as the outgroup.
DIC analyses of consortia.
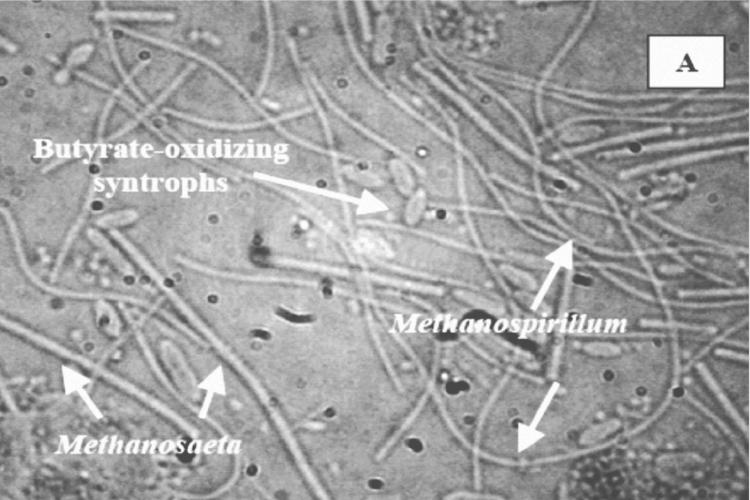
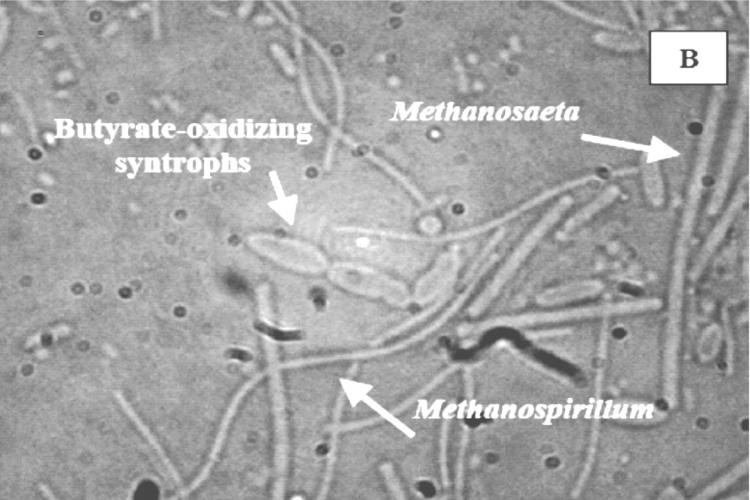
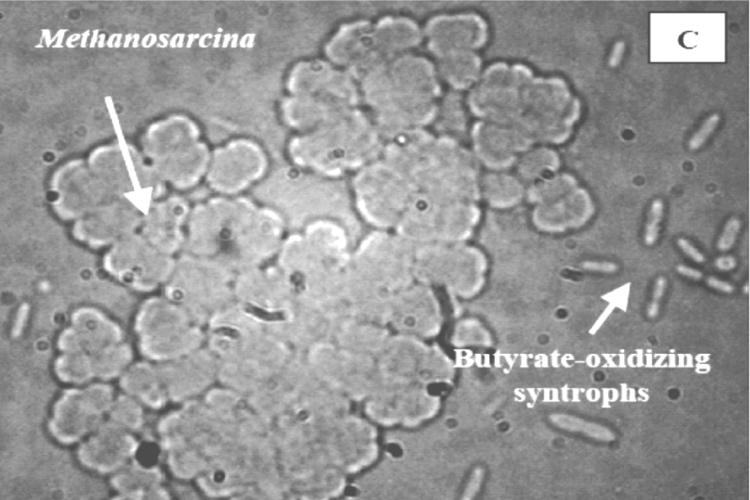
Methanogenic consortia obtained from F1, F4, and U3 microcosms after two transfers of enrichment with exogenously added fatty acids were compared by DIC microscopy (Fig. 5). The phylogenetic analysis of these methanogens is presented in Fig. 4, which indicates the presence of strains harboring 16S rRNA genes clustering with Methanosaeta, Methanosarcina, and Methanospirillum. Typical cell morphologies of methanogens identified by rRNA sequence analysis in these enrichments are easily distinguished, allowing assumptions to be made regarding cells representing Methanosaeta, Methanosarcina, and Methanospirillum in the photographs.
FIG. 5.
DIC microscopy of consortia obtained from F1 (eutrophic), F4 (transition), and U3 (oligotrophic) microcosms. (A) Consortium from F1 (eutrophic) microcosm, showing the Methanosaeta characteristic of long filaments with blunt ends, juxtaposed with butyrate-oxidizing syntrophic bacteria; (B) consortium from F4 (transition) microcosm; (C) consortium from U3 (oligotrophic) microcosm, showing Methanosarcina in clumps with very few presumed fatty acid-oxidizing bacteria.
Consortia from F1 and F4 microcosms were dominated by long blunt filaments characteristic of Methanosaeta spp. and included cells resembling Methanospirillum (Fig. 5A and B). Smaller associated bacteria were presumed to be syntrophs. Similar consortia were not observed in enrichments from U3 (Fig. 5C), which consisted of abundant Methanosarcina organisms and presumed syntrophs. Methanosaeta and Methanospirillum were not evident in these consortia. Furthermore, the terminal MPN dilution series from F1 and F4 samples contained similar consortia of Methanosaeta, Methanospirillum, and the fatty acid-oxidizing syntrophs as opposed to the predominant biculture of Methanosarcina clumps and syntrophs in U3 (confirmed by DIC analysis; data not shown). The relationship between Methanospirillum and syntrophic bacteria is well understood for their roles as H2 scavengers in syntrophic relationships, but the abundance of Methanosaeta in consortia from F1 and F4 deserves further study.
DISCUSSION
Methanogenesis from butyrate and propionate requires involvement of H2-utilizing, fatty acid-oxidizing bacteria or syntrophs to produce acetate and hydrogen that can be utilized by methanogens (7, 22). We characterized syntrophic-methanogenic consortia at three sites along a well-characterized nutrient gradient in the northern Florida Everglades. As expected from previous studies (4, 9, 30), MPN methanogens (Table 2) and methanogenesis rates (with and without exogenous fatty acids) were higher in soil microcosms taken from eutrophic and transition regions (F1 and F4) than in those from oligotrophic regions (U3) (Fig. 1). Approximately 10-fold-more MPN hydrogenotrophs were observed in F1 than in U3, while U3 and F4 harbored a greater number of acetotrophs than did F1. Correspondingly, potential hydrogenotrophic methanogenesis rates were higher in F1 microcosms than in microcosms from either F4 or U3, while potential acetotrophic methanogenesis was greater in F4 microcosms than in F1 or U3 microcosms (Fig. 2B).
Propionate- and butyrate-induced methanogenesis was significantly faster in F1 than in F4 (Fig. 1), yet MPN syntrophs (Table 2) and hydrogenotrophs and formate-induced methanogenesis (modeling hydrogenotrophic methanogenesis) were similar in F1 and F4 (Fig. 2). An explanation for this discrepancy is that the method used for enumeration of syntrophs likely underestimated the true numbers. Enumeration of syntrophs is currently limited to culture-based approaches such as MPN enumeration (13, 20), and problems associated with culture-based enumeration approaches are well documented (12, 20). In addition to problems associated with cultivability, it may be that syntrophic consortia in F1 and F4 were broken apart due to vigorous shaking of soil prior to dilution for the MPN series, resulting in an artificially low estimation of numbers of syntrophs for both F1 and F4. The relatively long lag phase for F4 between weeks 1 and 4 in propionate-induced methanogenesis presented in Fig. 1A suggests that a significant amount of growth of either syntrophs or methanogens occurred in F4. A similar lag phase was not observed for F1, suggesting that little or no growth occurred during this time.
In addition to differences in activities and numbers, syntrophic consortia in enrichments from eutrophic regions of WCA-2A differ in composition from those from oligotrophic regions, indicating that different selective forces are present in these regions. Interestingly, other studies have shown that fatty acids were utilized more rapidly in triculture of Methanospirillum hungatei (hydrogenotroph), Methanothrix soehngenii (acetate utilizer), and strain MPOB (mesophilic propionate-oxidizing bacteria) than in biculture (Methanospirillum with MPOB), indicating that low acetate and H2 concentrations were favorable for syntrophy in those systems (14, 27). Butyrate utilization has been shown to depend on acetate levels, such that accumulation of acetate thermodynamically controls the extent of substrate degradation (15, 28). Three-member consortia were routinely observed in F1 and F4 enrichments but not in U3 enrichments. It may be that a novel Methanosaeta-like group found in F1 and F4 enrichments and soils utilizes acetate formed by syntrophs, which aids efficient syntrophy to occur in these eutrophic soils. Extrapolating data from enrichments to field conditions is tenuous at best, and more work is required to confirm the importance of these consortia in situ.
In addition to leading to a greater understanding of the effects of eutrophication on pathways by which carbon is cycled in wetlands, elucidation of structure-function relationships of key microbial assemblages may lead to the development of biological indicators, which may predict impending eutrophication of oligotrophic marshes or their recovery status during restoration projects.
Acknowledgments
This study was supported by grant DEB-0078368 from the National Science Foundation.
We acknowledge A. F. Stams for providing feedback and Syntrophomonas strain MPOB. We acknowledge H. Castro and I. Uz for helpful discussions and E. Stanley and P. Jasrotia for providing excellent technical help. Sue Newman, J. Prenger, and Yu Wang are acknowledged for their assistance in soil sampling and chemical analysis. We are grateful to J. Suflita and M. McInerney for Methanospirillum hungatei strain JF-1.
REFERENCES
- 1.Altschul, S. F., W. Gish, W. Miller, E. W. Myers, and D. J. Lipman. 1990. Basic local alignment search tool. J. Mol. Biol. 215:403-410. [DOI] [PubMed] [Google Scholar]
- 2.Bachoon, D., and R. D. Jones. 1992. Potential rates of methanogenesis in sawgrass marshes with peat and marl soils in the Everglades. Soil Biol. Biochem. 24:21-27. [Google Scholar]
- 3.Burggraf, S., K. O. Stetter, P. Rouviere, and C. R. Woese. 2001. Methanopyrus kandleri: an archaeal methanogen unrelated to all other known methanogens. Syst. Appl. Microbiol. 14:346-351. [DOI] [PubMed] [Google Scholar]
- 4.Castro, H., K. R. Reddy, and A. Ogram. 2002. Composition and function of sulfate-reducing prokaryotes in eutrophic and pristine areas of the Florida Everglades. Appl. Environ. Microbiol. 68:6129-6137. [DOI] [PMC free article] [PubMed] [Google Scholar]
- 5.Cicerone, R. J., and R. S. Oremland. 1988. Biogeochemical aspects of atmospheric methane. Global Biogeochem. Cycles 2:299-327. [Google Scholar]
- 6.Cole, J. R., B. Chai, T. L. Marsh, R. J. Farris, Q. Wang, S. A. Kulam, S. Chandra, D. M. McGarrell, T. M. Schmidt, G. M. Garrity, and J. M. Tiedje. 2003. The Ribosomal Database Project (RDP-II): previewing a new autoaligner that allows regular updates and the new prokaryotic taxonomy. Nucleic Acids Res. 31:442-443. [DOI] [PMC free article] [PubMed] [Google Scholar]
- 7.Conrad, R. 1999. Contribution of hydrogen to methane production and control of hydrogen concentrations in methanogenic soils and sediments. FEMS Microbiol. Ecol. 28:193-202. [Google Scholar]
- 8.DeBusk, W. F., and K. R. Reddy. 1998. Turnover of detrital organic carbon in a nutrient-impacted Everglades marsh. J. Environ. Qual. 30:1438-1446. [Google Scholar]
- 9.Drake, H. L., N. G. Aumen, C. Kuhner, C. Wagner, A. Grießhammer, and M. Schmittroth. 1996. Anaerobic microflora of Everglades sediments: effects of nutrients on population profiles and activities. Appl. Environ. Microbiol. 62:486-493. [DOI] [PMC free article] [PubMed] [Google Scholar]
- 10.Dunfield, P., R. Knowles, R. Dumont, and T. R. Moore. 1993. Methane production and consumption in temperate and subarctic peat soils: response to temperature and pH. Soil Biol. Biochem. 25:321-326. [Google Scholar]
- 11.Gleason, P. J., and P. Stone. 1994. Age, origin and landscape evolution of the Everglades, the ecosystem and its restoration, p. 149-198. St. Lucie Press, Boca Raton, Fla.
- 12.Großkopf, R., P. H. Janssen, and W. Liesack. 1998. Diversity and structure of the methanogenic community in anoxic rice paddy soil microcosms as examined by cultivation and direct 16S rRNA gene sequence retrieval. Appl. Environ. Microbiol. 64:960-969. [DOI] [PMC free article] [PubMed] [Google Scholar]
- 13.Horn, M. A., C. Matthies, K. Kusel, A. Schramm, and H. L. Drake. 2003. Hydrogenotrophic methanogenesis by moderately acid-tolerant methanogens of a methane-emitting acidic peat. Appl. Environ. Microbiol. 69:74-83. [DOI] [PMC free article] [PubMed] [Google Scholar]
- 14.Imachi, H., Y. Sekiguchi, Y. Kamagata, A. Ohashi, and H. Harada. 2000. Cultivation and in situ detection of a thermophilic bacterium capable of oxidizing propionate in syntrophic association with hydrogenotrophic methanogens in a thermophilic methanogenic granular sludge. Appl. Environ. Microbiol. 66:3608-3615. [DOI] [PMC free article] [PubMed] [Google Scholar]
- 15.Jackson, B. E., and M. J. McInerney. 2002. Anaerobic microbial metabolism can proceed close to thermodynamic limits. Nature 415:454-456. [DOI] [PubMed] [Google Scholar]
- 16.Jetten, M. S. M., A. J. M. Stams, and A. J. B. Zehnder. 1992. Methanogenesis from acetate: a comparison of the acetate metabolism in Methanothrix soehngenii and Methanosarcina spp. FEMS Microbiol. Ecol. 88:181-198. [Google Scholar]
- 17.Koch-Rose, M. S., K. R. Reddy, and J. P. Chanton. 1994. Factors controlling nutrient profiles in a subtropical peatland of the Everglades. J. Environ. Qual. 23:526-533. [Google Scholar]
- 18.Lane, D. J. 1991. 16S/23S rRNA sequencing, p. 115-175. In E. Stackebrandt and M. Goodfellow (ed.), Nucleic acid techniques in bacterial systematics. John Wiley & Sons, Inc., New York, N.Y.
- 19.Moore, T. R., and R. Knowles. 1990. Methane emissions from fen, bog and swamp peatlands in Quebec. Biogeochemistry (Dordrecht) 11:45-61. [Google Scholar]
- 20.Mormile, M. R., K. R. Gurijala, J. A. Robinson, M. J. McInerney, and J. M. Suflita. 1996. The importance of hydrogen in landfill fermentations. Appl. Environ. Microbiol. 62:1583-1588. [DOI] [PMC free article] [PubMed] [Google Scholar]
- 21.Reddy, K. R., J. R. White, A. Wright, and T. Chua. 1999. Influence of phosphorus loading on microbial processes in the soil and water column of wetlands, p. 249-273. In K. R. Reddy, G. A. O'Connor, and C. L. Schelske (ed.), Phosphorus biogeochemistry in subtropical ecosystems. Lewis Publishers, New York, N.Y.
- 22.Schink, B. 1997. Energetics of syntrophic cooperation in methanogenic degradation. Microbiol. Mol. Biol. Rev. 61:262-280. [DOI] [PMC free article] [PubMed] [Google Scholar]
- 23.Thompson, J. D., T. J. Gibson, F. Plewniak, F. Jeanmougin, and D. G. Higgins. 1997. The ClustalX windows interface: flexible strategies for multiple sequence alignment aided by quality analysis tools. Nucleic Acids Res. 24:4876-4882. [DOI] [PMC free article] [PubMed] [Google Scholar]
- 24.Touzel, J. P., and G. Albagnac. 1983. Isolation and characterization of Methanococcus mazei strain MC3. FEMS Microbiol. Lett. 16:241-245. [Google Scholar]
- 25.Uz, I., M. E. Rasche, T. Townsend, A. V. Ogram, and A. S. Lindner. 2003. Characterization of methanogenic and methanotrophic assemblages in landfill samples. Proc. R. Soc. Lond. B (Suppl.). Biol. Lett. 270:S202-S205. [DOI] [PMC free article] [PubMed] [Google Scholar]
- 26.Vaithiyanathan, P., and C. J. Richardson. 1997. Nutrient profiles in the Everglades: examination along the eutrophication gradient. Sci. Total Environ. 205:81-95. [DOI] [PubMed] [Google Scholar]
- 27.Voolapalli, R. K., and D. C. Stuckey. 1999. Relative importance of trophic group concentrations during anaerobic degradation of volatile fatty acids. Appl. Environ. Microbiol. 65:5009-5016. [DOI] [PMC free article] [PubMed] [Google Scholar]
- 28.Warikoo, V., M. J. McInerney, J. A. Robinson, and J. M. Suflita. 1996. Interspecies acetate transfer influences the extent of anaerobic benzoate degradation by syntrophic consortia. Appl. Environ. Microbiol. 62:26-32. [DOI] [PMC free article] [PubMed] [Google Scholar]
- 29.White, J. R., and K. R. Reddy. 1999. Influence of nitrate and phosphorus loading on denitrification enzymes activity in Everglades wetland soils. Soil Sci. Soc. Am. J. 63:1945-1954. [Google Scholar]
- 30.Wright, A. L., and K. R. Reddy. 2001. Heterotrophic microbial activities in northern Everglades wetland. Soil Sci. Soc. Am. J. 65:1856-1864. [Google Scholar]
- 31.Wright, A. L., and K. R. Reddy. 2001. Phosphorus loading effects on extracellular enzyme activity in Everglades wetland soil. Soil Sci. Soc. Am. J. 65:588-595. [Google Scholar]


