Abstract
Purpose:
Renal calculi are common extracolonic incidental findings on computed tomographic colonography (CTC). This work aims to develop a fully automated computer-aided diagnosis system to accurately detect renal calculi on CTC images.
Methods:
The authors developed a total variation (TV) flow method to reduce image noise within the kidneys while maintaining the characteristic appearance of renal calculi. Maximally stable extremal region (MSER) features were then calculated to robustly identify calculi candidates. Finally, the authors computed texture and shape features that were imported to support vector machines for calculus classification. The method was validated on a dataset of 192 patients and compared to a baseline approach that detects calculi by thresholding. The authors also compared their method with the detection approaches using anisotropic diffusion and nonsmoothing.
Results:
At a false positive rate of 8 per patient, the sensitivities of the new method and the baseline thresholding approach were 69% and 35% (p < 1e − 3) on all calculi from 1 to 433 mm3 in the testing dataset. The sensitivities of the detection methods using anisotropic diffusion and nonsmoothing were 36% and 0%, respectively. The sensitivity of the new method increased to 90% if only larger and more clinically relevant calculi were considered.
Conclusions:
Experimental results demonstrated that TV-flow and MSER features are efficient means to robustly and accurately detect renal calculi on low-dose, high noise CTC images. Thus, the proposed method can potentially improve diagnosis.
Keywords: renal calculi, kidney stone, total variation flow, maximally stable extremal regions, computer-aided detection
1. INTRODUCTION
Renal calculi are solid concretions or crystal aggregations inside kidneys, which are mainly caused by low fluid intake. They cause a particular type of pain, called “renal colic,” which is one of the most painful urologic disorders. The prevalence of renal calculi was 8.8% in the United States in 2012, and the male to female ratio for renal calculi is 4:1.1 30%–40% of these patients will form another calculi after the first occurrence.2 Renal calculi disease is costly. Each year nearly 3.3 × 10⁶ Americans require medical care for renal calculus removal and pain relief at a cost of $5.3 × 109.3 Most renal calculi are found when renal colic forces patients to seek immediate medical attention in the emergency department of a hospital or an urgent care center. Renal calculi can also be found incidentally in asymptomatic individuals undergoing tests for other reasons, such as CT colonography (CTC) for colonic polyp detection. In this setting, early detection of renal calculi could prevent patients from suffering renal colic as well as reduce the cost and uncertainty of diagnosis and treatment.
Although renal calculi are one common extracolonic finding4–7 in CTC, belonging to C-RADS E2 category,8 computer-aided diagnosis was seldom explored to detect them in CTC images. Existing radiology research on extracolonic findings focuses primarily on ascertaining the clinical importance and downstream costs of extracolonic findings in asymptomatic patients.8–10 Similarly, in urology research there are extensive studies of clinical outcomes or impacts of renal calculi, such as temporal trends of renal calculi,11–13 calculi size measurements,14–17 and limitations of noncontrast CT images on size measurements.18,19 A detailed survey of these clinical findings can be found in Ref. 20.
There is limited work on computer-aided renal calculi detection. Tamilselvi21 identified renal calculi candidates on ultrasound images by using a region-growing algorithm. Texture features were then constructed on calculi candidates, and the spatial gray level dependence of the texture features was evaluated to classify the current patient into three categories, normal, early detection (small stones that do not cause symptoms), and kidney stones. Later, Tamilselvi22,23 improved their approach with a learning process called adaptive neuro fuzzy inference system (ANFIS) to improve calculi classification accuracy and a contour-based method to enhance calculi segmentation. A similar approach could be found in Shah’s work24 except that comprehensive gray level statistical texture features were constructed for classification. Lee et al.25 developed a computer-aided diagnosis system to differentiate urinary stone and vascular calcifications on precontrast CT images. In their method, they semiautomatically chose calculi candidates using a region-growing method followed by computation of statistical and shape features. Urinary stone and vascular calcifications were differentiated using an artificial neural network. To summarize, there is little published work on the automated detection of renal calculi on CT images. In addition, all of these works required considerable manual preprocessing.
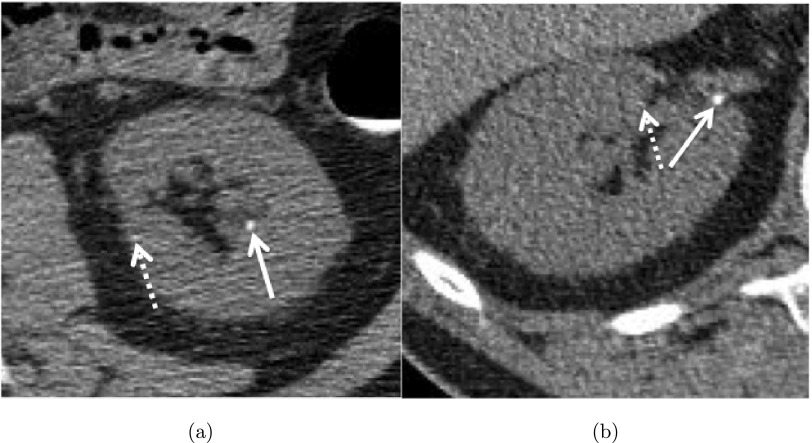
In this work, we present a fully automatic computer-aided system to detect renal calculi on CTC images. The main challenge is that CTC scans are obtained with low radiation dose leading to noisy images of the kidneys because the primary purpose of CTC protocols is not for the detection of renal calculi, but for the screening of colon cancer. Figure 1 shows examples of renal calculi. Despite the fact that renal calculi have high intensity values in the CTC images, many bright spots also exist in kidney regions due to image noise, which easily yield false positives. To address this issue, we devised two novel strategies, total variation (TV) flow to reduce image noise and maximally stable extremal region (MSER) to robustly extract renal calculi candidates with high intensity values. We then built shape and texture features in calculi candidates to train a support vector machine26 to identify true calculi and remove false positives. The shape features include candidate volume size, distance of the candidate to kidney boundaries, and two aspect ratios of height/length and width/length of a calculus candidate. Texture features include mean and standard deviation of intensity values in the calculi candidate, local binary pattern,27 and histogram of oriented gradients.28 Experiments on 192 CTC images were used to validate the method.
FIG. 1.
Two calculi (solid white arrows) in the (a) left and (b) right kidneys on CTC images. Image noise (dashed arrows) poses the greatest challenge to detect such calculi.
2. METHODS AND MATERIALS
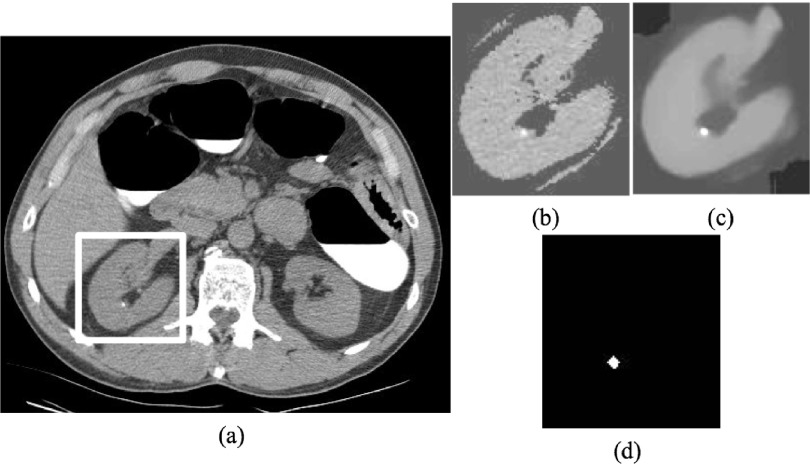
Figure 2 summarizes our method for computer-aided detection of renal calculi, which consists of four main steps. First, kidneys are segmented on CTC images, and a subimage [Fig. 2(b)] is then extracted based on the bounding box of the segmented kidney. The subimage defines the search range for renal calculi. Second, TV-flow is established on the subimage to remove image noise while maintaining renal calculi [Fig. 2(c)]. Third, MSER feature is employed to detect and segment renal calculi on the smoothed subimage [Fig. 2(d)]. Fourth, shape and texture features are computed on the calculi segmentations. These features are used to train a support vector machine classifier to generate the final calculi detection and reduce false positives. We will elaborate on these four main steps in this section.
FIG. 2.
Process of renal calculi detection on CTC images. (a) Original CTC image, (b) subimage determined by kidney segmentation and used to constrain the search range of renal calculi, (c) smoothed subimage using TV-flow, and (d) renal calculi detection by MSER feature.
2.A. Kidney segmentation
The purpose of this step is to segment kidneys on CTC images and use the segmentation to constrain the search ranges of renal calculi.
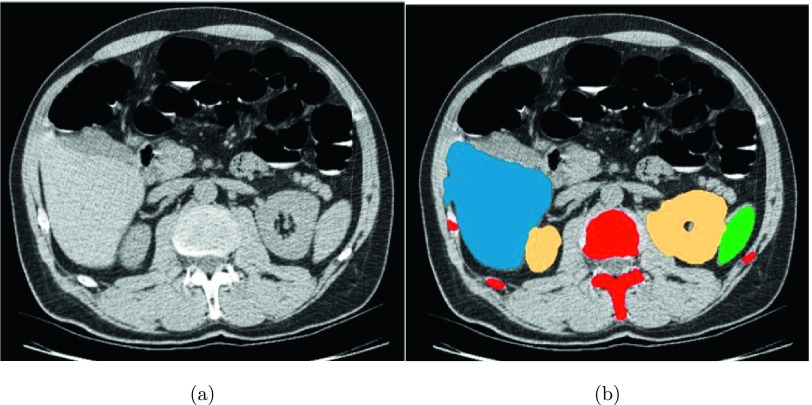
Instead of manually labeling kidney regions,21,24,25 we developed an automated kidney segmentation method29 to extract the left and right kidneys in CTC images. This approach involves four steps. First, we automatically segment the liver and spleen30 and ribs31 [Fig. 3(b)] to determine a few anatomic landmarks that are used to define two subimages that mainly contain the left and right kidneys. Second, five pairs of reference CT images and their corresponding kidney segmentations are matched with each subimage to establish probabilistic atlases of left and right kidneys through a sequence of affine32 and nonrigid33 registrations. Third, the probabilistic atlas in conjunction with kidney intensity priors is embedded into a belief propagation framework34 to extract kidney regions. Finally, kidney boundaries are smoothed with geodesic active contours (GAC).35 The final kidney segmentation is illustrated in Fig. 3(b).
FIG. 3.
Kidney segmentation for constraining the search range of renal calculi. (a) Original CTC image and (b) segmentations of liver (blue), spleen (green), spine and ribs (red), and kidneys (yellow).
After kidneys are segmented, bounding boxes of left and right kidneys are determined, and two subimages are extracted based on these two bounding boxes. In these subimages, only kidney regions with original intensity information are preserved. Figure 2(b) illustrates the final subimage of the right kidney that constrains the search for renal calculi.
2.B. TV-flow smoothing
In this step, TV-flow is employed to reduce image noise while preserving renal calculi in the subimages because image noise is the primary challenge to hinder accurate renal calculi detection in CTC images. TV-flow is superior to conventional anisotropic diffusion methods36–38 because it requires no constant parameters in the diffusivity function and generates diffused images close to piecewise constant segmentation results. It is a nonlinear diffusion process that denoises an image I using the partial differential equation39
| (1) |
The fundamental idea of TV-flow is to minimize the global total variation ∫Ω|∇u|dx of the diffused image u in the image domain Ω while not deviating too much from the original signal I. Note that the diffusion process is controlled by the diffusivity function, g(|∇u|), and it is inverse to image gradient magnitudes. Homogeneous image regions will be highly diffused because they have large diffusivity values, while image edges will be preserved due to small values. This characteristic of TV-flow leads to several desirable properties for renal calculi detection. First, image edges between calculi and tissues are well kept because the diffusion process stops at these edges. Second, TV-flow can efficiently remove both Gaussian and non-Gaussian noise due to the diffusivity function g(|∇u|) described by the L1 norm.39 Third, no additional parameters are required to be optimized in g(|∇u|). The only unknown parameter is the scale t to smooth image. The process of determining t is iterative. We initialize t = 1 and perform MSER feature detection, as described in Sec. 2.C, to determine the potential calculus candidates on the smoothed image. We keep increasing t by 1 until the number of MSER regions detected on the smoothed images is less than 10. The selected scale t is considered as the optimized scale because (1) a MSER region corresponds to a potential calculus candidate; (2) experimental results show that a kidney containing more than ten calculi is rare; and (3) the parameter of ten MSERs optimally balances the reduction of the number of false positives and the avoidance of missing actual renal calculi. The optimized scale t can be determined for each patient through this iteration process. Last but not the least, TV-flow yields a smoothed image similar to a piecewise constant segmentation in Fig. 2(c). Image noise in the noncalcified regions is substantially reduced, while the calculus is preserved. This desirable property makes it tractable to extract true renal calculi in CTC images.
Let us now consider some implementation issues related to the TV-flow. There is a stability issue when the image gradient tends to zero. We stabilize Eq. (1) by adding a small positive constant ϵ = 0.01 to the image gradient in the diffusivity function g(|∇u|)39
| (2) |
Another important issue is the efficient numerical computation of TV-flow. Equation (1) can be explicitly represented as
| (3) |
The discretization of Eq. (3) with respect to boundary conditions is given by
| (4) |
where k is the iteration index, and τ is the time step size, which defines scale t = kτ. A(uk) = (aij(uk)) is a diffusion matrix in terms of the diffusivity function g(|∇u|)
| (5) |
Here, i and j are two neighboring pixels, N(i) denotes the 6-neighborhood of the pixel i, and a gradient approximation by central differences defines
| (6) |
The stability condition for the time step τ of Eq. (4) is τ ≤ 0.25 ϵ,40 so for small ϵ, many iterations are required. However, if we increase the value of ϵ, it will break beneficial properties of TV-flow due to L1 norm. A much more efficient approach is to use a semi-implicit additive operator splitting (AOS) scheme,40 which is proven to be unconditionally stable even with large time step τ. Thus, we set τ = 1 in this work. Instead of directly computing Eq. (1), AOS subdivides the diffusion process into separate computations along each image dimension. Letting the number of image dimensions be D (D = 3 in our work) and the current image dimension be l-direction, Eq. (3) can be implicitly represented as
| (7) |
where 1 is the identity matrix, and is the diffused value along l-direction. Al(uk) measures the diffusion between neighboring pixels only along l-direction and its definition can be found in Ref. 40. The Thomas algorithm41 is applied to solve Eq. (7) and obtain along l-direction, and the final solution is represented as
| (8) |
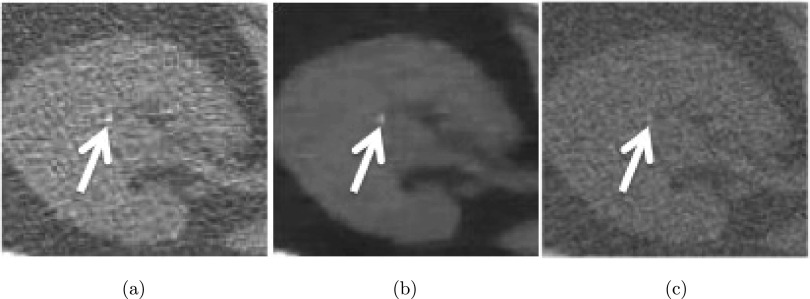
Figure 4 illustrates the results of TV-flow on a right kidney with a small calculus. Note that the image noise in Fig. 4(a) is substantially suppressed while the calculus is well preserved in Fig. 4(b). Figure 4(c) shows the smoothed image using Perona’s approach36 with the same scale t as for Fig. 4(b) and using constant parameters as recommended by the ITK software guide.42 Although the image noise was reduced, the calculus is very difficult to distinguish.
FIG. 4.
TV-flow results on a right kidney. (a) Original CT image with a small calculus (white arrow), (b) smoothed results using TV-flow (t = 2), and (c) smoothed results using Perona’s approach (Ref. 36) (t = 2).
2.C. MSER feature for calculi detection
After kidney regions are smoothed, another critical problem is the identification of renal calculi on the smoothed image. The characteristic of renal calculi is their high intensity values in comparison with surrounding tissues [Figs. 2(c) and 4(b)]. Thus, the problem of calculi detection is equivalent to finding stable image blobs with high intensity values. The MSER feature43 is well suited for the detection of renal calculi because it exploits the extreme intensity values to detect image blobs.
Let us now define MSER features. Assuming Ω to be the image domain, a region Q ⊂ Ω is called an extremal region if for all points p ⊂ Q and all boundary points q ⊂ bd(Q), the intensity value I(p) > I(q) or I(p) < I(q), where bd means the boundary of an image region. Let Q1, …, Qi−1, Qi, be a sequence of nested extremal regions Qi ⊂ Qi+1. Extremal region Qi is maximally stable if and only if f(i) has a local minimum, where
| (9) |
“∖” indicates the region difference between Qi−1 and Qi, and |∗| in Eq. (9) denotes cardinality. The process of MSER feature detection is essentially a thresholding process, and an image region is considered as a MSER feature candidate if it can exist within a threshold range [i − Δ, i + Δ].
For calculi detection, we only select MSER detections with intensity values larger than 100 HU. MSER detection is used to initialize the GAC (Ref. 35) to improve renal calculi segmentation due to GAC’s superior accuracy to segment data with homogeneous texture. Figure 2(d) illustrates the segmentation result after MSER detection on the smoothed subimage, which corresponds exactly to the renal calculus in Fig. 2(c).
2.D. Calculi classification
The last step in computer-aided renal calculi detection was to compute texture and shape features at every segmented calculi candidate by GAC to train a support vector machine classifier44 to reduce false positives. The texture features include mean and standard deviation of intensity values at a segmented candidate, local binary pattern27 (64 dimensions), and histogram of oriented gradients28 (124 dimensions). The shape features include the volume of a candidate, two aspect ratios of height/length and width/length of the candidate, and the distance of the current candidate to the kidney boundary. Shape and texture features are fed into the SVM classifier, which yields the final classification results.
2.E. Validation datasets and methods
The dataset consisted of CTC scans from 1186 patients from three institutions.45 Each patient was scanned during a single breath hold using a four- or eight-channel CT scanner (General Electric Light Speed or Light Speed Ultra, GE Healthcare Technologies, Waukesha, WI). CT scanning parameters included 1.25–2.5 mm section collimation, 15 mm table speed, 1 mm reconstruction interval, 100 mA s, and 120 kVp. Retrospective analysis of these images was approved by our Office of Human Subject Research. In prospective readings by experienced radiologists, 91 patients were found to have renal calculi. We chose 90 of them as positive training samples and excluded one patient with a 13 cm renal lesion in the right kidney, which caused kidney segmentation failure. 102 patients without lesions were chosen from the remaining CTC images as the negative samples. These 192 CTC images (patient age range, 43–77 yr; mean age, 58 ± 7 yr) compose the validation dataset to evaluate our renal calculi detection framework.
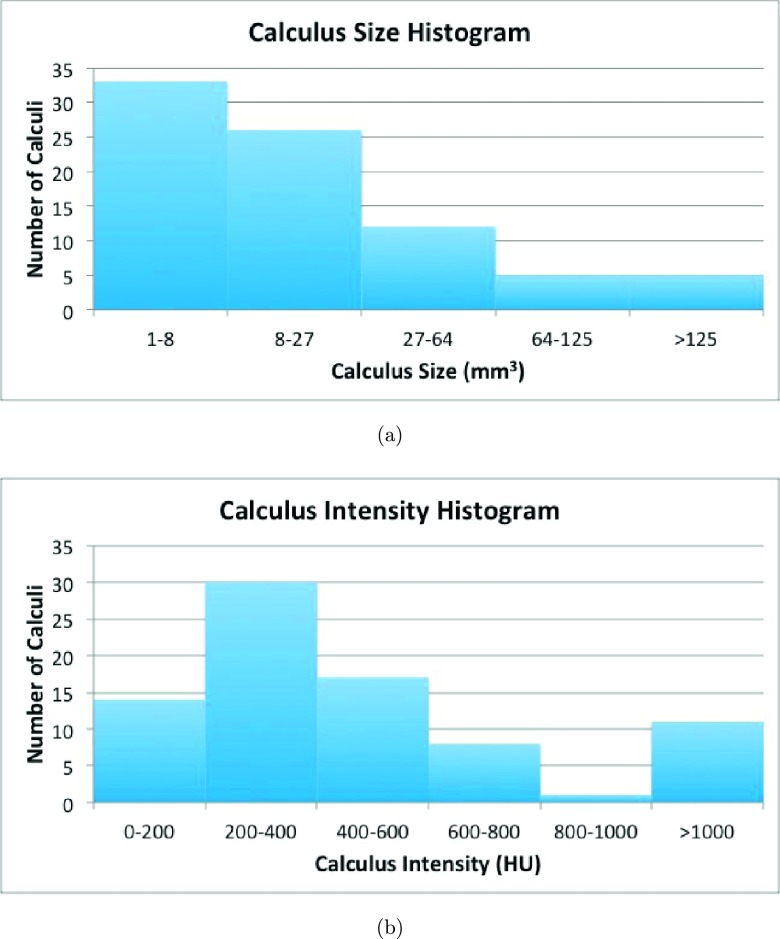
The total number of calculi from the 90 patients was 176. All calculi were marked by an experienced radiologist as the reference standard and confirmed by a second radiologist. The renal calculi volumes were measured using a commercially available standard coronary artery calcium scoring tool (Vitrea Core fX v6, Vital Images, Minnetonka, MN). The default settings of the tool for measuring calcium were a density threshold of 130 HU and a pixel threshold of 3 pixels, as recommended by Patel et al. to assess the volumes of calculi on noncontrast CT images.17 The size range of calculi was 1–433 mm3 and mean size was 38 ± 66 mm3. The calculi CT attenuation ranged from 86 to 1684 HU with a mean of 528 ± 377 HU. We evenly divided the 192 patients into training and testing datasets (96 each). 46 patients with renal calculi were assigned to the training dataset, and the remaining 44 to the testing dataset. In the training and testing datasets, there were 95 and 81 renal calculi, respectively. Figure 5 shows the calculus size and intensity histograms in the testing dataset.
FIG. 5.
Histograms of calculus (a) size and (b) intensity in the testing dataset.
We compared the MSER method with a baseline thresholding method. The thresholding method identifies calculi candidates with intensity values more than 100 HU and size larger than 5 mm3 on images smoothed by TV-flow. We chose 100 HU as the threshold to select calculus candidates in the baseline approach because we also used the same threshold to perform MSER segmentation in Sec. 2.C. 5 mm3 was another optimized threshold to distinguish actual calculi from noise foci with high intensity values and was determined in the training dataset. Clinical studies indicate that calculi less than 27 mm3 usually do not cause obstruction of the ureter.46 Similar to the MSER method, the selected candidates from the thresholding method were also imported into a support vector machine classifier44 to reduce false positives. Therefore, the threshold of 5 mm3 retains clinically relevant calculi, and two same thresholds (100 HU and 5 mm3) used in MSER and the baseline thresholding methods ensure fair comparison between them. In addition, we compared TV-flow, anisotropic diffusion36 [Fig. 4(c)], and not using diffusion to understand the effects of image smoothing on the renal calculi detection. Here, we chose the same scale parameter t for both TV-flow and anisotropic diffusion for the fair comparison.
We also evaluated the influence of size, intensity, noise level, and signal-to-noise ratio (SNR) on the detection accuracy of renal calculi because these four parameters are important factors that determine detectability. We modified Pyatykh’s algorithm47 to estimate the noise level (HU) in the kidneys. This method assumed that intensity variances in the homogeneous image regions are approximately equal to the image noise level. Noise estimation consists of seven steps. First, the subimage [Fig. 2(b)] containing the left or right kidney was decomposed into many 5 × 5 × 5 voxel image cubes, where the 5 voxel dimension was suggested in Ref. 47. Second, the intensity variances of all image cubes were computed and sorted in an increasing order. Third, the first 6% image cubes with the smallest image variances were chosen because they correspond to the most homogeneous kidney regions. Again, the parameter of 6% was determined in Ref. 47. Fourth, a 125-dimension feature vector was constructed on every selected image cube, and each vector component corresponded to the intensity value of an image point in the image cube. Fifth, we performed principal component analysis on all 125-dimension feature vectors and obtained the smallest eigenvalue λ. Sixth, we performed principal component analysis again on all selected image cubes in the images after smoothing by TV-flow [Fig. 2(c)], and we obtained another smallest eigenvalue λ′. λ′ can be considered as the actual image variance of the homogeneous regions in the kidneys because smoothed images are approximately equal to the kidney region without image noise. Finally, the noise level σ was defined as
| (10) |
After the noise level was estimated, SNR was computed as
| (11) |
where Icalculus is the average intensity value in the current renal calculus. Free-response receiver operating characteristic (FROC) analysis48 was used to evaluate the accuracy of renal lesion detection. Measures of performance, including sensitivities and false positive rates for renal calculi detection, are reported on the testing dataset.
Finally, we reported the calculus segmentation accuracy using calculus measurements from the second radiologist as the reference. Because renal calculi in the testing dataset have a wide variety of volume sizes, we chose relative volume difference (RVD) ratio to measure calculus segmentation accuracy. For volume measurements VM from the second radiologist and VS from our segmentation method,
| (12) |
All computations were carried out on a Windows desktop computer with a six-core 2.67 GHz Intel Xeon CPU and 24 GB memory executing c/c++ code. The computation time was less than 2 min per patient.
3. RESULTS
3.A. Comparison of MSER and thresholding methods
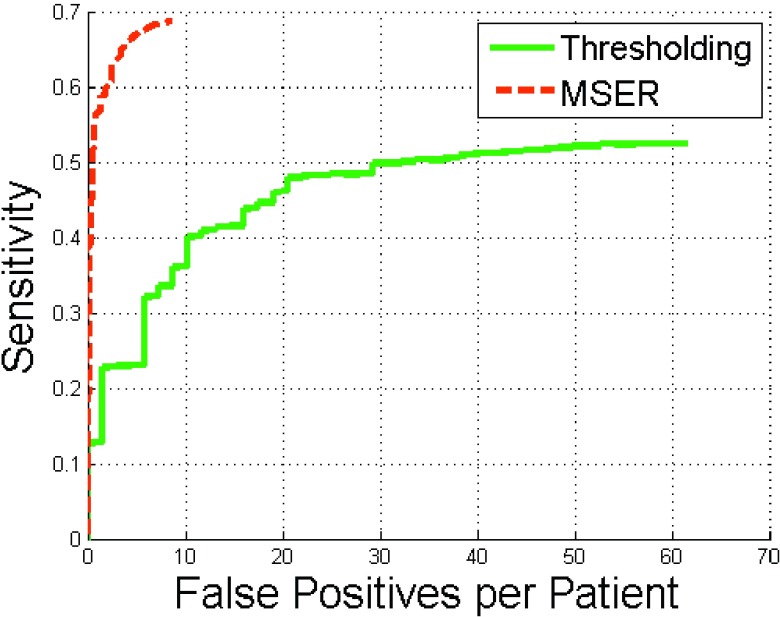
The MSER method significantly outperformed simple thresholding (p < 0.001) (Fig. 6). At eight false positives per patient, MSER achieved 69% sensitivity and thresholding only 35% sensitivity. The sensitivities of both methods were less than 80% because 33 of 81 renal calculi in the testing dataset were smaller than 8 mm3 [Fig. 5(a)]. Tiny calculi smaller than 5 mm3 were difficult to distinguish from image noise.
FIG. 6.
FROC curves of renal calculi detection using MSER and thresholding methods.
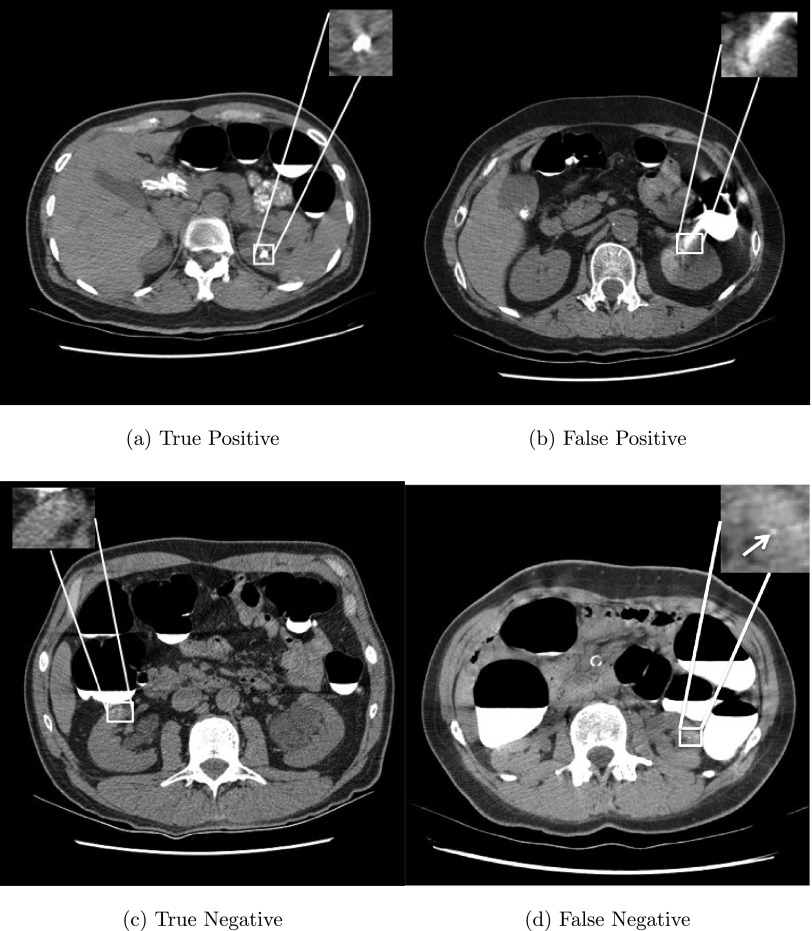
Figure 7 illustrates typical true positive, false positive, true negative, and false negative renal calculi detections. In Fig. 7(a), a renal calculus with 272 mm3 was successfully detected by our method. Three types of false positives were observed in our experiments, including image noise, bones due to kidney segmentation errors, and image artifacts caused by colon fluids, such as a large high intensity image artifact misclassified as a renal calculus in Fig. 7(b). Image artifacts were the most common source of false positives and accounted for 478 of 764 (62.6%) false positives in our experiments. Fortunately, small image artifacts were successfully excluded by our detection system [Fig. 7(c)]. Figure 7(d) shows a false negative missed due to its small size (only 3 mm3). 23/26 (88.5%) of false negatives is caused by calculi less than 8 mm3.
FIG. 7.
Examples of true positive, false positive, true negative, and false negative detections from four patients. Detected renal calculus candidates are marked with a white square and a tiny calculus with a white arrow.
3.B. Comparison of TV-flow, anisotropic diffusion, and nonsmoothing
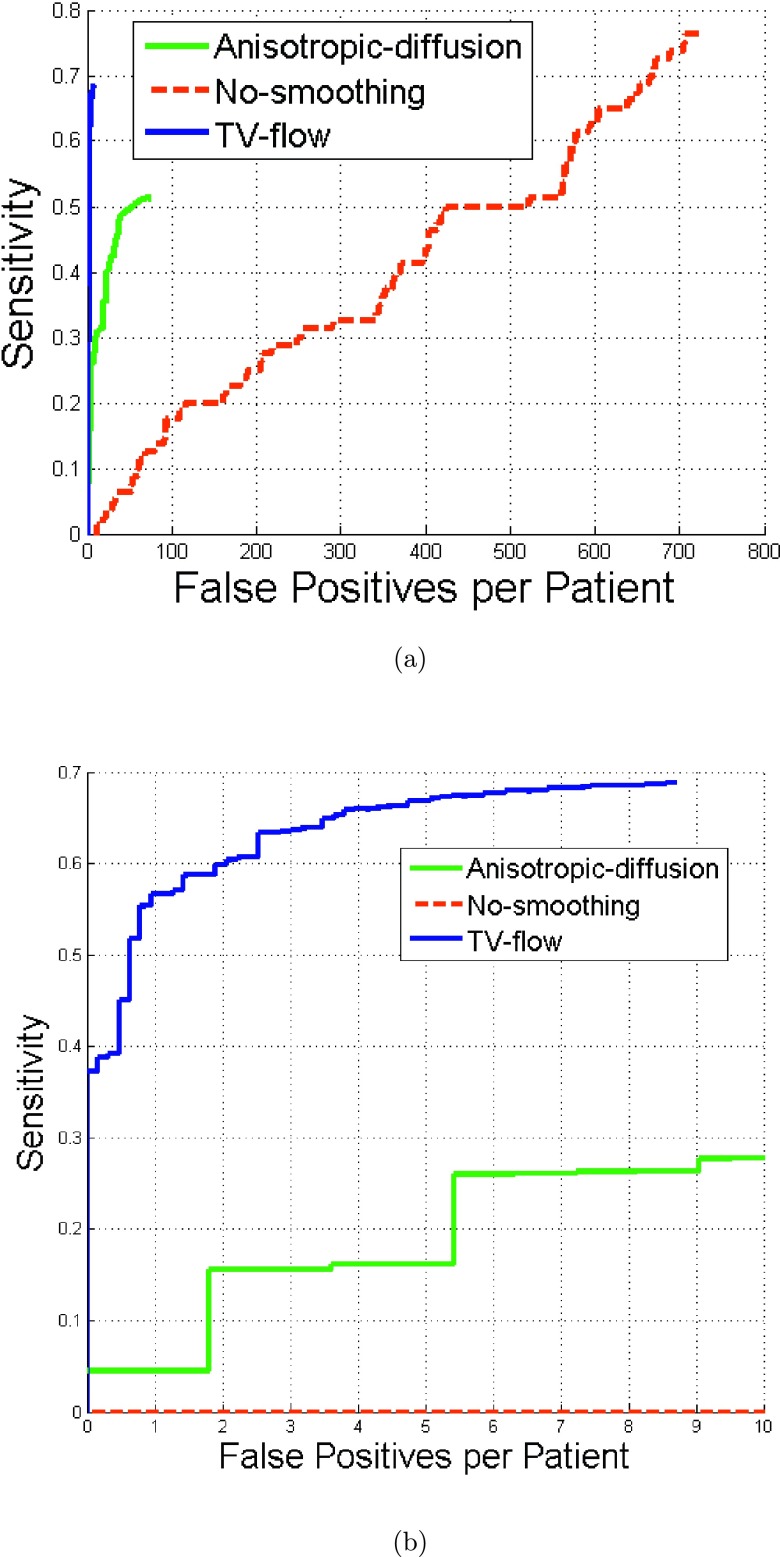
Figure 8 illustrates the comparison results of MSER methods using TV-flow, anisotropic diffusion, and nonsmoothing. At eight false positives per patient, TV-flow achieved 69% sensitivity, anisotropic diffusion 36%, while nonsmoothing 0% in Fig. 8(b). Nonsmoothing generated 660 false positive per patient to achieve 69% sensitivity.
FIG. 8.
FROC curves of renal calculi detection using MSER methods with TV-flow smoothing, with anisotropic diffusion, and without image smoothing.
3.C. Influence of calculi sizes on the detection accuracy
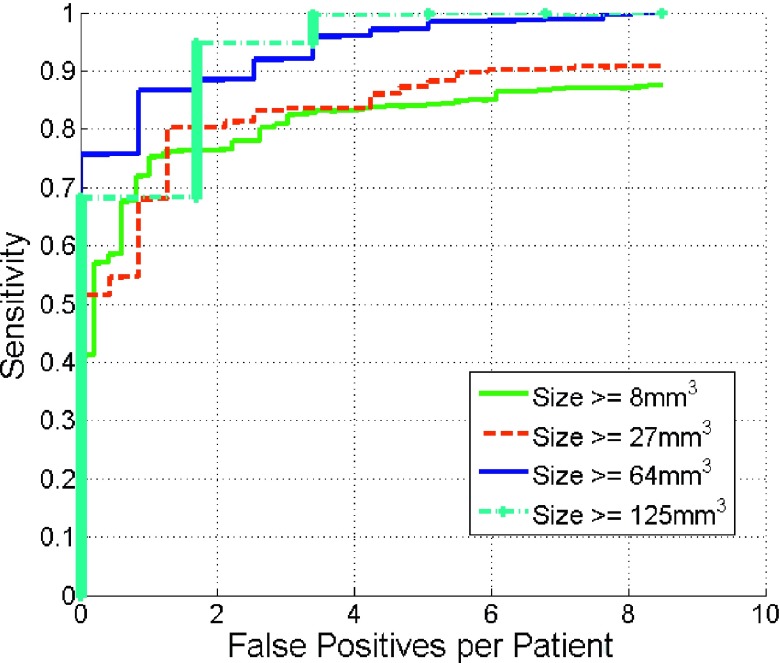
Figure 9 gives the detection results as a function of reference calculus volume. Our method tends to achieve higher detection accuracy on calculi 64 mm3 or larger and comparable accuracy on lesions larger than 8 and 27 mm3. Note that our method can achieve 95% sensitivity with only two false positive per patients if we are only interested in renal calculi larger than 125 mm3. This is an encouraging result because most calculi under 125 mm3 pass spontaneously while larger calculi require surgical management.49
FIG. 9.
Comparison of FROC curves of renal calculi detection as a function of calculus volume.
3.D. Influence of calculi intensity on the detection accuracy
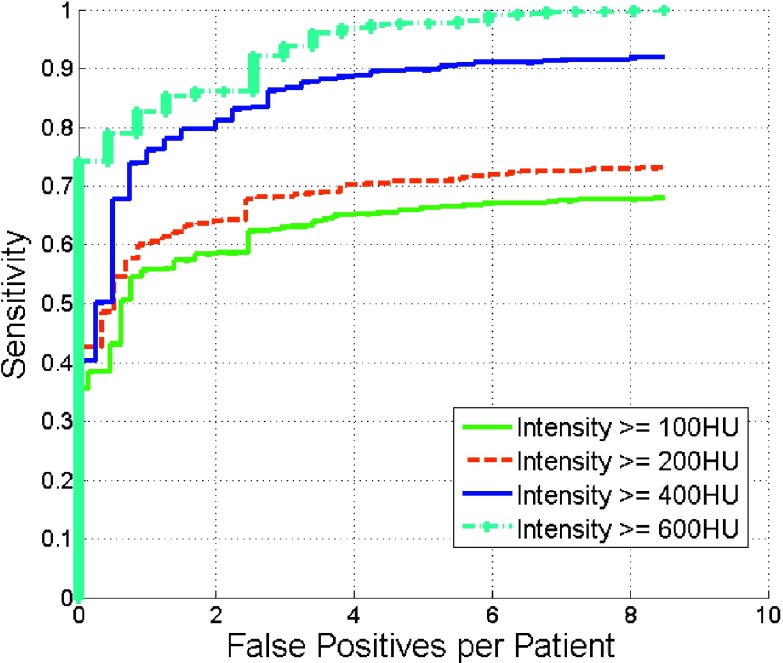
Figure 10 depicts the detection accuracy as a function of calculus intensity. Detection accuracy increased at higher intensities. At four false positives, the sensitivity was 90% on calculi with intensity greater than 400 HU.
FIG. 10.
Comparison of FROC curves of renal calculi detection with different intensities.
3.E. Influence of noise on detection accuracy
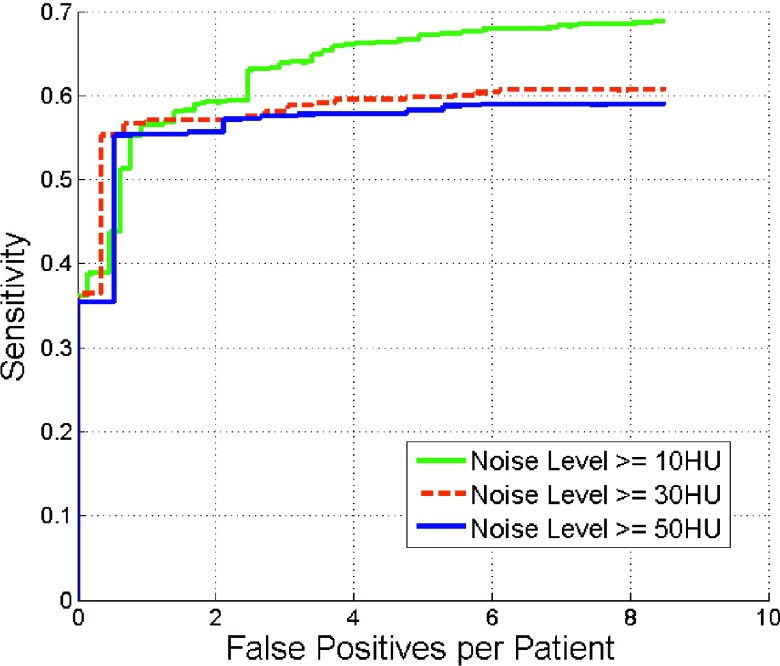
Figure 11 shows the influence of image noise on the detection performance. At four false positives per patient, the detection sensitivity was 67% for noise levels greater than 10 HU. The sensitivity decreased with increasing noise level. The sensitivity plateaued for noise levels more than 30 HU.
FIG. 11.
Comparison of FROC curves of renal calculi detection with different noise levels.
3.F. Influence of SNR on detection accuracy
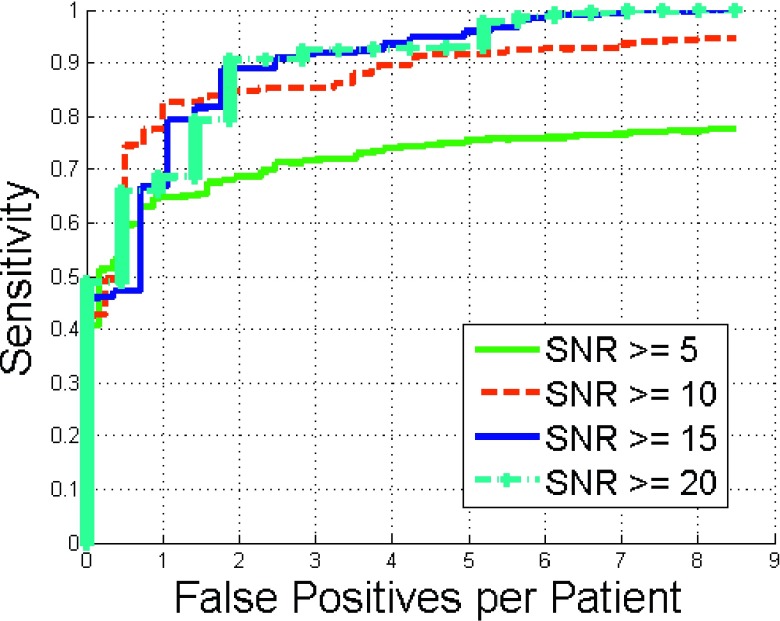
The detection performance as a function of SNR is shown in Fig. 12. Sensitivity increased with increasing SNR.
FIG. 12.
Comparison of FROC curves of renal calculi detection with different SNR values.
3.G. Renal calculus segmentation accuracy
The average of relative volume difference ratio was 115% ± 127% and its range was 1%–343%.
4. DISCUSSION
We developed a fully automatic computer-aided diagnosis system to detect renal calculi on CTC images. We presented two efficient methods (TV-flow and MSER) to address the challenge of image noise in this setting. TV-flow reduces image noise in the kidneys while preserving the calculi. TV-flow requires only one scale parameter t to optimize a desirable property that improves generalizability of a computer-aided diagnosis system. We also developed an automatic strategy to determine the scale t in TV-flow computation based on the assumption that the number of calculi in a kidney is less than 10. After TV-flow smoothing, MSER robustly extracts renal calculi from smoothed images by choosing image blobs with stable volume adaptable to a range of intensity thresholds. Volumes of image blobs caused by noise are unstable for a range of thresholds.
We compared the accuracy of MSER and thresholding for the detection of renal calculi. At eight false positives per patient on the test dataset, the sensitivity of MSER was 69% while thresholding only 35% (p < 0.001). The majority of false positives was due to large image artifacts from adjacent high attenuation colonic fluids. However, small image artifacts could be excluded. Renal calculi less than 5 mm3 often are not detected because they are too small to distinguish from noise. Fortunately, such tiny calculi usually do not cause ureteral obstruction.46 Figure 8 also demonstrated that TV-flow is effective to reduce image noise while keeping accurate calculi detection, and it also yields higher detection accuracy in comparison with traditional anisotropic diffusion methods.
We also analyzed the effects of the size, density, noise level, and SNR of calculi on the detection accuracy. Large calculi with high intensity values are easier to detect compared with small ones with low intensity values. Such properties are clinically useful because large renal calculi are more likely to cause symptoms. The detection performance falls as noise levels increase. The sensitivity plateaued for noise levels larger than 30 HU. SNR is another important factor that affects the detection performance. The sensitivity increases with larger SNR values.
The accuracy of calculus segmentation was relatively low. One possibility is that the geodesic active contour tends to over-segment small calculi. In addition, we purposely over-segment small calculi to include more image points to stably establish texture features for calculus classification.
In conclusion, we have developed and validated an accurate method for the fully automated detection of renal calculi on CTC images. The method can also segment the renal calculi automatically, enabling measurement of size, volume, and intensity. The method may have important clinical utility for CT colonography image interpretation, or potentially interpretation of any nonintravenous contrast enhanced abdominal CT scan.
ACKNOWLEDGMENTS
This work was supported by the Intramural Research Program of the National Institutes of Health, Clinical Center. The authors thank Dr. Perry Pickhardt, Dr. J. Richard Choi, and Dr. William Schindler for providing CT colonography data.
REFERENCES
- 1.Scales C., Smith A., Hanley J., and Saigal C., “Prevalence of kidney stones in the united states,” Eur. Urol. 62, 160–165 (2012). 10.1016/j.eururo.2012.03.052 [DOI] [PMC free article] [PubMed] [Google Scholar]
- 2.Desai B., “Update on kidney stones,” BMC Emerg. Med. 10–18 (2009); see http://www.emed-journal.com/fileadmin/qhi_archive/ArticlePDF/EM/041100010.pdf.19527500 [Google Scholar]
- 3.Clinic M., “Kidney Stones” (2009); see http://health.usnews.com/health-conditions/urology/kidney-stones/overview.
- 4.Kimberly J., Phillips K., Santago P., Perumpillichira J., Bechtold R., Pineau B., Vining D., and Bloomfeld R., “Extracolonic findings at virtual colonoscopy: An important consideration in asymptomatic colorectal cancer screening,” J. Gen. Intern. Med. 24, 69–73 (2009). 10.1007/s11606-008-0835-2 [DOI] [PMC free article] [PubMed] [Google Scholar]
- 5.Veerappan G., Ally M., Choi J., Pak J., Maydonovitch C., and Wong R., “Extracolonic findings on CT colonography increases yield of colorectal cancer screening,” AJR, Am. J. Roentgenol. 195, 677–686 (2009). 10.2214/AJR.09.3779 [DOI] [PubMed] [Google Scholar]
- 6.Pickhardt P., Kim D., Meiners R., Wyatt K., Hanson M., Barlow D., Cullen P., Remtulla R. A., and Cash B., “Colorectal and extracolonic cancers detected at screening CT colonography in 10,286 asymptomatic adults,” Radiology 255, 83–88 (2010). 10.1148/radiol.09090939 [DOI] [PubMed] [Google Scholar]
- 7.Yao J. and Burns J., “Extracolonic findings on ct colonography: Does the benefit outweigh the cost?,” Acad. Radiol. 20, 665–666 (2013). 10.1016/j.acra.2013.03.005 [DOI] [PubMed] [Google Scholar]
- 8.Zalis M., Barish M., Choi J., Dachman A., Fenlon H., Ferrucci J., Glick S., Laghi A., Macari M., McFarland E., Morrin M., Pickhardt P., Soto J., and Yee J., “CT colonography reporting and data system: A consensus proposal,” Radiology 236, 3–9 (2005). 10.1148/radiol.2361041926 [DOI] [PubMed] [Google Scholar]
- 9.Pickhardt P., Hanson M., Vanness D., Lo J., Kim D., Taylor A., Winter T., and Hinshaw J., “Unsuspected extracolonic findings at screening CT colonography: Clinical and ecconomic impact,” Radiology 249, 151–159 (2008). 10.1148/radiol.2491072148 [DOI] [PubMed] [Google Scholar]
- 10.Hellstrom M., Svensson M., and Lasson A., “Extracolonic and incidental findings on CT colonography (virtual colonoscopy),” AJR, Am. J. Roentgenol. 182, 631–638 (2004). 10.2214/ajr.182.3.1820631 [DOI] [PubMed] [Google Scholar]
- 11.Koh L., Ng F., and Ng K., “Outcomes of long-term follow-up of patients with conservative management of asymptomatic renal calculi,” BJU Int. 109, 622–625 (2012). 10.1111/j.1464-410X.2011.10329.x [DOI] [PubMed] [Google Scholar]
- 12.Edvardsson V., Indridason O., Haraldsson G., Kjatansson O., and Palsson R., “Temporal trends in the incidence of kidney stone disease,” Kidney Int. 83, 146–152 (2013). 10.1038/ki.2012.320 [DOI] [PubMed] [Google Scholar]
- 13.Burgher A., Beman M., Holtzman J., and Monga M., “Progression of nephrolithiasis: Long-term outcomes with observation of asymptomatic calculi,” J. Endourol. 18, 534–539 (2004). 10.1089/end.2004.18.534 [DOI] [PubMed] [Google Scholar]
- 14.Bandi G., Meiners R., Pickhardt P., and Nakada S., “Stone measurement by volumetric three-dimensional computed tomography for predicting the outcome after extracorporeal shock wave lithotripsy,” BJU Int. 103, 524–528 (2009). 10.1111/j.1464-410X.2008.08069.x [DOI] [PubMed] [Google Scholar]
- 15.Liden M., Andersson T., and Gejjer H., “Making renal stones change size-impact of CT image post processing and reader variability,” Eur. Radiol. 21, 2218–2225 (2011). 10.1007/s00330-011-2171-x [DOI] [PubMed] [Google Scholar]
- 16.Liden M., Andersson T., Broxvall M., Thunberg P., and Gejjer H., “Urinary stone size estimation: A new segmentation algorithm-based CT method,” Eur. Radiol. 22, 731–737 (2012). 10.1007/s00330-011-2309-x [DOI] [PubMed] [Google Scholar]
- 17.Patel S., Wells S., Ruma J., King S., Lubner M., Nakada S., and Pickhardt P., “Automated volumetric assessment by noncontrast computed tomography is more reproducible than manual linear size measurement,” Urology 186, 2275–2279 (2011). 10.1016/j.juro.2011.07.091 [DOI] [PubMed] [Google Scholar]
- 18.Appledorn S. V., Ball A., Patel V., Kim S., and Leveillee R., “Limitations of noncontrast CT for measuring ureteral stones,” J. Endourol. 17, 851–854 (2003). 10.1089/089277903772036127 [DOI] [PubMed] [Google Scholar]
- 19.Tublin M., Murphy M., Delong D., Tessler F., and Kliewer M., “Conspicuity of renal calculi at unenhanced CT: Effects of calculus composition and size and CT technique,” Radiology 225, 91–96 (2002). 10.1148/radiol.2251010242 [DOI] [PubMed] [Google Scholar]
- 20.Rosa M., Usai P., Miano R., Kim F., Agro E., Bove P., and Micali S., “Recent finding and new technologies in nephrolitiasis: A review of the recent literature,” BMC Urol. 13, 10 (2013). 10.1186/1471-2490-13-10 [DOI] [PMC free article] [PubMed] [Google Scholar]
- 21.Tamilselvi P. and Thangaraj P., “Computer aided diagnosis system for stone detection and early detection of kidney stones,” J. Comput. Sci. 7, 250–254 (2011). 10.3844/jcssp.2011.250.254 [DOI] [Google Scholar]
- 22.Tamilselvi P. and Thangaraj P., “An efficient segmentation of calculi from US renal calculi images using ANFIS system,” Eur. J. Sci. Res. 55, 323–333 (2011). [Google Scholar]
- 23.Tamilselvi P. and Thangaraj P., “Segmentation of calculi from ultrasound kidney images by region indicator with contour segmentation method,” Global J. Comput. Sci. Technol. 11, 43–51 (2011). [Google Scholar]
- 24.Shah S., Desai M., and Panchal I., “Identification of content descriptive parameters for classification of renal calculi,” Int. J. Signal Image Process. 1, 255–259 (2010). [Google Scholar]
- 25.Lee H., Kim K., Hwang S., Kim S., Byun S., Lee S., Hong S., Cho J., and Seong C., “Differentiation of urinary stone and vascular calcifications on non-contrast CT images: An initial experience using computer aided diagnosis,” J. Digital Imaging 23, 268–276 (2010). 10.1007/s10278-009-9181-0 [DOI] [PMC free article] [PubMed] [Google Scholar]
- 26.Chang C. and Lin C., “LIBSVM: A library for support vector machines,” ACM Trans. Intell. Syst. Technol. 2, 1–27 (2011). 10.1145/1961189.1961199 [DOI] [Google Scholar]
- 27.Ojala T., Pietikainen M., and Harwood D., “A comparative study of texture measures with classification based on feature distributions,” Pattern Recognit. 29, 51–59 (1996). 10.1016/0031-3203(95)00067-4 [DOI] [Google Scholar]
- 28.Dalal N. and Triggs B., “Histograms of oriented gradients for human detection,” in Proceedings of IEEE Conference on Computer Vision and Pattern Recognition (IEEE, San Diego, CA, 2005), pp. 886–893. [Google Scholar]
- 29.Liu J., Linguraru M., Wang S., and Summers R., “Automatic segmentation of kidneys from non-contrast CT images using efficient belief propagation,” Proc. SPIE 8670, 867005 (2013). 10.1117/12.2007738 [DOI] [Google Scholar]
- 30.Linguraru M., Sandberg J., Li Z., Shah F., and Summers R., “Automated segmentation and quantification of liver and spleen from CT images using normalized probabilistic atlases and enhancement estimation,” Med. Phys. 37, 771–783 (2010). 10.1118/1.3284530 [DOI] [PMC free article] [PubMed] [Google Scholar]
- 31.Yao J., Burns J., and Summers R., “Sclerotic rib metastases detection onroutine CT images,” in Proceedings of IEEE International Symposiumon Biomedical Imaging (ISBI) (IEEE, Barcelona, Spain, 2012), pp. 1767–1770. [Google Scholar]
- 32.Studholme C., Hill D., and Hawkes D. J., “An overlap invariant entropy measure of 3D medical image alignment,” Pattern Recognit. 32, 71–86 (1999). 10.1016/S0031-3203(98)00091-0 [DOI] [Google Scholar]
- 33.Rueckert D., Sonoda L., Hayes C., Hill D., Leach M., and Hawkes D., “Non-rigid registration using free-form deformations: Application to breast MR images,” IEEE Trans. Med. Imaging 18, 712–721 (1999). 10.1109/42.796284 [DOI] [PubMed] [Google Scholar]
- 34.Felzenszwalb P. and Huttenlocher D., “Efficient belief propagation for early vision,” Int. J. Comput. Vision 70, 41–54 (2006). 10.1007/s11263-006-7899-4 [DOI] [Google Scholar]
- 35.Caselles V., Kimmel R., and Sapiro G., “Geodesic active contours,” Int. J. Comput. Vision 22, 61–79 (1997). 10.1023/A:1007979827043 [DOI] [Google Scholar]
- 36.Perona P. and Malik J., “Scale-space and edge detection using anistropic diffusion,” IEEE Trans. Pattern Anal. Mach. Intell. 12, 629–639 (1990). 10.1109/34.56205 [DOI] [Google Scholar]
- 37.Black M., Sapiro G., Marimont D., and Heeger D., “Robust anisotropic diffusion,” IEEE Trans. Image Process. 7, 421–432 (1998). 10.1109/83.661192 [DOI] [PubMed] [Google Scholar]
- 38.Weickert J., Anisotropic Diffusion in Image Processing (ECMI Series, Teubner-Verlag, Stuttgart, Germany, 1998). [Google Scholar]
- 39.Brox T. and Weickert J., “A TV flow based local scale estimate and its application to texture discrimination,” J. Visual Commun. Image Representation 7, 1053–1073 (2006). 10.1016/j.jvcir.2005.06.001 [DOI] [Google Scholar]
- 40.Weickert J., ter Haar Romeny B., and Viergever M., “Efficient and reliable schemes for nonlinear diffusion filtering,” IEEE Trans. Image Process. 7, 398–410 (1998). 10.1109/83.661190 [DOI] [PubMed] [Google Scholar]
- 41.Thomas L., “Elliptic problems in linear difference equations over a network,” in Technial Report (Watson Scientific Computing Laboratory, Columbia University, New York, NY, 1949). [Google Scholar]
- 42.Ibanez L., Schroeder W., Ng L., and Cates J., The ITK Software Guide (Kitware, Inc., New York, NY, 2nd ed. 2005), http://www.itk.org/ItkSoftwareGuide.pdf. [Google Scholar]
- 43.Matas J., Chum O., Urban M., and Pajdla T., “Robust wide baseline stereo from maximally stable extremal regions,” in Proceedings of British Machine Vision Conference (Cardiff, UK, 2002), pp. 384–396. [Google Scholar]
- 44.Cortes C. and Vapnik V., “Support-vector networks,” Mach. Learn. 20, 273–297 (1995). 10.1023/A:1022627411411 [DOI] [Google Scholar]
- 45.Pickhardt P., Choi J., Hwang I., Butler J., Puckett M., Hildebrandt H., Wong R., Nugent P., Mysliwiec P., and Schindler W., “Computed tomographic virtual colonoscopy to screen for colorectal neoplasia in asymptomatic adults,” N. Engl. J. Med. 349, 2191–2200 (2003). 10.1056/NEJMoa031618 [DOI] [PubMed] [Google Scholar]
- 46.“Anatomy & physiology,” Boundless Learning, Inc. (2013).
- 47.Pyatykh S., Hesser J., and Zhang L., “Image noise level estimation by principal component analysis,” IEEE Trans. Image Process. 22, 687–699 (2013). 10.1109/TIP.2012.2221728 [DOI] [PubMed] [Google Scholar]
- 48.Hillis S., Berbaum K., and Metz C., “Recent developments in the Dorfman-Berbaum-Metz procedure for multireader ROC study analysis,” Acad. Radiol. 15, 647–661 (2009). 10.1016/j.acra.2007.12.015 [DOI] [PMC free article] [PubMed] [Google Scholar]
- 49.Miller N. and Lingeman J., “Management of kidney stones,” BMJ Br. Med. J. 334, 468–472 (2007). 10.1136/bmj.39113.480185.80 [DOI] [PMC free article] [PubMed] [Google Scholar]


