

Abstract
Biodiversities can differ substantially among different wastewater treatment plant (WWTP) communities. Whether differences in biodiversity translate into differences in the provision of particular ecosystem services, however, is under active debate. Theoretical considerations predict that WWTP communities with more biodiversity are more likely to contain strains that have positive effects on the rates of particular ecosystem functions, thus resulting in positive associations between those two variables. However, if WWTP communities were sufficiently biodiverse to nearly saturate the set of possible positive effects, then positive associations would not occur between biodiversity and the rates of particular ecosystem functions. To test these expectations, we measured the taxonomic biodiversity, functional biodiversity, and rates of 10 different micropollutant biotransformations for 10 full-scale WWTP communities. We have demonstrated that biodiversity is positively associated with the rates of specific, but not all, micropollutant biotransformations. Thus, one cannot assume whether or how biodiversity will associate with the rate of any particular micropollutant biotransformation. We have further demonstrated that the strongest positive association is between biodiversity and the collective rate of multiple micropollutant biotransformations. Thus, more biodiversity is likely required to maximize the collective rates of multiple micropollutant biotransformations than is required to maximize the rate of any individual micropollutant biotransformation. We finally provide evidence that the positive associations are stronger for rare micropollutant biotransformations than for common micropollutant biotransformations. Together, our results are consistent with the hypothesis that differences in biodiversity can indeed translate into differences in the provision of particular ecosystem services by full-scale WWTP communities.
INTRODUCTION
The microbial communities residing within wastewater treatment plants (WWTPs) provide ecosystem services that are important for maintaining the quality of our environment. They consume carbon-, nitrogen-, and phosphorous-containing substrates and biotransform organic pollutants present within WWTP influent (1, 2), thus mitigating the potentially deleterious effects of these chemicals on receiving waters. The ability to perform these ecosystem functions is to some extent related to the biodiversity present within WWTP communities (3). WWTP communities are estimated to contain many thousands of different microbial strains and to express tens of thousands of different genes (e.g., 4–7), thus providing a supply of functional traits that could enable and facilitate particular ecosystem functions.
While biodiversity is thought to be important for enabling and facilitating particular ecosystem functions (3), biodiversity can also differ substantially both among different WWTP communities (4, 5, 7, 8) and over time for a single WWTP community (9, 10). In one recent investigation, the taxonomic richness measurements among 10 full-scale WWTP communities differed by 4- to 6-fold (4). These differences in biodiversity underscore one of the most general and debated questions in ecology: how do differences in biodiversity translate into differences in the rate of a particular ecosystem function (11, 12)? Stated alternatively, what is the shape of the association between biodiversity and the rate of a particular ecosystem function? Determining the shape could be important for understanding why some WWTP communities perform a particular ecosystem function at higher rates than others. It could also be important for predicting how differences or changes in biodiversity are likely to affect the rate of that particular ecosystem function.
The emerging view from experiments with other types of communities is that the association between biodiversity and the rate of an ecosystem function is positive (11, 12) (Fig. 1). The positive association is thought to result from the accumulation of strains that have unique niche partitioning or facilitative interaction effects on a particular ecosystem function (i.e., complementarity effects) (11, 13, 14). Niche partitioning effects occur when different ecological niches are inhabited by different specialist strains rather than by any single generalist strain, and the collection of specialist strains achieves a greater aggregate rate of a particular ecosystem function than any single generalist strain. Facilitative interaction effects occur when the presence of some strains stimulates the activities of other strains (e.g., by providing growth-limiting nutrients, detoxifying local environments, etc.), thus leading to higher rates of a particular ecosystem function. The positive association could also result from sampling effects (11, 13, 14). Briefly, communities with more strains are more likely to contain strains that provide niche partitioning or facilitative interaction effects or have large trait values for a particular ecosystem function. Sampling effects not only could modify the rates of particular ecosystem functions but could also result in qualitatively different capabilities among different communities (i.e., sampling effects could affect the presence or absence of a particular ecosystem function).
FIG 1.
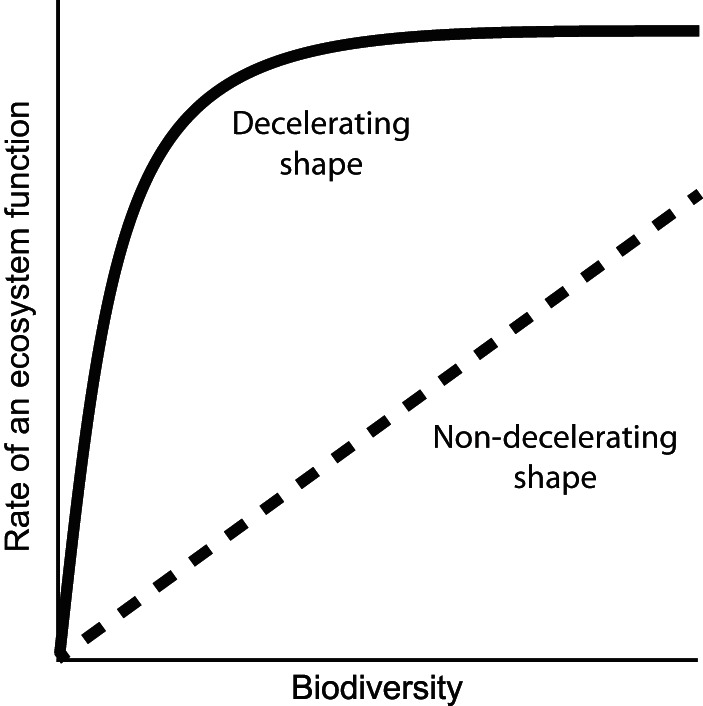
Possible shapes of the positive associations between biodiversity and the rates of particular ecosystem functions. A nondecelerating shape (dashed line) is expected when different strains have unique complementarity and sampling effects on that ecosystem function. A decelerating shape (solid line) is expected when different strains have, to some extent, functionally redundant complementarity and sampling effects on that ecosystem function.
While the association between biodiversity and the rate of a particular ecosystem function is thought to be positive, the association could have one of two different shapes (11, 12) (Fig. 1). A nondecelerating shape is expected when different strains have complementarity and sampling effects that are unique rather than the same as those of other strains (Fig. 1, dashed line). This might occur if there were far less biodiversity present than would be needed to begin saturating the set of possible positive effects. Conversely, a decelerating shape is expected when different strains have to some extent the same complementarity and sampling effects as other strains (i.e., functionally redundant effects) (Fig. 1, solid line). This would occur if there were sufficient biodiversity present to begin saturating the set of possible positive effects. An important consequence of deceleration is that at some point, differences in biodiversity might no longer translate into differences in the rate of that particular ecosystem function (Fig. 1, far right region of the solid line).
While both nondecelerating and decelerating associations have been observed for some types of ecosystem functions and microbial communities (e.g., see references 3 and 15 to 18), associations have not been observed for other types (e.g., see references 19 to 21). Moreover, the associations among full-scale WWTP communities remain largely unexplored. It is plausible that full-scale WWTP communities are sufficiently biodiverse to nearly saturate the set of possible complementarity and sampling effects for a particular ecosystem function. If this were the case, then a decelerating association would be expected, and differences in biodiversity might not translate into differences in the rate of that particular ecosystem function (Fig. 1, far right region of the solid line). On the other hand, full-scale WWTPs contain considerable spatial, temporal, and resource heterogeneity, thus providing a large set of possible complementarity and sampling effects. It is therefore plausible that full-scale WWTPs are insufficiently biodiverse to substantially saturate the set of possible complementarity and sampling effects. If this were the case, then a nondecelerating association might be expected, and differences in biodiversity would translate into differences in the rate of that particular ecosystem function (Fig. 1, dashed line). Indeed, recent studies demonstrated that nondecelerating associations are more likely to occur as spatial and temporal heterogeneity increase (e.g., see references 16, 17, and 22).
Our main objective was to test for and measure the shapes of the associations between biodiversity and the rates of 10 different micropollutant biotransformations among 10 independent and full-scale WWTP communities, thus addressing an important gap in our knowledge about their ecology and functioning. We use the term micropollutant to refer to a synthetic organic chemical that is present at trace concentrations in WWTP influent (23). We previously measured the rate at which each WWTP community biotransforms each micropollutant (24). In parallel, we measured the taxonomic and functional biodiversity of each WWTP community from bacterial 16S rRNA and mRNA sequence reads, respectively (4). In this study, we tested for associations between different aspects of biodiversity and the rates of each individual micropollutant biotransformation. We then asked whether a decelerating or nondecelerating shape more accurately describes each of the observed positive associations. We finally proposed a hypothesis and obtained evidence for why the positive associations are stronger for some micropollutant biotransformations and weaker for others.
MATERIALS AND METHODS
WWTP communities and biotransformation rate constants.
We previously collected WWTP communities from 10 independent and full-scale WWTPs located across north-central Switzerland. We sampled each WWTP using a standardized protocol (24). Briefly, we collected 1 liter of activated sludge directly from the biological aeration basin of the WWTP, transported the activated sludge to the laboratory in a loosely capped 2-liter amber glass bottle, and added a magnetic stir bar to the 2-liter bottle immediately upon arrival at the laboratory.
We initiated a biotransformation experiment with each WWTP community within 3 h of collecting the activated sludge samples from the WWTP (24). We dissolved a defined mixture of 10 micropollutants in methanol to obtain a stock concentration of 100 mg per liter of each micropollutant, added 70 μl of the stock mixture into empty triplicate-stirred batch reactors, and allowed the methanol to completely evaporate. We next seeded the batch reactors with 70 ml of activated sludge to obtain an initial concentration of 100 μg per liter of each micropollutant (24). We then periodically removed 2-ml liquid samples from the stirred batch reactors over 4 days, filtered the liquid samples using a glass-fiber filter, stored the liquid samples at 4°C, and analyzed the samples using high-performance liquid chromatography-mass spectrometry (HPLC-MS) chemical analyses (24). We performed abiotic controls in parallel using twice-autoclaved activated sludge (24). We quantified the biologically mediated rate of disappearance of each micropollutant and determined the observed first-order rate constant using Bayesian parameter inference and Monte Carlo sampling as previously described (24). We normalized the biotransformation rate constants to empirical estimates of active biomass as described by Majewsky and colleagues (25) (see Table S1 in the supplemental material). We further normalized the biotransformation rate constants to total suspended solids (TSS) and obtained qualitatively similar outcomes. Because active biomass and TSS normalization generated qualitatively similar results, we only present data using active biomass normalization for the remainder of the article.
RNA sample collection and processing.
We collected 1.5-ml liquid samples for RNA analyses from each of the WWTP communities at 2 h after mixing the WWTP communities with the micropollutants (4). We analyzed RNA rather than DNA because RNA analyses consider only metabolically active strains and transcriptionally expressed genes, thus excluding metabolically inactive strains and nonexpressed genes, which are unlikely to have contributed to the measured micropollutant biotransformations. We collected samples for RNA analyses at 2 h for three reasons. First, 2 h provided time for the WWTP communities to respond to the addition of the micropollutants. Second, because the micropollutants were typically biotransformed without an observable lag period and followed first-order kinetics, 2 h coincided with a rapid period of micropollutant biotransformation. Third, the micropollutants were not completely biotransformed after 2 h (24). We provide full descriptions of the RNA isolation and purification methods elsewhere (4).
Preparation, sequencing, and analysis of bacterial 16S rRNAs.
We reverse transcribed bacterial 16S rRNAs, amplified the B27F-B534R region of the reverse transcription products, and sequenced the reverse transcription products using the 454-GS FLX platform (Roche 454 Life Sciences, Branford, CT, USA) as described elsewhere (4). All of the resulting 16S rRNA sequence reads are publically available in the NCBI Sequence Read Archive (see below). We analyzed the 16S rRNA sequence reads using mothur software (26) and assigned those reads that passed all of the quality control steps into operational taxonomic units (OTUs) using a sequence similarity threshold of 97%. We chose 97% because this threshold has been widely used in comparable studies and reduces the probability that sequencing errors could lead to artifactual estimates of biodiversity. We provide a full description of the 16S rRNA sequencing methods and quality control parameters elsewhere (4).
Preparation, sequencing, and analysis of mRNAs.
We enriched mRNAs and sequenced the enriched mRNAs using the HiSeq2000 platform (Illumina, San Diego, CA, USA) as described elsewhere (4). All of the resulting mRNA sequence reads are publically available in the MG-RAST database (see below). We analyzed the mRNA sequence reads using the MG-RAST metagenomics analysis server (version 3.2) (27) and assigned those reads that passed all of the quality control steps into level 3 SEED subsystems functional categories (28). We provide a full description of the mRNA sequencing methods, quality control parameters, and annotation parameters elsewhere (4).
Biodiversity measurements.
Prior to measuring biodiversity, we corrected for differences in sequencing depth across the 10 WWTP communities by rarefying the 16S rRNA sequence reads that were assigned to OTUs to 2,500 and the mRNA sequence reads that were assigned to level 3 functional categories to 300,000. We measured the observed richness of each WWTP community as the observed number of unique OTUs or unique level 3 functional categories. We measured the Chao1 extrapolated richness (29), the abundance-based coverage estimation (ACE) extrapolated richness (29, 30), the Shannon diversity, and the Shannon evenness of each WWTP community from the same sets of OTUs or level 3 functional categories. We reported the Shannon diversity and Shannon evenness measurements in terms of the Hill numbers H1 and H0, which provide more intuitive interpretations of the measurements (31). All of the reported biodiversity measurements are the average values from 1,000 independently rarefied 16S rRNA or mRNA sequence read data sets. We further rarefied the 16S rRNA sequence reads that were assigned to OTUs to 1,000, 1,500, and 2,000 and found that the rank orderings of the biodiversity indices were identical to those when we rarefied the16S rRNA sequence reads to 2,500 (data not shown). We therefore present only the data obtained when we rarefied the 16S rRNA sequence reads to 2,500. We performed rarefaction and calculated all biodiversity measurements in the R software environment (32) using functions from the vegan package (33).
Micropollutant multifunctionality measurements.
We measured the collective rates of multiple micropollutant biotransformations using the multifunctionality measure described by Zavaleta and colleagues (34). Briefly, we scaled the rate constants for each individual micropollutant biotransformation to an average value of 0 and a standard deviation of 1. We then calculated micropollutant multifunctionality as the average value of the scaled rate constants among the 10 individual micropollutant biotransformations. The advantages and limitations of this measure of multifunctionality have been discussed in detail elsewhere (34, 35).
Linear and logarithmic models.
We fit linear (y = [m × x] + b) and logarithmic (y = [m × LN(x)] + b) models to the biodiversity measurements in order to gain insight into the underlying relationships between biodiversity and micropollutant biotransformations, where the dependent variable y is the rate constant for an individual micropollutant or micropollutant multifunctionality, the independent variable x is a measure of biodiversity, m is the slope, and b is the intercept. We fit each model, estimated the model parameters, and calculated the coefficient of determination (R2) and the root mean squared error (RMSE) in the R software environment using functions from the stats package (32).
Bioinformatic analyses.
We used the UM-BBD database (36) to predict sets of bacterial enzymes that could hypothetically catalyze each of the experimentally measured micropollutant biotransformations. We used the NCBI protein search tool (www.ncbi.nlm.nih.gov/protein/) to retrieve all taxonomically identified protein sequences for each predicted enzyme. We performed the protein search across eight publically available sequence databases (RefSeq, GenBank, EMBL, DDBJ, PDB, UniProtKB/Swiss-Prot, PIR, and PRF).
Statistical methods.
Because the underlying distributions of our measurements are unknown, we used nonparametric methods for all of our statistical hypothesis tests. We used the two-sided Spearman rank correlation test to test whether the biodiversity measurements associate with the rate constants of each individual micropollutant biotransformation or with micropollutant multifunctionality. We used the Benjamini-Hochberg method to account for multiple comparisons (37). We used the one-sample two-sided Wilcoxon test to test whether the Spearman rank correlation coefficients of all 10 of the individual micropollutant biotransformations significantly deviate from zero and whether the values of R2linear − R2logarithmic significantly deviate from zero. For the last two tests, we assumed that the individual micropollutant biotransformations are independent of each other (see Results). We performed all of the statistical tests in the R environment using functions from the stats package (32).
Accession numbers.
The 16S rRNA sequence reads obtained in this work are publically available in the NCBI Sequence Read Archive (http://www.ncbi.nlm.nih.gov/sra) under BioProject number PRJNA232662. mRNA sequence reads are publically available in the MG-RAST database under project number 6015 (http://metagenomics.anl.gov/).
RESULTS
Micropollutant biotransformation measurements.
We previously measured the rates of 10 different micropollutant biotransformations by 10 independent and full-scale WWTP communities (24). We selected the WWTPs in order to obtain a set with substantial differences in their environmental and operational metrics, including total suspended solids, solid retention time, and influent source (24). We postulated that greater differences in those metrics would translate into greater differences in biodiversity and in turn into greater differences in the rates of micropollutant biotransformations. We summarized the environmental and operational metrics for each WWTP in Table S2 in the supplemental material and elsewhere (24). We selected the micropollutants to have diverse chemical structures and to putatively undergo different types of biotransformations (24). We summarized the experimentally observed biotransformation types and biotransformation products for each micropollutant in Table S3 and elsewhere (24). We measured the rate of each micropollutant biotransformation as the active biomass-normalized first-order rate constant (liters g−1 day−1) (see Table S1). We used active biomass normalization because the biodiversity measurements were obtained for a fixed number of 16S rRNA or mRNA sequence reads, which are themselves surrogate measures of active biomass (38, 39).
Taxonomic biodiversity and individual micropollutant biotransformations.
We first tested for associations between the taxonomic richness aspect of biodiversity and the rates of each individual micropollutant biotransformation. To accomplish this, we assigned the previously analyzed 16S rRNA sequence reads into operational taxonomic units (OTUs) using a sequence similarity threshold of 97% (4). We then measured the observed taxonomic richness of each WWTP community as the observed number of unique OTUs among 2,500 randomly sampled 16S rRNA sequence reads. We additionally measured the extrapolated taxonomic richness of each WWTP community using the Chao1 and abundance-based coverage estimation (ACE) indices (29, 30) from the same 2,500 randomly sampled 16S rRNA sequence reads. We summarized the taxonomic richness measurements in Table 1. We then used the Spearman rank correlation test to test whether the taxonomic richness measurements associate with the rate constants for each individual micropollutant biotransformation. This is a nonparametric test that does not make any assumptions about the underlying shape of the association; it is therefore valid for both nondecelerating and decelerating associations (Fig. 1). We plotted the taxonomic richness measurements against the rate constants for each individual micropollutant biotransformation in Fig. S1 to S3 in the supplemental material. We summarized the Spearman rank correlation coefficients in Fig. 2A.
TABLE 1.
Biodiversity measurements for each full-scale wastewater treatment plant community
| Biodiversity measurementa | Value for full-scale wastewater treatment plant |
|||||||||
|---|---|---|---|---|---|---|---|---|---|---|
| DOM1 | DOM2 | DOM3 | DOM4 | DOM5 | IND1 | IND2 | IND3 | IND4 | IND5 | |
| Observed taxonomic richness | 906 | 821 | 1,057 | 535 | 1,014 | 474 | 592 | 680 | 481 | 230 |
| Chao1 extrapolated taxonomic richness | 2,020 | 1,729 | 2,703 | 1,135 | 2,630 | 1,064 | 1,344 | 1,596 | 1,185 | 487 |
| ACE extrapolated taxonomic richness | 1,352 | 1,209 | 1,759 | 774 | 1,680 | 670 | 857 | 1,058 | 754 | 327 |
| Shannon taxonomic diversity (H1)b | 401 | 349 | 529 | 137 | 421 | 108 | 147 | 108 | 75 | 22 |
| Shannon taxonomic evenness (H1/H0)b | 0.442 | 0.426 | 0.501 | 0.256 | 0.415 | 0.228 | 0.248 | 0.159 | 0.156 | 0.097 |
| Observed functional richness | 984 | 992 | 1,005 | 883 | 957 | 909 | 939 | 914 | 908 | 904 |
| Chao1 extrapolated functional richness | 1,010 | 1,044 | 1,047 | 935 | 1,006 | 952 | 986 | 981 | 961 | 953 |
| ACE extrapolated functional richness | 994 | 1,010 | 1,019 | 900 | 973 | 923 | 954 | 932 | 923 | 920 |
All biodiversity measurements are the average values from 1,000 independently rarefied 16S rRNA or mRNA sequence read data sets.
Shannon taxonomic diversity and Shannon taxonomic evenness are reported in terms of the Hill numbers H1 and H0 (31).
FIG 2.

Spearman rank correlation coefficients for the associations between different aspects of biodiversity and the rate constants for each individual micropollutant biotransformation or micropollutant multifunctionality. The tested aspects of biodiversity include observed taxonomic richness, Chao1 extrapolated taxonomic richness, and ACE extrapolated taxonomic richness (A) and observed taxonomic richness, Shannon taxonomic diversity, and Shannon taxonomic evenness (B). *, Benjamini-Hochberg-adjusted two-sided P value < 0.05 for individual micropollutant biotransformations or two-sided P value < 0.05 for micropollutant multifunctionality.
We observed significant positive associations between the taxonomic richness aspect of biodiversity and the rates of specific individual micropollutant biotransformations, regardless of whether we used observed or extrapolated measures of taxonomic richness. This is based on two lines of evidence. First, the Spearman rank correlation coefficients are themselves significant and positive for 6 of the 10 individual micropollutant biotransformations (Fig. 2A) (Benjamini-Hochberg-adjusted two-sided P value of <0.05). Second, when all 10 of the individual micropollutant biotransformations are considered together, the Spearman rank correlation coefficients are more often positive than one would expect by chance (Fig. 2A) (one-sample Wilcoxon test, two-sided P value of 0.0039). These outcomes would only be expected if differences in taxonomic richness tend to translate into differences in the rates of specific individual micropollutant biotransformations. Taken together, our data indicate that WWTP communities with greater taxonomic richness are indeed more likely to biotransform specific individual micropollutants at higher rates.
We next tested for associations between the Shannon taxonomic diversity and Shannon taxonomic evenness aspects of biodiversity and the rate of each individual micropollutant biotransformation. As opposed to taxonomic richness, these aspects of biodiversity consider the proportional abundances of different taxa and place less weight on low-abundance taxa (40). We measured Shannon taxonomic diversity and Shannon taxonomic evenness using the same 2,500 randomly sampled 16S rRNA sequence reads that we used for measuring taxonomic richness. We summarized the Shannon taxonomic diversity and Shannon taxonomic evenness measurements in Table 1 and plotted the measurements against the rate constants for each individual micropollutant biotransformation in Fig. S4 and S5 in the supplemental material, respectively. We summarized the Spearman rank correlation coefficients in Fig. 2B and replotted the Spearman rank correlation coefficients for observed taxonomic richness to facilitate comparison.
We observed two important outcomes. First, the Spearman rank correlation coefficients for Shannon taxonomic diversity and Shannon taxonomic evenness are significant and positive for fewer of the individual micropollutant biotransformations than for observed taxonomic richness (Fig. 2) (Benjamini-Hochberg-adjusted two-sided P value of <0.05). Second, the median values of the Spearman rank correlation coefficients among all 10 of the individual micropollutant biotransformations are smaller for Shannon taxonomic diversity (0.63) and Shannon taxonomic evenness (0.61) than for observed taxonomic richness (0.70). Thus, the positive associations between biodiversity and the rates of individual micropollutant biotransformations appear to weaken when the proportional abundances of taxa are considered and less weight is placed on low-abundance taxa. Our data therefore lead to the hypothesis that low-abundance taxa are important for determining the rates of specific—but not necessarily all—individual micropollutant biotransformations.
Taxonomic biodiversity and multiple micropollutant biotransformations.
While investigating individual micropollutant biotransformations is important for understanding the underlying relationships between biodiversity and the rates of ecosystem functions, the preferred outcome of wastewater treatment is typically not to remove any single micropollutant. Instead, the preferred outcome is typically to remove a large number and wide variety of different micropollutants. We therefore next tested for positive associations between the different aspects of biodiversity and the collective rates of multiple micropollutant biotransformations. To accomplish this, we measured the collective rate of multiple micropollutant biotransformations using the multifunctionality measure proposed by Zavaleta and colleagues (34). We summarized the micropollutant multifunctionality measurements in Table S4 in the supplemental material. We plotted the observed taxonomic richness, extrapolated taxonomic richness, Shannon taxonomic diversity, and Shannon taxonomic evenness measurements against the micropollutant multifunctionality measurements in Fig. 3. We summarized the Spearman rank correlation coefficients in Fig. 2.
FIG 3.

Association between observed taxonomic richness (A), Chao1 extrapolated taxonomic richness (B), ACE extrapolated taxonomic richness (C), Shannon taxonomic diversity (D), or Shannon taxonomic evenness and micropollutant multifunctionality (E). The solid lines are the best-fit linear models, and the dashed lines are the best-fit logarithmic models.
We observed significant positive associations between all of the measured aspects of biodiversity and the collective rates of multiple micropollutant biotransformations (Fig. 3). The Spearman rank correlation coefficients are always significant and positive (Fig. 2) (two-sided P value of ≤0.016). Moreover, the Spearman rank correlation coefficients are typically larger than or equal in magnitude to the largest Spearman rank correlation coefficient among the individual micropollutant biotransformations (Fig. 2). Thus, the positive associations for the collective rates of multiple micropollutant biotransformations are typically stronger than or as strong as the positive associations for the rates of individual micropollutant biotransformations. Furthermore, the positive associations for the collective rates of multiple micropollutant biotransformations are weaker when the proportional abundances of taxa are considered and less weight is placed on low-abundance taxa (i.e., they are smaller for Shannon taxonomic diversity and Shannon taxonomic evenness than for taxonomic richness) (Fig. 2B). Thus, low-abundance taxa are also likely important for determining the collective rates of multiple micropollutant biotransformations.
Shapes of the observed associations.
We next sought to gain insight into the underlying shapes of the observed positive associations. More specifically, we determined whether a nondecelerating or decelerating model explains more of the variance and enables more accurate predictions for the rates of individual or collective rates of multiple micropollutant biotransformations. To accomplish this, we used a linear model to describe a nondecelerating shape and a logarithmic model to describe a decelerating shape as proposed by Bell and colleagues (15). We fit the models to the micropollutant biotransformation measurements as a function of biodiversity and plotted the best-fit models in Fig. S1 to S5 in the supplemental material and Fig. 3. We summarized the best-fit models in Table S5. We then calculated the differences between the coefficients of determination for the best-fit linear and best-fit logarithmic models (R2linear − R2logarithmic) (Fig. 4). Thus, a positive difference indicates that the best-fit linear model explains more of the variance than the best-fit decelerating model. We further calculated the differences between the root mean squared errors for the best-fit linear and best-fit logarithmic models (RMSElinear − RMSElogarithmic) (see Fig. S6). Thus, a negative difference indicates that the best-fit linear model generates more accurate predictions than the best-fit logarithmic model. We excluded the biotransformation of diazinon from the analyses because the slopes of the best-fit linear and best-fit logarithmic models were always negative (see Table S5).
FIG 4.

The difference between the coefficients of determination for the best-fit linear and best-fit logarithmic models (R2linear − R2logarithmic) between biodiversity (independent variable x) and the rate constants for individual micropollutant biotransformations or micropollutant multifunctionality (dependent variable y).
We were unable to detect a common shape for the associations between biodiversity and the rates of individual micropollutant biotransformations. This is based on two observations. First, among all of the individual micropollutant biotransformations, one type of model does not generally explain more of the variance (Fig. 4) or enable more accurate predictions (see Fig. S6 in the supplemental material). Linear models are marginally more effective for four of the individual micropollutant biotransformations (biotransformations of azoxystrobin, isoproturon, trinexepac ethyl, and venlafaxine), logarithmic models are marginally more effective for two of the individual micropollutant biotransformations (biotransformations of atenolol and valsartan), and neither model is clearly more effective than the other for three of the individual micropollutant biotransformations (biotransformations of ethofumesate, propachlor, and ranitidine) (Fig. 4; see also Fig. S6). Second, the values of R2linear − R2logarithmic among all of the individual micropollutant biotransformations do not significantly deviate from zero (one-sample Wilcoxon test, two-sided P value of >0.25). This is true regardless of the specific aspect of biodiversity that is considered. It is also true regardless of whether all of the individual micropollutant biotransformations are considered or only those individual micropollutant biotransformations that had both significant and positive Spearman correlation coefficients (Benjamini-Hochberg-adjusted two-sided P value of <0.05).
As opposed to the rates of individual micropollutant biotransformations, we detected clear nondecelerating shapes for the positive associations between biodiversity and the collective rates of multiple micropollutant biotransformations (Fig. 3). The best-fit linear models consistently explain more of the variance and enable more accurate predictions of micropollutant multifunctionality than the best-fit logarithmic models (Fig. 4; see also Fig. S6 in the supplemental material). Thus, at the levels of biodiversity that are present within full-scale WWTP communities, the positive associations between biodiversity and the collective rates of multiple micropollutant biotransformations do not appear to decelerate (Fig. 3).
Rarity of micropollutant biotransformations.
We next asked why the positive associations between biodiversity and the rates of individual micropollutant biotransformations are stronger for some micropollutant biotransformations (e.g., venlafaxine) and weaker for others (e.g., trinexepac ethyl) (Fig. 2A). We hypothesized that the rarity of the micropollutant biotransformation (i.e., the number of different taxa that perform the biotransformation) is an important determinant. As a micropollutant biotransformation becomes increasingly rare, the probability that the set of possible complementarity and sampling effects is saturated should decrease, thus leading to a stronger positive association. To provide a first test of this hypothesis, we used the database UM-BBD (36) to identify bacterial enzymes that are predicted to perform each of the experimentally observed biotransformations (see Table S6 in the supplemental material). We next retrieved all publically available and taxonomically identified protein sequences for each predicted bacterial enzyme and quantified how many different bacterial taxa are predicted to perform each micropollutant biotransformation (Table 2). This quantity provides an estimate of how rare each micropollutant biotransformation is. We found that the positive associations for the observed taxonomic richness, extrapolated taxonomic richness, and Shannon taxonomic diversity measurements are indeed significantly stronger for rare micropollutant biotransformations than for common micropollutant biotransformations (Spearman rank correlation coefficients < −0.65; P < 0.05), thus providing evidence for this hypothesis.
TABLE 2.
Numbers of different bacterial taxa that are predicted to perform each of the experimentally observed micropollutant biotransformations
| Micropollutant | Experimentally observed biotransformationa | No. of different bacterial taxa predicted to perform biotransformationb |
|---|---|---|
| Atenolol | Amide hydrolysis | 4,516 |
| Azoxystrobin | Carboxylic acid ester hydrolysis | 3,894 |
| Diazinon | Aromatic thiophosphate hydrolysis | 2,56 |
| Ethofumesate | Ether dealkylation | 131 |
| Isoproturon | Urea dealkylation and urea didealkylation | 0 |
| Propachlor | Glutathione coupling, dehalogenation, and halosubstitution | 939 |
| Ranitidine | S-oxidation and N-oxidation | 8 |
| Trinexepac ethyl | Carboxylic acid ester hydrolysis | 3,894 |
| Valsartan | Amide dealkylation | 0 |
| Venlafaxine | Amine dealkylation and ether dealkylation | 68 |
The experimentally observed biotransformation types and biotransformation products were reported previously by Helbling et al. (24).
The NCBI protein search tool was used to search eight publically available sequence databases and retrieve all taxonomically assigned protein sequences for each UM-BBD-predicted enzyme.
Functional biodiversity and micropollutant biotransformations.
The complementarity and sampling effects that give rise to positive associations are not directly caused by taxa but are instead caused by the phenotypes expressed by those taxa (41). These phenotypes could emerge via the expression of a wide range of different functions, including metabolic, motility, regulation, cell signaling, resistance, and stress response functions. Thus, we expect that the number of functions expressed by a WWTP community (i.e., functional richness) should also positively associate with the rates of individual and the collective multiple micropollutant biotransformations. Yet to our knowledge, this expectation has not been extensively tested. To test this, we measured the observed and extrapolated functional richness of each WWTP community from 300,000 randomly sampled and functionally annotated mRNA sequence reads that were assigned to level 3 functional categories. We summarized the functional richness measurements in Table 1. We then used the Spearman rank correlation test to test for associations between the functional richness measurements and the rate constants for each individual micropollutant biotransformation or for micropollutant multifunctionality. We summarized the Spearman rank correlation coefficients in Fig. 5.
FIG 5.

Spearman rank correlation coefficients for the associations between different aspects of functional richness and the rate constants for each individual micropollutant biotransformation or micropollutant multifunctionality. The tested aspects of functional richness include observed functional richness, Chao1 extrapolated functional richness, and ACE extrapolated functional richness. *, Benjamini-Hochberg-adjusted two-sided P < 0.05 for individual micropollutant biotransformations or two-sided P < 0.05 for micropollutant multifunctionality.
We observed two important outcomes. First, as with taxonomic richness, the Spearman rank correlation coefficients for functional richness are themselves significant and positive for both the rate constants of specific individual micropollutant biotransformations (Fig. 5) (Benjamini-Hochberg-adjusted two-sided P value of <0.05) and for micropollutant multifunctionality (Fig. 5) (two-sided P value of <0.003). Second, when considering all 10 of the individual micropollutant biotransformations together, the Spearman rank correlation coefficients are more often positive than one would expect by chance (Fig. 5) (one-sample Wilcoxon test, two-sided P < 0.006). Thus, our data indicate that WWTP communities with greater functional richness are also more likely to biotransform specific individual and multiple micropollutants at higher rates.
Independence of micropollutant biotransformations.
A key assumption of our experimental design is that each individual micropollutant biotransformation is independent of the others (i.e., each individual micropollutant biotransformation is performed by a different set of enzymes). This assumption is necessary, for example, to test whether the distributions of the Spearman rank correlation coefficients among all 10 of the individual micropollutant biotransformations significantly deviate from zero. To test their independence, we used a combination of bioinformatic and empirical approaches. We first analyzed the sets of bacterial enzymes that were predicted by the UM-BBD (36) to catalyze each of the experimentally measured micropollutant biotransformations (see Table S6 in the supplemental material). We found that unique sets of enzymes are predicted to biotransform six of the 10 individual micropollutants (see Table S6), thus providing bioinformatic support that these biotransformations are independent of each other. Of the remaining four, an identical set of enzymes is predicted to biotransform both azoxystrobin and trinexepac ethyl (see Table S6). However, the rate constants for these micropollutant biotransformations are not related to each other (Spearman rank correlation coefficient = 0.21; two-sided P > 0.50), thus providing empirical support that they are also independent of each other. Finally, an identical set of enzymes is predicted to biotransform both isoproturon and valsartan (see Table S6). In this case, we previously demonstrated that acetylene, which is an inhibitor of monooxygenase activity, completely eliminates the biotransformation of isoproturon but has no effect on the biotransformation of valsartan (24), thus providing empirical support that these micropollutant biotransformations are also independent of each other. In conclusion, our assumption that the different micropollutant biotransformations are independent of each other is supported by bioinformatic or empirical evidence.
DISCUSSION
Our results revealed important insights into how differences in biodiversity translate into differences in the rates of micropollutant biotransformations among full-scale WWTP communities. While we observed significant and positive associations between biodiversity and the rates of some individual micropollutant biotransformations, the associations do not share a shape. Some associations are better described with a nondecelerating shape, while others are better described with a decelerating shape (Fig. 2 and 4). Thus, for any individual micropollutant biotransformation, one cannot naively assume whether and how differences in biodiversity will translate into differences in the rate of that ecosystem function. This outcome is consistent with those observed for comparable investigations of other types of microbial communities (e.g., see references 19 and 20).
While we were unable to identify a common shape for the positive associations between biodiversity and the rates of individual micropollutant biotransformations, we found that there is a clear nondecelerating shape for the positive association between biodiversity and the collective rates of multiple micropollutant biotransformations (Fig. 3 and 4). The absence of apparent deceleration suggests that greater levels of biodiversity are likely required to maximize the collective rate of multiple micropollutant biotransformations than are typically required to maximize the rate of any individual micropollutant biotransformation. In other words, WWTPs are insufficiently biodiverse to saturate the set of possible complementarity and sampling effects when multiple micropollutant biotransformations are considered. Thus, engineering strategies that maximize biodiversity could be particularly effective when the preferred outcome of wastewater treatment is the removal of a large number of different micropollutants. While there are only few comparable investigations of associations between biodiversity and multifunctionality among microbial communities (e.g., see references 42 and 43), this outcome is consistent with the outcomes observed for comparable investigations of plant communities (34, 35).
An important question that emerges from our investigation is why the observed positive associations are stronger for some micropollutant biotransformations than for others (Fig. 2). We tested the hypothesis that the strength of the positive association depends, at least in part, on the rarity of the particular micropollutant biotransformation. As a micropollutant biotransformation becomes increasingly rare, the probability that the set of possible complementarity and sampling effects is saturated should decrease, thus leading to a stronger positive association. Our estimates of the rarity of each micropollutant biotransformation are consistent with this hypothesis and therefore provide a first test of one of its main predictions. Such a hypothesis could reflect a general rule that has important applications beyond wastewater treatment. For example, it could be used to make specific predictions about how changes or differences in biodiversity are likely to affect the rates of particular types of ecosystem functions.
An important aspect of our experimental design is that all of the investigated full-scale WWTPs had differences in their operational and environmental metrics (see Table S2 in the supplemental material). One consequence of this aspect is that we cannot unequivocally test whether the observed positive associations resulted from causal linkages between biodiversity and the rates of particular micropollutant biotransformations. Nevertheless, we have two lines of indirect evidence that the observed positive associations do indeed result from causal linkages between these two variables. First, the positive associations are stronger for rare micropollutant biotransformations and weaker for common micropollutant biotransformations. If biodiversity were causally linked with the rates of particular micropollutant biotransformations, we would expect this relationship (see the discussion above). If biodiversity were not causally linked with the rates of particular micropollutant biotransformations, we would not expect any relationship between the strengths of the positive associations and the rarity of the measured micropollutant biotransformations, which is inconsistent with our observations. Second, we previously could not explain differences in the rates of particular micropollutant biotransformations by differences in any of the operational metrics of the WWTPs (24). Thus, a causal linkage between biodiversity and the rates of particular micropollutant biotransformations provides a plausible and parsimonious explanation for our results.
Our experimental design also allows us to address an important and largely unexplored gap in our knowledge about biodiversity: can we translate biodiversity-ecosystem functioning relationships derived from carefully controlled laboratory experiments into real-world applications (12, 22)? Consider that, in the natural environment, environmental conditions can differ dramatically across small spatial and temporal scales. The consequence is that for any set of real-world microbial communities (including full-scale WWTP communities), there is inherent uncertainty about differences in the environmental conditions from which those microbial communities were collected. If these differences in environmental conditions have opposite effects on the rates of micropollutant biotransformations from those of biodiversity, then the expected positive associations might be obscured and biodiversity would consequently be of limited predictive value. Our results suggest that this is not the case. Even though the 10 WWTPs had differences in their operational metrics, we were nevertheless able to observe the expected positive associations between biodiversity and the rates of individual and multiple micropollutant biotransformations (Fig. 2 and 3). Our results therefore suggest that biodiversity-ecosystem functioning relationships can indeed be of utility for predicting how differences in biodiversity translate into differences in the rates of micropollutant biotransformations among real-world WWTP communities.
In conclusion, we report three main outcomes that improve our general knowledge about the ecology and functioning of full-scale WWTP communities. First, differences in biodiversity translate into differences in the rates of specific individual micropollutant biotransformations. Second, there is a nondecelerating shape for the positive associations between biodiversity and the collective rate of multiple micropollutant biotransformations. Biodiversity is therefore likely to be particularly important for the removal of a large number and wide variety of different micropollutants. Finally, we present evidence for a potential general rule that determines how strongly biodiversity is likely to associate with the rates of different types of micropollutant biotransformations, which could have applications that extend well beyond wastewater treatment.
Supplementary Material
ACKNOWLEDGMENTS
We thank Tom Curtis, Eberhard Morgenroth, Johanna Otto, Jan Roelof van der Meer, George Wells, and Paul Wilmes for useful discussions and for critically reading preliminary versions of the manuscript.
This work was supported by grants from Eawag (category: Seed) and the Korean-Swiss Science and Technology Cooperation.
Footnotes
Supplemental material for this article may be found at http://dx.doi.org/10.1128/AEM.03286-14.
REFERENCES
- 1.Oulton RL, Kohn T, Cwiertny DM. 2010. Pharmaceuticals and personal care products in effluent matrices: a survey of transformation and removal during wastewater treatment and implications for wastewater management. J Environ Monit 12:1956–1978. doi: 10.1039/c0em00068j. [DOI] [PubMed] [Google Scholar]
- 2.Rittmann BE, McCarty PL. 2001. Environmental biotechnology: principles and applications. McGraw-Hill, New York, NY. [Google Scholar]
- 3.Hernandez-Raquet G, Durand E, Braun F, Cravo-Laureau C, Godon JJ. 2013. Impact of microbial diversity depletion on xenobiotic degradation by sewage-activated sludge. Environ Microbiol Rep 5:588–594. doi: 10.1111/1758-2229.12053. [DOI] [PubMed] [Google Scholar]
- 4.Johnson DR, Lee TK, Park J, Fenner K, Helbling DE. The functional and taxonomic richness of wastewater treatment plant microbial communities are associated with each other and with ambient nitrogen and carbon availability. Environ Microbiol, in press. doi: 10.1111/1462-2920.12429. [DOI] [PubMed] [Google Scholar]
- 5.Wang X, Hu M, Xia Y, Wen X, Ding K. 2012. Pyrosequencing analysis of bacterial diversity in 14 wastewater treatment systems in China. Appl Environ Microbiol 78:7042–7047. doi: 10.1128/AEM.01617-12. [DOI] [PMC free article] [PubMed] [Google Scholar]
- 6.Yu K, Zhang T. 2012. Metagenomic and metatranscriptomic analysis of microbial community structure and gene expression of activated sludge. PLoS One 7:e38183. doi: 10.1371/journal.pone.0038183. [DOI] [PMC free article] [PubMed] [Google Scholar]
- 7.Zhang T, Shao MF, Ye L. 2012. 454 pyrosequencing reveals bacterial diversity of activated sludge from 14 sewage treatment plants. ISME J 6:1137–1147. doi: 10.1038/ismej.2011.188. [DOI] [PMC free article] [PubMed] [Google Scholar]
- 8.Ju F, Xia Y, Guo F, Wang Z, Zhang T. 2014. Taxonomic relatedness shapes bacterial assembly in activated sludge of globally distributed wastewater treatment plants. Environ Microbiol 16:2421–2432. doi: 10.1111/1462-2920.12355. [DOI] [PubMed] [Google Scholar]
- 9.Ju F, Guo F, Ye L, Xia Y, Zhang T. 2014. Metagenomic analysis on seasonal microbial variations of activated sludge from a full-scale wastewater treatment plant over 4 years. Environ Microbiol Rep 6:80–89. doi: 10.1111/1758-2229.12110. [DOI] [PubMed] [Google Scholar]
- 10.Ofiteru ID, Lunn M, Curtis TP, Wells GF, Criddle CS, Francis CA, Sloan WT. 2010. Combined niche and neutral effects in a microbial wastewater treatment community. Proc Natl Acad Sci U S A 107:15345–15350. doi: 10.1073/pnas.1000604107. [DOI] [PMC free article] [PubMed] [Google Scholar]
- 11.Cardinale BJ, Duffy JE, Gonzalez A, Hooper DU, Perrings C, Venail P, Narwani A, Mace GM, Tilman D, Wardle DA, Kinzig AP, Daily GC, Loreau M, Grace JB, Larigauderie A, Srivastava DS, Naeem S. 2012. Biodiversity loss and its impact on humanity. Nature 486:59–67. doi: 10.1038/nature11148. [DOI] [PubMed] [Google Scholar]
- 12.Duffy JE. 2009. Why biodiversity is important to the functioning of real-world ecosystems. Front Ecol Environ 7:437–444. doi: 10.1890/070195. [DOI] [Google Scholar]
- 13.Cardinale BJ, Srivastava DS, Duffy JE, Wright JP, Downing AL, Sankaran M, Jouseau C. 2006. Effects of biodiversity on the functioning of trophic groups and ecosystems. Nature 443:989–992. doi: 10.1038/nature05202. [DOI] [PubMed] [Google Scholar]
- 14.Loreau M, Naeem S, Inchausti P, Bengtsson J, Grime JP, Hector A, Hooper DU, Huston MA, Raffaelli D, Schmid B, Tilman D, Wardle DA. 2001. Biodiversity and ecosystem functioning: current knowledge and future challenges. Science 294:804–808. doi: 10.1126/science.1064088. [DOI] [PubMed] [Google Scholar]
- 15.Bell T, Newman JA, Silverman BW, Turner SL, Lilley AK. 2005. The contribution of species richness and composition to bacterial services. Nature 436:1157–1160. doi: 10.1038/nature03891. [DOI] [PubMed] [Google Scholar]
- 16.Bodelier PL, Meima-Franke M, Hordijk CA, Steenbergh AK, Hefting MM, Bodrossy L, von Bergen M, Seifert J. 2013. Microbial minorities modulate methane consumption through niche partitioning. ISME J 7:2214–2228. doi: 10.1038/ismej.2013.99. [DOI] [PMC free article] [PubMed] [Google Scholar]
- 17.Cardinale BJ. 2011. Biodiversity improves water quality through niche partitioning. Nature 472:86–89. doi: 10.1038/nature09904. [DOI] [PubMed] [Google Scholar]
- 18.Wittebolle L, Marzorati M, Clement L, Balloi A, Daffonchio D, Heylen K, De Vos P, Verstraete W, Boon N. 2009. Initial community evenness favours functionality under selective stress. Nature 458:623–626. doi: 10.1038/nature07840. [DOI] [PubMed] [Google Scholar]
- 19.Peter H, Beier S, Bertilsson S, Lindström ES, Langenheder S, Tranvik LJ. 2011. Function-specific response to depletion of microbial diversity. ISME J 5:351–361. doi: 10.1038/ismej.2010.119. [DOI] [PMC free article] [PubMed] [Google Scholar]
- 20.Pholchan MK, Baptista JC, Davenport RJ, Sloan WT, Curtis TP. 2013. Microbial community assembly, theory and rare functions. Front Microbiol 4:68. doi: 10.3389/fmicb.2013.00068. [DOI] [PMC free article] [PubMed] [Google Scholar]
- 21.Wertz S, Degrange V, Prosser JI, Poly F, Commeaux C, Freitag T, Guillaumaud N, Roux XL. 2006. Maintenance of soil functioning following erosion of microbial diversity. Environ Microbiol 8:2162–2169. doi: 10.1111/j.1462-2920.2006.01098.x. [DOI] [PubMed] [Google Scholar]
- 22.Tylianakis JM, Rand TA, Kahmen A, Klein AM, Buchmann N, Perner J, Tscharntke T. 2008. Resource heterogeneity moderates the biodiversity-function relationship in real world ecosystems. PLoS Biol 6:e122. doi: 10.1371/journal.pbio.0060122. [DOI] [Google Scholar]
- 23.Schwarzenbach RP, Escher BI, Fenner K, Hofstetter TB, Johnson CA, von Gunten U, Wehrli B. 2006. The challenge of micropollutants in aquatic systems. Science 313:1072–1077. doi: 10.1126/science.1127291. [DOI] [PubMed] [Google Scholar]
- 24.Helbling DE, Johnson DR, Honti M, Fenner K. 2012. Micropollutant biotransformation kinetics associate with WWTP process performance parameters and microbial community characteristics. Environ Sci Technol 46:10579–10588. doi: 10.1021/es3019012. [DOI] [PubMed] [Google Scholar]
- 25.Majewsky M, Gallé T, Yargeau V, Fischer K. 2011. Active heterotrophic biomass and sludge retention time (SRT) as determining factors for biodegradation kinetics of pharmaceuticals in activated sludge. Bioresour Technol 102:7415–7421. doi: 10.1016/j.biortech.2011.05.032. [DOI] [PubMed] [Google Scholar]
- 26.Schloss PD, Westcott SL, Ryabin T, Hall JR, Hartmann M, Hollister EB, Lesniewski RA, Oakley BB, Parks DH, Robinson CJ, Sahl JW, Stres B, Thallinger GG, Van Horn DJ, Weber CF. 2009. Introducing mothur: open-source, platform-independent, community-supported software for describing and comparing microbial communities. Appl Environ Microbiol 75:7537–7541. doi: 10.1128/AEM.01541-09. [DOI] [PMC free article] [PubMed] [Google Scholar]
- 27.Meyer F, Paarmann D, D'Souza M, Olson R, Glass EM, Kubal M, Paczian T, Rodriguez A, Stevens R, Wilke A, Wilkening J, Edwards RA. 2008. The metagenomics RAST server—a public resource for the automatic phylogenetic and functional analysis of metagenomes. BMC Bioinformatics 9:386. doi: 10.1186/1471-2105-9-386. [DOI] [PMC free article] [PubMed] [Google Scholar]
- 28.Overbeek R, Begley T, Butler RM, Choudhuri JV, Chuang HY, Cohoon M, de Crécy-Lagard V, Diaz N, Disz T, Edwards R, Fonstein M, Frank ED, Gerdes S, Glass EM, Goesmann A, Hanson A, Iwata-Reuyl D, Jensen R, Jamshidi N, Krause L, Kubal M, Larsen N, Linke B, McHardy AC, Meyer F, Neuweger H, Olsen G, Olson R, Osterman A, Portnoy V, Pusch GD, Rodionov DA, Rückert C, Steiner J, Stevens R, Thiele I, Vassieva O, Ye Y, Zagnitko O, Vonstein V. 2005. The subsystems approach to genome annotation and its use in the project to annotate 1000 genomes. Nucleic Acids Res 33:5691–5702. doi: 10.1093/nar/gki866. [DOI] [PMC free article] [PubMed] [Google Scholar]
- 29.Chao A. 1987. Estimating the population size for capture-recapture data with unequal catchability. Biometrics 43:783–791. doi: 10.2307/2531532. [DOI] [PubMed] [Google Scholar]
- 30.Chao A, Ma MC, Yang MCK. 1993. Stopping rules and estimation for recapture debugging with unequal failure rates. Biometrika 80:193–201. doi: 10.1093/biomet/80.1.193. [DOI] [Google Scholar]
- 31.Hill MO. 1973. Diversity and evenness: a unifying notation and its consequences. Ecol 54:427–432. doi: 10.2307/1934352. [DOI] [Google Scholar]
- 32.R Development Core Team. 2013. R: a language and environment for statistical computing, 3.0.1 ed. R Foundation for Statistical Computing, Vienna, Austria. [Google Scholar]
- 33.Oksanen J, Blanchet FG, Kindt R, Legendre P, Minchin PR, O'Hara RB, Simpson GL, Solymos P, Stevens MHH, Wagner H. 2013. Vegan: community ecology package, 2.0-7 ed. http://cran.r-project.org/web/packages/vegan/index.html. [Google Scholar]
- 34.Zavaleta ES, Pasari JR, Hulvey KB, Timan GD. 2010. Sustaining multiple ecosystem functions in grassland communities requires higher biodiversity. Proc Natl Acad Sci U S A 107:1443–1446. doi: 10.1073/pnas.0906829107. [DOI] [PMC free article] [PubMed] [Google Scholar]
- 35.Maestre FT, Quero JL, Gotelli NJ, Escudero A, Ochoa V, Delgado-Baquerizo M, García-Gómez M, Bowker MA, Soliveres S, Escolar C, García-Palacios P, Berdugo M, Valencia E, Gozalo B, Gallardo A, Aguilera L, Arredondo T, Blones J, Boeken B, Bran D, Conceição AA, Cabrera O, Chaieb M, Derak M, Eldridge DJ, Espinosa CI, Florentino A, Gaitán J, Gatica MG, Ghiloufi W, Gómez-González S, Gutiérrez JR, Hernández RM, Huang X, Huber-Sannwald E, Jankju M, Miriti M, Monerris J, Mau RL, Morici E, Naseri K, Ospina A, Polo V, Prina A, Pucheta E, Ramírez-Collantes DA, Romão R, Tighe M, Torres-Díaz C, Val J, Veiga JP, Wang D, Zaady E. 2012. Plant species richness and ecosystem multifunctionality in global drylands. Science 335:214–218. doi: 10.1126/science.1215442. [DOI] [PMC free article] [PubMed] [Google Scholar]
- 36.Ellis LB, Roe D, Wackett LB. 2006. The University of Minnesota Biocatalysis/Biodegradation Database: the first decade. Nucleic Acids Res 34:D517–D521. doi: 10.1093/nar/gkj076. [DOI] [PMC free article] [PubMed] [Google Scholar]
- 37.Benjamini Y, Hochberg Y. 1995. Controlling the false discovery rate: a practical and powerful approach to multiple testing. J R Stat Soc B Methodol 57:289–300. [Google Scholar]
- 38.Deutscher MP. 2006. Degradation of RNA in bacteria: comparison of mRNA and stable RNA. Nucleic Acids Res 34:659–666. doi: 10.1093/nar/gkj472. [DOI] [PMC free article] [PubMed] [Google Scholar]
- 39.Kemp PF, Lee S, Laroche J. 1993. Estimating the growth rate of slowly growing marine bacteria from RNA content. Appl Environ Microbiol 59:2594–2601. [DOI] [PMC free article] [PubMed] [Google Scholar]
- 40.Magurran AE. 2004. Measuring biological diversity. Blackwell Science, Oxford, United Kingdom. [Google Scholar]
- 41.Cadotte MW, Carscadden K, Mirotchnick N. 2011. Beyond species: functional diversity and the maintenance of ecological processes and services. J Appl Ecol 48:1079–1087. doi: 10.1111/j.1365-2664.2011.02048.x. [DOI] [Google Scholar]
- 42.Miki T, Yokokawa T, Matsui K. 2013. Biodiversity and multifunctionality in a microbial community: a novel theoretical approach to quantify functional redundancy. Proc R Soc B 281:1776. doi: 10.1098/rspb.2013.2498. [DOI] [PMC free article] [PubMed] [Google Scholar]
- 43.Singh BK, Quince C, Macdonald CA, Khachane A, Thomas N, Al-Soud WA, Sørensen SJ, He Z, White D, Sinclair A, Crooks B, Zhou J, Campbell CD. 2014. Loss of microbial diversity in soils is consistent with reductions in some specialized functions. Environ Microbiol 16:2408–2420. doi: 10.1111/1462-2920.12353. [DOI] [PubMed] [Google Scholar]
Associated Data
This section collects any data citations, data availability statements, or supplementary materials included in this article.