

Abstract
Duchenne muscular dystrophy (DMD) is characterized by in increased muscle damage and progressive replacement of muscle by noncontractile tissue. Both of these pathological changes can lengthen the MRI transverse proton relaxation time (T2). The current study measured longitudinal changes in T2 and its distribution in the lower leg of 16 boys with DMD (5–13 years, 15 ambulatory), 15 healthy controls (5–13 years). These muscles were chosen to allow extended longitudinal monitoring, due to their slow progression compared with proximal muscles in DMD. In the soleus muscle of boys with DMD, T2 and the percentage of pixels with an elevated T2 (≥2 SD above control mean T2) increased significantly over one year and two years, while the width of the T2 histogram increased over two years. Changes in soleus T2 variables were significantly greater in 9–13 year old compared with 5–8 year old boys with DMD. Significant correlations between the change in all soleus T2 variables over two years and the change in functional measures over two years were found. MRI measurement of muscle T2 in boys with DMD is sensitive to disease progression and shows promise as a clinical outcome measure.
Keywords: Duchenne muscular dystrophy, magnetic resonance imaging, 30 foot walk, transverse relaxation time
INTRODUCTION
Duchenne muscular dystrophy (DMD) is an X-linked neuromuscular disease characterized by progressive muscle weakness and caused by a defect in the gene that codes the dystrophin protein. Boys with DMD experience progressive disability, with loss of ambulation occurring at approximately 8–12 years [1] and death usually occurring early in the third decade of life [2]. No cure for DMD is available, although several potential treatments have entered clinical trials [3]. Current clinical outcome measures include muscle biopsies and functional testing. Muscle biopsies provide direct information about muscle integrity, but are invasive and give an incomplete picture of disease progression across muscles due to the limited tissue sampling. Functional tests, such as the six minute walk test, depend on a number of factors, including growth and maturation, biomechanics, and subject motivation. Hence, there is a need for sensitive, reliable, noninvasive methods to track physiological changes with disease and treatment.
Increased muscle damage and inflammation [4] and infiltration with fatty and fibrotic tissue have been described in dystrophic muscle [5]. Magnetic resonance imaging (MRI) and spectroscopy (MRS) have been used to measure fat infiltration in DMD, both using qualitative grading [6–10] and using quantitative methods [8–16]. These investigations have demonstrated that MRI and MRS are sensitive to disease progression in muscular dystrophy. The transverse relaxation time of muscle (T2), measured using MRI, is increased by muscle damage, inflammation, edema, and fat infiltration, offering a potential method to monitor muscle pathophysiology in a wide spectrum of boys with DMD. Previous investigations have examined T2 in boys with DMD [9, 14, 15, 17, 18]. In a cross-sectional study, T2 was demonstrated to be elevated in boys with DMD compared with controls, and higher in older boys compared with younger boys with DMD [18]. No longitudinal studies in the lower leg muscles have been performed except for in the oculopharyngeal muscular dystrophies [19]. Longitudinal measurement of T2 in the lower extremity muscles of boys with DMD will allow the impact of disease progression to be documented over an extended time frame. We chose to focus on the lower leg as the disease progresses more slowly in these muscles and thus they may provide a wider age window for inclusion in clinical trials.
The aims of the study were threefold: 1) To measure longitudinal changes in T2 of 3 distinct lower leg muscles over a two year time period in boys with DMD; 2) To compare the rate of change in T2 with respect to time in younger and older boys with DMD; and 3) To examine the relationship between changes in T2 and changes in muscle function in boys with DMD.
METHODS
Participants
Seventeen boys with DMD, all of whom were taking glucocorticoid corticosteroids, took part in a longitudinal MRI study, while 15 control boys participated at one time point. Control subjects were frequency matched by age to the DMD sample at the end of the two year observation period. Boys were included in the DMD group if they had a confirmed diagnosis of DMD based on clinical history, physical examination, serum creatine kinase level, or absence of dystrophin expression as determined by immunostaining or western blot and/or DNA sequencing. 10 boys had deletion mutations, 2 had duplication mutations, 2 had point mutations, and 2 did not provide genetic information. Boys were ambulatory at the time of recruitment and were age 5–13 years old. One of the boys was initially identified as DMD, but subsequent detailed genetic analysis revealed that he possessed a mutation consistent with BMD (deletion of exons 47–52). Thus, data from this boy was excluded. Demographic information is presented in Table 1. A cross sectional investigation of T2 in some of these boys has been previously published [18]. The study was approved by the Institutional Review Board at the University of Florida. Informed consent was obtained from the parent or guardian of each subject, and boys provided written assent. Boys with DMD visited the lab annually for MR and functional data collection. Each visit took approximately 5–6 hours. Prior to each visit, subjects were asked to avoid any physical activity that exceeded their normal activity for 2 days.
Table 1.
Demographics of boys with DMD and control boys
| Time point | DMD (n=16)
|
Control (n=15)
|
||
|---|---|---|---|---|
| Baseline | 1 year | 2 years | Single visit | |
| Age (y) | 7.8 ± 2.0 | 8.8 ± 2.0 | 9.9 ± 2.0 | 9.7 ± 2.7 |
| Body mass (kg) | 28.6 ± 11.8 | 31.4 ± 13.3 | 35.1 ± 14.7 | 32.8 ± 10.4 |
| Height (cm) | 121.9 ± 13.4 | 125.6 ± 13.4 | 129.9 ± 12.6 | 139.7 ± 15.7 |
| BMI (kg/m2) | 18.5 ± 3.5 | 19.2 ± 4.3 | 20.1 ± 4.5 | 18.2 ± 7.1 |
| Nonambulatory (n) | 1 | 1 | 2 | 0 |
MR Data Collection
MR data was collected on a 3T Philips Achieva Quasar scanner, using a SENSE 8 channel knee volume coil (FOV of 12–14 cm2) positioned around the maximum cross sectional area of right lower leg. Total scan time was approximately 1.5 hours, and the boys were provided with audiovisual entertainment during the scans, with both a researcher and a parent present in the scan room. T2 weighted MR images were acquired with the following parameters: 12 to 18 axial slices, slice thickness=7 mm, repetition time (TR)=3 s, 5 echo train (echo time (TE)=20, 40, 60, 80, and 100 ms.), with the vendor default refocusing angle=120°. Fat suppressed (FS) T2 weighted images were collected in a subset of boys with DMD (n=8) and control boys (n=10) (spectral presaturation with inversion recovery (SPIR), all other parameters as above)
MR Data Analysis
T2 maps were generated using custom-written IDL software. This software applied a monoexponential decay model to four echo times (40, 60, 80, and 100 ms) to determine the T2 for each pixel in the image. Stimulated echoes have previously been reported to affect T2 measurement [20]. Thus, the signal intensity from the first TE image (20 ms) was excluded from the fit to improve consistency in the T2 values obtained. The observed T2 represents a composite of all MR-visible protons in the pixel, including water and fat signals, which is typically fitted with a monoexponential curve [9, 14, 15, 17, 18], although more complex models are possible [21]. The soleus, tibialis anterior, and peroneal muscles were manually circled on three slices and values from the three slices were averaged. To ensure that data were analyzed at the same anatomical level regardless of body size, we used an internal landmark to select slices. Specifically, analyzers used the most proximal slice in which the flexor digitorum longus muscle was visible and the next two slices distally. Regions of interest were traced immediately inside of the muscle boundaries, with care taken to avoid intermuscular as well as intramuscular fascia. Analyzers worked from a manual of operating procedures that detailed the boundaries of the muscles and fasciae, and each analyzer was required to analyze 3–5 subjects with acceptable reliability compared with an experienced investigator prior to beginning data analysis. Analysis of the soleus, peroneal, and tibialis anterior muscles takes approximately 20 minutes per subject, and has excellent inter-rater reliability, with a mean % coefficient of variation of 1.2% [22]. Three variables were calculated from the pixel-by- pixel T2 maps in these slices (Figure 1). First, the mean T2 was calculated across all pixels in the region of interest. Second, the distribution of T2 values was determined as a histogram, and the full width at half maximum (FWHM) and full width at quarter maximum (FWQM) of this histogram was measured. Finally, T2 histograms for the 15 control boys were averaged, and the T2 value at the 95th percentile of this histogram was identified (dashed line in Figure 1; soleus: 48.0 ms, peroneals: 49.0 ms; tibialis anterior: 44.0 ms). Pixels with a T2 greater than this threshold were defined to have an elevated T2, and the number of pixels with an elevated T2 was expressed as a percentage of total pixels in each boy with DMD.
Figure 1.
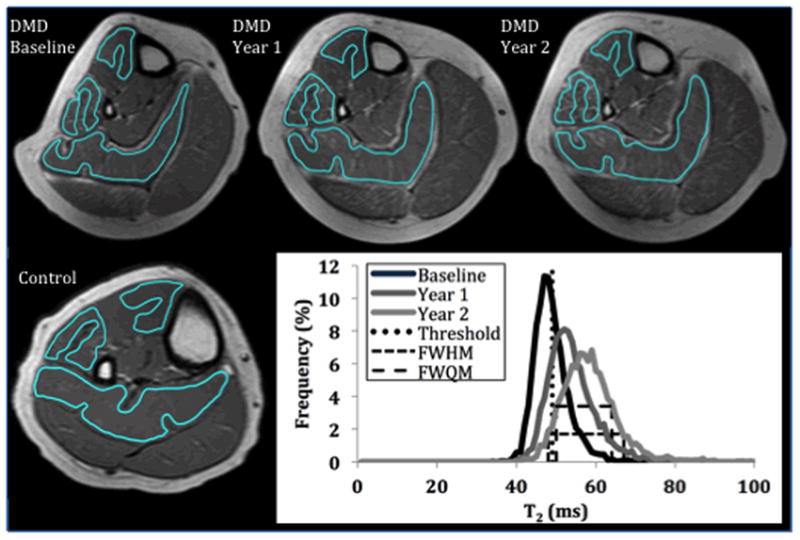
Top: T2-weighted images acquired in a boy with DMD (aged 9.9 years at baseline) over two years, showing increasing areas of hyperintensity over time. Bottom left: T2-weighted image from a 10 year old control boy, with homogeneous signal intensity in muscle. Bottom right: Longitudinal changes in the soleus T2 histogram in the above subject, illustrating changes in the histogram with disease progression. The rightward shift is captured by the mean T2 value, while the broadening of the histogram is captured by the FWHM and FWQM (dashed lines). The upper boundary of the T2 of healthy muscle (defined as the 95th percentile of the control T2 histogram) is represented by the vertical dotted line.
Functional Data Collection
Subjects were timed as they walked 30 feet (30 ft walk), climbed 4 stairs (4 stairs), and got up from the floor (supine to stand). Subjects were instructed to complete each task as quickly as possible, and three attempts at each task were completed. The fastest attempt of these three trials was recorded.
Statistical Methods
Subjects were divided into three groups on the basis of their age at baseline: 5.0–6.9 years, 7.0–8.9 years, and 9.0–13.0 years. Tests for changes over time and/or the interaction of changes over time with age group were constructed as chi-squared tests derived from a multivariate normal regression model for the longitudinal vector of measures for each individual. The model included fixed effects for time, age, and their interaction. Wilcoxon signed rank tests were used to examine the two-year change in functional variables. The change in T2 over two years in the tibialis anterior, peroneal, and soleus muscle groups was compared using a Kronecker covariance structure. Spearman correlations were used to examine relationships between the change in functional measures over two years and the change in soleus T2 variables over two years. The two boys who were unable to ambulate at the final time point were included in this analysis after being assigned functional test rankings higher than the most rapidly progressing ambulatory boy (the exact value does not matter since Spearman’s (rank) correlations were computed). A p-value of 0.05 was considered statistically signficant for all statistical analyses.
RESULTS
Change in soleus T2 values over 1 and 2 years
Mean T2 in the soleus muscle increased over both a one year period (p=0.0041) and a two year period (p=0.0001) in boys with DMD. Individual mean T2 data for the soleus are presented in Figure 2, while data averaged by age group can be seen in Figure 3a. The relative change in soleus T2 was 5.5 ± 6.6 % (5–6 yrs: 3.5 ± 5.9 %; 7–8 yrs: 3.5 ± 4.3 %; 9–13 yrs: 11.4 ± 8.5 %) over one year and 9.5 ± 7.4 % (5–6 yrs: 6.9 ± 7.1 %; 7–8 yrs: 7.2 ± 4.3%; 9–13 yrs: 16.9 ± 7.1 %) over two years. The number of elevated pixels also increased significantly over one year (p=0.007) and two years (p=0.0001). FWHM and FWQM increased significantly over two years (FWHM: p=0.02; FWQM: p=0.03), but not over one year.
Figure 2.

Individual mean soleus T2 data plotted against age. For clarity, only baseline and 2 year points are shown. T2 increased with time in boys with DMD at all ages, but changes were considerably more pronounced after approximately 9 years old. The boy diagnosed with BMD is shown in grey. Solid and dashed lines across the bottom of the plot represent the control mean and 95% confidence intervals.
Figure 3.

Longitudinal changes in mean T2 (A), elevated pixels (B), FWHM (C), and FWQM (D) in the soleus muscle. Solid horizontal line represents the control mean, while the dashed horizontal line represents the 95% confidence intervals around the control mean.
Age differences in soleus muscle T2 progression
Soleus muscle T2 increased more rapidly over 2 years in 9–13 year old boys than 5–6 year old boys (p=0.017) or 7–8 year old boys (p=0.031). FWHM also increased more rapidly in 9–13 year old boys compared with 5–6 year old boys (p=0.03) but not compared with 7–8 year old boys (p=0.16). Neither percent elevated pixels nor FWQM increased more rapidly in 9–13 year old boys compared with 5–6 year old boys (elevated pixels: p=0.33, FWQM: p=0.10) or in 9–13 year old boys compared with 7–8 year old boys (elevated pixels: p=0.42, FWQM: p=0.44).
Fat saturation in the soleus
Soleus FS T2 was lower than NFS T2 in all DMD subjects. A small but significant increase in FS T2 (2.9 ± 2.2 ms, p<0.001) was seen over two years (baseline: 43.5 ± 1.7 ms; year 1: 45.6 ± 3.4 ms; year 2: 46.4 ± 2.3 ms).
Differences among lower leg muscles
Muscle NFS T2 increased significantly in the soleus (4.5 ± 3.6 ms, p=0.002, 10%) and peroneal muscles (3.8 ± 4.8 ms, p<0.0001, 8%, Figure 4). NFS T2 in the tibialis anterior muscle did not significantly increase over two years (1.9 ± 4.9 ms, p=0.12, 4%). The difference in the two year change in NFS T2 between these three muscles did not achieve statistical significance (p=0.08).
Figure 4.

Longitudinal changes in mean T2 in the peroneal, soleus, and tibialis anterior muscles.
Relationships between T2 and function
The 2-year increase in time to complete the supine to stand test was significantly greater than 0 in boys with DMD (Table 3, p=0.003). A non-significant trend toward increased time to complete the 30 ft walk over 2 years (p=0.058) was present. The increase in time to climb 4 stairs over two years was not significantly different from 0 (p=0.17). Correlations between the change in functional tests times and the change in soleus T2 measures were all statistically significant (Table 4, Figure 5), as well as the correlation between the change in peroneal mean T2 and the change in function. Correlations between the change in tibialis anterior mean T2 and the change in function were not significant. The strongest correlations were found between soleus mean T2 and the three functional measures.
Table 3.
Functional test times in boys with DMD
| Baseline (n=15) | Year 1 (30 ft: n=15, Supine to stand&4 stairs: n=14) | Year 2 (n=14) | |
|---|---|---|---|
| 30 ft walk (s) | 6.13 ± 0.97 | 6.87 ± 2.84 | 6.86 ± 1.42 |
| 4 stairs (s) | 3.74 ± 1.03 | 4.65 ± 2.88 | 5.53 ± 4.35 |
| Supine to stand (s) | 4.43 ± 3.03 | 4.64 ± 2.34 | 6.43 ± 4.17* |
significantly different from baseline (p<0.05)
Table 4.
Correlations between the change in T2 variables and the change in functional test times over two years
| Δ 30 ft walk (s) | Δ Supine to stand (s) | Δ 4 stairs (s) | |
|---|---|---|---|
| Δ Soleus Mean T2 (ms) | 0.87** | 0.73** | 0.66** |
| Δ Soleus Elevated pixels (%) | 0.72** | 0.60** | 0.51* |
| Δ Soleus FWHM (ms) | 0.59* | 0.53* | 0.57* |
| Δ Soleus FWQM (ms) | 0.54* | 0.54* | 0.51* |
| Δ Peroneal Mean T2 (ms) | 0.75** | 0.65** | 0.52* |
| Δ Tibialis Anterior | 0.49 | 0.46 | 0.27 |
| Mean T2 (ms) | |||
significant (p<0.05),
significant (p<0.01)
Figure 5.

Correlation between the change in T2 variables in the soleus (over two years) and the change in 30 ft walk time (over two years). Two boys lost ambulation before or during the study, and were assigned an arbitrary maximum value to permit analysis using Spearman rank correlations. The two nonambulatory boys are represented by open circles.
DISCUSSION
In boys with DMD, soleus mean T2 and percentage elevated pixels increased significantly over one year and two years. FWHM and FWQM also showed increases over two years in boys with DMD. This increase was more rapid in 9–13 year old boys with DMD, but was similar in 5–6 and 7–8 year old boys with DMD, possibly reflecting more rapid progression in fatty infiltration in older boys with DMD. In support of this, the increase in soleus FS T2 was less pronounced than the increase in NFS T2 in all age groups. Soleus T2 variables correlated moderately or strongly with functional measures, indicating that these measures meaningfully reflect disease progression in DMD.
Longitudinal changes in T2 variables
NFS T2 in the soleus increased by 2.6 ± 3.0 ms (5.4 ± 6.6%) over one year in boys with DMD. There is evidence from animal models that muscle damage and possibly inflammation are important aspects of early disease pathology in dystrophin-null muscle, and these changes can be measured using MRI [23]. A recent abstract suggests that muscle damage, edema, and/or inflammation are probably key contributors to the elevation in T2 in boys with DMD, especially at younger ages, but that these changes might not be expected to systematically increase over time [24]. Thus, the progressive increase in soleus T2 seen in the current study is likely reflective of the increasing fat infiltration in this population. The relative area of affected tissue (% elevated pixels) increased from 29.4 ± 19.0 to 46.9 ± 27.5 % but neither FWHM nor FWQM increased significantly over one year. Over two years, all soleus T2 variables increased significantly. Previously, Kim et al. [14] showed a heterogeneous pattern in the gluteus maximus muscle of boys with DMD following the initiation of corticosteroid therapy. Specifically, over 12–18 months, 5 subjects showed an increase in T2, 4 subjects showed a decrease in T2, and 2 subjects remained stable. Furthermore, the sample in that study did not show any change in clinical function. The current study covered a greater time period (24 months), and included a number of boys who showed decreases in clinical function. Several factors, including difference in musculature examined (the calf musculature examined in the current study had an overall mean T2 of ~50 ms, while the study by Kim et al. reported a mean T2 of 79 ms in the gluteus maximus muscle), the shorter observation period, smaller and less clinically diverse sample, and the effects of the initiation of corticosteroid therapy likely explain the different findings of these two studies. A recent study by Fischmann et al. [19] found that T2 increased over one year in adults with oculopharyngeal muscular dystrophy, and that T2 increased even in the absence of changes in clinical function. Our study demonstrates a similar finding. The results of the current study further demonstrate that the rate of T2 increase depends on age, with older boys showing more dramatic increases.
T2 heterogeneity
Longitudinal changes in the T2 histogram were also examined. Specifically, the percentage elevated pixels, FWHM, and FWQM in the soleus muscle were investigated in this group of boys. Although each of these variables increased over two years, the percentage elevated pixels was more sensitive than FWHM or FWQM to one-year changes in T2. These measures are valuable in capturing the diverse tissue changes in DMD. Signal within the muscle comes from healthy muscle, fat, fibrosis, and muscle damage, edema, and inflammation. As the disease progresses, the distribution of these components changes: more fat and fibrosis is present, muscle damage may increase or decrease, and the amount of healthy muscle decreases. The percentage of elevated pixels captures an increase in fat and/or inflammation, while the FWHM and FWQM capture the overall heterogeneity of the tissue. Previous investigators have described a broadening and/or rightward shift of the T2 histogram when comparing boys with DMD to controls [15, 18, 25, 26], and the current work demonstrates that a further shift occurs with disease progression in DMD.
Differences between muscles
While a significant increase in soleus and peroneal NFS T2 was seen over two years in these boys, NFS T2 in the tibialis anterior did not increase significantly. Previous cross-sectional investigations in boys with DMD have reported that T2 is lower in the tibialis anterior compared with other muscles of the lower leg [18] and fat infiltration is higher in the peroneals and lower in the tibialis anterior [8, 10]. Longitudinal analysis showed that in 5–13 year old boys, a trend toward a different rate of change in these three muscles was seen, but the trend did not achieve statistical significance. Future investigations with a longer duration or greater sample size might help to increase our understanding of the rate of progression in different muscles, particularly if these investigations also investigate the interaction between age and disease progression in different muscles. DMD is known to affect more proximal muscles first, with more distal muscles spared until later in the disease course. Thus, it is likely that more proximal muscles, such as the adductor magnus, would be more sensitive to changes in young boys with DMD, but these muscles might be less sensitive in older boys with DMD due to near-complete replacement with noncontractile tissue [11]. The current study focused on the muscles of the lower leg to permit longitudinal investigation of young and older boys with DMD.
Age differences
Boys were divided into three age groups for analysis, with the hypothesis that older boys would show a more rapid rate of change in T2, elevated pixels, FWHM, and FWQM than younger boys. This hypothesis was confirmed. All soleus T2 variables increased more rapidly in boys who were 9–13 at baseline, compared with boys who were 5–6 or 7–8 years of age at baseline. These data provide some evidence for the hypothesis that the progressive increase in T2 over time is driven by fat infiltration rather than muscle damage, edema, or inflammation, since fat infiltration is greater in older boys with DMD [10]. Importantly, however, soleus T2 was elevated at baseline and increased over time in even the youngest boys with DMD, suggesting that this measure captures disease progression across a broad age range. This is an important consideration in the use of T2 as a clinical outcome measure.
The effect of fat suppression
Further evidence that the increase in T2 is driven primarily by fat comes from the soleus FS T2 values, which are lower than the NFS T2 values and which do not increase significantly over one year. A significant increase in soleus FS T2 was found over two years, although this increase was approximately half of the increase in NFS T2. Weber et al. [10] described increased fatty infiltration and decreased edema in older boys with DMD compared with younger boys with DMD. Thus, although the increase in soleus FS T2 might be driven by increases in muscle damage, edema, or inflammation, it is more likely that a small amount of unsuppressed fat signal is responsible for this increase. A SPIR sequence was used to carry out fat suppression, but this technique does not entirely eliminate the contribution of fat to the elevated T2 signal. To fully separate the relative contributions of fat and muscle water changes, other quantitative MR techniques are required, such as Dixon imaging or MR spectroscopy. Dixon imaging, in particular, is increasingly used in the muscular dystrophies, because it permits a high spatial resolution measurement of muscle fat fraction [13, 19, 27, 28]. In addition to Dixon imaging, muscle fat content and muscle water T2 can be independently measured using 1H-MRS, although spatial resolution is limited with this technique. Finally, sophisticated techniques such as the IDEAL-CPMG sequence proposed by Janiczek et al. [29] or fat corrected T2 measurement [30] can allow separation of water and fat T2. However, T2 weighted imaging has an advantage of being a standard clinical sequence, unlike some of the techniques discussed above, so it could be used in multisite research or by groups that do not specialize in MR techniques. Moreover, we believe since the T2 mapping measure reflects overall changes in both water T2 and fat content this may be particularly valuable in following boys with DMD over extended periods, evident by the early elevation and progressive increases seen in the current study.”
Functional tests
The relationship between the change in T2 variables and the change in functional measures was examined using Spearman’s correlation analysis. All soleus T2 variables and peroneal mean T2 were significantly correlated with function, and the strongest correlation was found between the increase in soleus mean T2 and the increase in 30 foot walk time. These results are important because they confirm that T2 captures meaningful changes in function in boys with DMD. A key benefit to MRI compared with functional measures in monitoring disease progression is that it can be used in nonambulatory as well as ambulatory boys. For example, changes in T2 were large in the boys who lost ambulation during this study (6.5 and 10.8 ms, respectively). If ambulation-based functional measures alone were used in a clinical trial setting, data from these boys would have been lost.
Conclusions
This longitudinal investigation has revealed that T2 and related variables increase over two years in 5–13 year old boys with DMD, and that mean T2 and elevated pixels increase significantly in just a year. These changes are more rapid in 9–13 year old compared with 5–6 or 7–8 year old boys with DMD, a difference that might be attributable to increases in intramuscular fat content in older boys with DMD. T2 is elevated in boys with DMD compared with controls at all ages. Changes in T2 are strongly correlated with changes in functional performance, suggesting that these measures are sensitive to meaningful changes in disease progression. Based on the results of this study, T2 measures might offer an opportunity to noninvasively investigate the response of the muscle to therapeutic strategies that aim to alter the disease course in DMD.
Table 2.
Non fat suppressed T2 variables in the soleus muscle of boys with DMD and controls
| Baseline | Year 1 | Year 2 | Controls | |
|---|---|---|---|---|
| Mean T2 (ms) | 47.4 ± 2.9 | 49.9 ± 3.9** | 51.9 ± 5.0** | 40.3 ± 1.1† |
| Elevated pixels (%) | 29.4 ± 19.0 | 46.9 ± 27.5** | 57.0 ± 26.2** | 6.5 ± 2.8† |
| FWHM (ms) | 9.2 ± 2.1 | 9.3 ± 2.0 | 10.7 ± 2.3** | 9.1 ± 1.3 |
| FWQM (ms) | 13.8 ± 3.2 | 13.8 ± 2.7 | 15.6 ± 3.2* | 13.8 ± 2.1 |
significantly different from baseline (p<0.05)
significantly different from baseline (p<0.01)
significantly different from DMD (p<0.01)
Acknowledgments
Research reported in this publication was supported by the National Institute of Arthritis and Musculoskeletal and Skin Diseases of the National Institutes of Health under Award Numbers R01 AR056973 and RC1 AR058189-01, by the National Institutes of Health (NIH-U54AR052646), by Parent Project Muscular Dystrophy (8509) and by the Muscular Dystrophy Association. The content is solely the responsibility of the authors and does not necessarily represent the official views of these organizations. The authors would like to thank Xiao Wu for her assistance with statistical analysis.
Footnotes
Publisher's Disclaimer: This is a PDF file of an unedited manuscript that has been accepted for publication. As a service to our customers we are providing this early version of the manuscript. The manuscript will undergo copyediting, typesetting, and review of the resulting proof before it is published in its final citable form. Please note that during the production process errors may be discovered which could affect the content, and all legal disclaimers that apply to the journal pertain.
References
- 1.Desguerre I, Christov C, Mayer M, et al. Clinical heterogeneity of duchenne muscular dystrophy (DMD): definition of sub-phenotypes and predictive criteria by long-term follow-up. PLoS One. 2009;4:e4347. doi: 10.1371/journal.pone.0004347. [DOI] [PMC free article] [PubMed] [Google Scholar]
- 2.Fraser LK, Childs AM, Miller M, et al. A cohort study of children and young people with progressive neuromuscular disorders: clinical and demographic profiles and changing patterns of referral for palliative care. Palliat Med. 2011 doi: 10.1177/0269216311419989. [DOI] [PubMed] [Google Scholar]
- 3.Pichavant C, Aartsma-Rus A, Clemens PR, et al. Current status of pharmaceutical and genetic therapeutic approaches to treat DMD. Mol Ther. 2011;19:830–40. doi: 10.1038/mt.2011.59. [DOI] [PMC free article] [PubMed] [Google Scholar]
- 4.Porter JD, Khanna S, Kaminski HJ, et al. A chronic inflammatory response dominates the skeletal muscle molecular signature in dystrophin-deficient mdx mice. Hum Mol Genet. 2002;11:263–72. doi: 10.1093/hmg/11.3.263. [DOI] [PubMed] [Google Scholar]
- 5.Cros D, Harnden P, Pellissier JF, Serratrice G. Muscle hypertrophy in Duchenne muscular dystrophy. A pathological and morphometric study. J Neurol. 1989;236:43–7. doi: 10.1007/BF00314217. [DOI] [PubMed] [Google Scholar]
- 6.Marden FA, Connolly AM, Siegel MJ, Rubin DA. Compositional analysis of muscle in boys with Duchenne muscular dystrophy using MR imaging. Skeletal Radiol. 2005;34:140–8. doi: 10.1007/s00256-004-0825-3. [DOI] [PubMed] [Google Scholar]
- 7.Kinali M, Arechavala-Gomeza V, Cirak S, et al. Muscle histology vs MRI in Duchenne muscular dystrophy. Neurology. 2011;76:346–53. doi: 10.1212/WNL.0b013e318208811f. [DOI] [PMC free article] [PubMed] [Google Scholar]
- 8.Torriani M, Townsend E, Thomas BJ, Bredella MA, Ghomi RH, Tseng BS. Lower leg muscle involvement in Duchenne muscular dystrophy: an MR imaging and spectroscopy study. Skeletal Radiol. 2012;41:437–45. doi: 10.1007/s00256-011-1240-1. [DOI] [PMC free article] [PubMed] [Google Scholar]
- 9.Kim HK, Laor T, Horn PS, Racadio JM, Wong B, Dardzinski BJ. T2 mapping in Duchenne muscular dystrophy: distribution of disease activity and correlation with clinical assessments. Radiology. 2010;255:899–908. doi: 10.1148/radiol.10091547. [DOI] [PubMed] [Google Scholar]
- 10.Weber MA, Nagel AM, Jurkat-Rott K, Lehmann-Horn F. Sodium (23Na) MRI detects elevated muscular sodium concentration in Duchenne muscular dystrophy. Neurology. 2011;77:2017–24. doi: 10.1212/WNL.0b013e31823b9c78. [DOI] [PubMed] [Google Scholar]
- 11.Akima H, Lott D, Senesac C, et al. Relationships of thigh muscle contractile and non-contractile tissue with function, strength, and age in boys with Duchenne muscular dystrophy. Neuromuscul Disord. 2012;22:16–25. doi: 10.1016/j.nmd.2011.06.750. [DOI] [PMC free article] [PubMed] [Google Scholar]
- 12.Gaeta M, Messina S, Mileto A, et al. Muscle fat-fraction and mapping in Duchenne muscular dystrophy: evaluation of disease distribution and correlation with clinical assessments: Preliminary experience. Skeletal Radiol. 2011 doi: 10.1007/s00256-011-1301-5. [DOI] [PubMed] [Google Scholar]
- 13.Gloor M, Fasler S, Fischmann A, et al. Quantification of fat infiltration in oculopharyngeal muscular dystrophy: comparison of three MR imaging methods. J Magn Reson Imaging. 2011;33:203–10. doi: 10.1002/jmri.22431. [DOI] [PubMed] [Google Scholar]
- 14.Kim HK, Laor T, Horn PS, Wong B. Quantitative assessment of the T2 relaxation time of the gluteus muscles in children with Duchenne muscular dystrophy: a comparative study before and after steroid treatment. Korean J Radiol. 2010;11:304–11. doi: 10.3348/kjr.2010.11.3.304. [DOI] [PMC free article] [PubMed] [Google Scholar]
- 15.Huang Y, Majumdar S, Genant HK, et al. Quantitative MR relaxometry study of muscle composition and function in Duchenne muscular dystrophy. J Magn Reson Imaging. 1994;4:59–64. doi: 10.1002/jmri.1880040113. [DOI] [PubMed] [Google Scholar]
- 16.Gaeta M, Scribano E, Mileto A, et al. Muscle fat fraction in neuromuscular disorders: dual-echo dual-flip-angle spoiled gradient-recalled MR imaging technique for quantification--a feasibility study. Radiology. 2011;259:487–94. doi: 10.1148/radiol.10101108. [DOI] [PubMed] [Google Scholar]
- 17.Garrood P, Hollingsworth KG, Eagle M, et al. MR imaging in Duchenne muscular dystrophy: quantification of T1-weighted signal, contrast uptake, and the effects of exercise. J Magn Reson Imaging. 2009;30:1130–8. doi: 10.1002/jmri.21941. [DOI] [PubMed] [Google Scholar]
- 18.Arpan I, Forbes SC, Lott DJ, et al. T(2) mapping provides multiple approaches for the characterization of muscle involvement in neuromuscular diseases: a cross-sectional study of lower leg muscles in 5–15-year-old boys with Duchenne muscular dystrophy. NMR Biomed. 2012 doi: 10.1002/nbm.2851. [DOI] [PMC free article] [PubMed] [Google Scholar]
- 19.Fischmann A, Hafner P, Fasler S, et al. Quantitative MRI can detect subclinical disease progression in muscular dystrophy. J Neurol. 2012 doi: 10.1007/s00415-011-6393-2. [DOI] [PubMed] [Google Scholar]
- 20.Gambarota G, Cairns BE, Berde CB, Mulkern RV. Osmotic effects on the T2 relaxation decay of in vivo muscle. Magn Reson Med. 2001;46:592–9. doi: 10.1002/mrm.1232. [DOI] [PubMed] [Google Scholar]
- 21.Friedman SD, Poliachik SL, Carter GT, Budech CB, Bird TD, Shaw DW. The magnetic resonance imaging spectrum of facioscapulohumeral muscular dystrophy. Muscle Nerve. 2012;45:500–6. doi: 10.1002/mus.22342. [DOI] [PubMed] [Google Scholar]
- 22.Forbes SC, Walter GA, Rooney WD, et al. Skeletal Muscles of Ambulant Children with Duchenne Muscular Dystrophy: Validation of Multicenter Study of Evaluation with MR Imaging and MR Spectroscopy. Radiology. 2013 doi: 10.1148/radiol.13121948. [DOI] [PMC free article] [PubMed] [Google Scholar]
- 23.Kobayashi M, Nakamura A, Hasegawa D, Fujita M, Orima H, Takeda S. Evaluation of dystrophic dog pathology by fat-suppressed T2-weighted imaging. Muscle Nerve. 2009;40:815–26. doi: 10.1002/mus.21384. [DOI] [PubMed] [Google Scholar]
- 24.Rooney WD, Forbes S, Pollaro J, et al. Water T2 values are elevated in Duchenne muscular dystrophy independent of fat infiltration. International Society for Magnetic Resonance in Medicine Annual Meeting; 2012; Melbourne, Australia. [Google Scholar]
- 25.Wansapura JP, Hor KN, Mazur W, et al. Left ventricular T2 distribution in Duchenne muscular dystrophy. J Cardiovasc Magn Reson. 2010;12:14. doi: 10.1186/1532-429X-12-14. [DOI] [PMC free article] [PubMed] [Google Scholar]
- 26.Phoenix J, Betal D, Roberts N, Helliwell TR, Edwards RH. Objective quantification of muscle and fat in human dystrophic muscle by magnetic resonance image analysis. Muscle Nerve. 1996;19:302–10. doi: 10.1002/(SICI)1097-4598(199603)19:3<302::AID-MUS4>3.0.CO;2-H. [DOI] [PubMed] [Google Scholar]
- 27.Triplett WT, Baligand C, Forbes SC, et al. Chemical shift-based MRI to measure fat fractions in dystrophic skeletal muscle. Magn Reson Med. 2013 doi: 10.1002/mrm.24917. [DOI] [PMC free article] [PubMed] [Google Scholar]
- 28.Wren TA, Bluml S, Tseng-Ong L, Gilsanz V. Three-point technique of fat quantification of muscle tissue as a marker of disease progression in Duchenne muscular dystrophy: preliminary study. AJR Am J Roentgenol. 2008;190:W8–12. doi: 10.2214/AJR.07.2732. [DOI] [PubMed] [Google Scholar]
- 29.Janiczek RL, Gambarota G, Sinclair CD, et al. Simultaneous T(2) and lipid quantitation using IDEAL-CPMG. Magn Reson Med. 2011;66:1293–302. doi: 10.1002/mrm.22916. [DOI] [PubMed] [Google Scholar]
- 30.Yao L, Gai N. Fat-corrected T2 measurement as a marker of active muscle disease in inflammatory myopathy. AJR Am J Roentgenol. 2012;198:W475–81. doi: 10.2214/AJR.11.7113. [DOI] [PubMed] [Google Scholar]