Abstract
Objective:
The prognostic importance of the speed of early hematoma growth in acute intracerebral hemorrhage (ICH) has not been well established. We aimed to determine the association between the rate of increase in hematoma volume and major clinical outcomes in the Intensive Blood Pressure Reduction in Acute Cerebral Hemorrhage Trial (INTERACT) studies. The effects of early intensive blood pressure (BP) lowering according to the speed of hematoma growth were also investigated.
Methods:
Pooled analyses of the INTERACT1 (n = 404) and INTERACT2 (n = 2,839) studies—randomized controlled trials of patients with spontaneous ICH with elevated systolic BP, randomly assigned to intensive (target systolic BP <140 mm Hg) or guideline-based (<180 mm Hg) BP management. The speed of ultraearly hematoma growth (UHG) was defined as hematoma volume (mL)/onset-to-CT time (hours). Primary outcome was death or major disability (modified Rankin Scale score of 3–6) at 90 days.
Results:
Among a total of 2,909 patients (90%) with information on UHG and outcome, median speed of UHG was 6.2 mL/h. There was a linear association between UHG and outcome: multivariable-adjusted odd ratios 1.90 (95% confidence interval 1.50–2.39) for 5–10 mL/h and 2.96 (2.36–3.71) for >10 mL/h vs the <5 mL/h group. There were no clear differences in the effects of intensive BP lowering according to 3 speeds of UHG on outcome (p = 0.75 for homogeneity).
Conclusions:
The speed of UHG in patients with ICH was continuously associated with increased risks of death or major disability, and from lower levels than previously reported (≥5 mL/h). The benefits of intensive BP lowering appear to be independent of the speed of bleeding.
A recent observational study proposed that the speed of ultraearly hematoma growth (UHG) could be considered a new predictor of poor outcome in patients with acute intracerebral hemorrhage (ICH).1 UHG, calculated as the initial hematoma volume (mL) divided by time from onset to initial imaging (hours) represents the speed of initial bleeding before hospital presentation, and was shown to predict subsequent hematoma growth and poor clinical outcomes. However, this finding has not been validated in other populations of acute ICH. The objectives of this analysis were to determine the association of speed of UHG with clinical outcomes and hematoma growth in more than 3,000 patients with acute ICH, represented by pooling data from the pilot and the main phases of the Intensive Blood Pressure Reduction in Acute Cerebral Hemorrhage Trial (INTERACT) studies.2–4 We also assessed whether the treatment effects of early intensive blood pressure (BP) lowering seen in these studies was modified by the speed of UHG.
METHODS
Study design and participants.
INTERACT1 and INTERACT2 were international, multicenter, open, blinded endpoint, randomized controlled trials, as described in detail elsewhere.2–4 In brief, 404 and 2,839 patients, respectively, with spontaneous ICH within 6 hours of onset and elevated systolic BP (SBP, 150–220 mm Hg) were randomly assigned to receive intensive (target SBP <140 mm Hg within 1 hour) or guideline-recommended (target SBP <180 mm Hg) BP-lowering therapy. In predefined CT substudies, 1,310 patients (346 INTERACT1, 964 INTERACT2) underwent a repeat CT at 24 hours using the same procedure as the baseline CT.
Standard protocol approvals, registrations, and patient consents.
The study protocol was approved by the appropriate ethics committee at each participating site, and written informed consent was obtained directly from the patient or an appropriate surrogate. The INTERACT studies are registered with ClinicalTrials.gov, numbers NCT00226096 and NCT00716079.
Procedures.
Demographic and clinical characteristics were recorded at the time of enrollment, with stroke severity measured using the Glasgow Coma Scale and NIH Stroke Scale (NIHSS) at baseline, 24 hours, and at day 7 (or earlier upon discharge from hospital). In the CT substudies, CT scans were performed according to standardized techniques at baseline and at 24 ± 3 hours after the initial CT. For each CT scan, uncompressed digital CT images were collected in DICOM (Digital Imaging and Communications in Medicine) format on a CD-ROM identified only with the patient's unique study number. For each study, hematoma volumes were calculated independently by trained neurologists who were blinded to clinical data, treatment, and date and sequence of scan, using computer-assisted multislice planimetric and voxel threshold techniques in MIStar (version 3.2). Interreader reliability was checked by periodic reanalysis of the scans (10% in INTERACT1 and 15% in INTERACT2) throughout the study to avoid drift (intraclass correlation coefficients, 0.97 for INTERACT1 and 0.92 for INTERACT2). UHG was defined as baseline hematoma volume (mL) without intraventricular hemorrhage divided by time from stroke onset to initial CT (hours).
Outcomes.
The primary clinical outcome was death or major disability (defined by scores 3–6 on the modified Rankin Scale [mRS]) at 90 days. Secondary clinical outcomes were death and major disability (mRS scores 3–5) separately. The main outcome of the CT substudies was the absolute growth of hematoma at 24 hours.
Statistical analysis.
Descriptive baseline demographic values and risk factors were summarized as mean (SD) or median (interquartile range) for continuous variables, and as number (%) for categorical variables. Three patient groups of UHG defined by speeds of <5, 5–10, and >10 mL/h were used in analyses, with baseline characteristics across these groups compared with Kruskal-Wallis test for continuous variables and χ2 test for categorical variables. The association of speed of UHG on clinical outcomes was estimated in logistic regression models adjusted for age, sex, region of recruitment (China vs other), diabetes, BP-lowering therapy, antithrombotic therapy, SBP, glucose, high (≥14) NIHSS score, hematoma location, intraventricular extension, randomized treatment, and trial. In the analysis of the CT substudies, the relation between the speed of UHG and absolute change in hematoma volumes was assessed using analysis of covariance and logistic regression models, which included as covariates age, sex, region, diabetes, BP-lowering therapy, antithrombotic therapy, SBP, glucose, hematoma location, intraventricular extension, randomized treatment, and trial. The effects of early intensive BP lowering on clinical outcomes and hematoma growth were also assessed by logistic regression models and by analysis of covariance including hematoma location and trials as covariates, respectively. Comparisons of treatment effects across patient groups were performed by adding interaction terms to the statistical models. A standard level of significance (p < 0.05) was used and the data were reported with odds ratios (ORs) and 95% confidence intervals (CIs). All data were analyzed with the use of SAS software (version 9.3; SAS Institute, Cary, NC).
RESULTS
Speed of UHG and clinical outcomes.
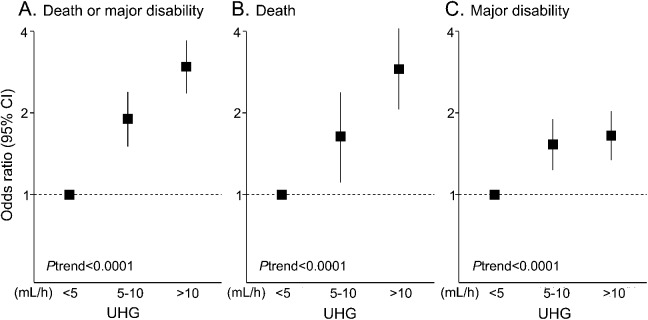
Among 3,243 participants of the INTERACT pooled cohort, 2,909 (90%) with information on baseline hematoma volume, time from onset to initial CT, and mRS at 90 days, were included in analysis of clinical outcome. Median speed of UHG was 6.2 (2.7–13.3) mL/h. A total of 1,256 patients (43%) had UHG speeds of <5 mL/h, and 662 (23%) and 991 (34%) had UHG speeds of 5–10 and >10 mL/h, respectively, as shown in table 1. Patients with faster UHG were younger and less likely to be hypertensive, diabetic, and receiving premorbid antihypertensive therapy, and they had higher diastolic BP, glucose levels, and NIHSS scores at baseline. A total of 1,545 patients had either died or were left with major disability (poor outcome) at 90 days. Associations between speed of UHG and clinical outcomes are shown in table 2 and figure 1. There were linear associations of speed of UHG with the frequency of the poor outcome: 39%, 55%, and 70% for patient groups defined by UHG levels of <5, 5–10, and >10 mL/h, respectively (p < 0.0001 for trend). These associations remained significant after adjustment for age, sex, region, diabetes, BP-lowering therapy, antithrombotic therapy, SBP, glucose, high NIHSS score, hematoma location, intraventricular extension, trial, and randomized treatment: OR 1.90 (95% CI 1.50–2.39) for 5–10 mL/h and 2.96 (2.36–3.71) for >10 mL/h compared with the <5 mL/h group. Similar associations were observed for secondary outcomes of death and major disability separately (p < 0.0001 and p < 0.0001 for trend, respectively).
Table 1.
Baseline characteristics of participants by UHG levels
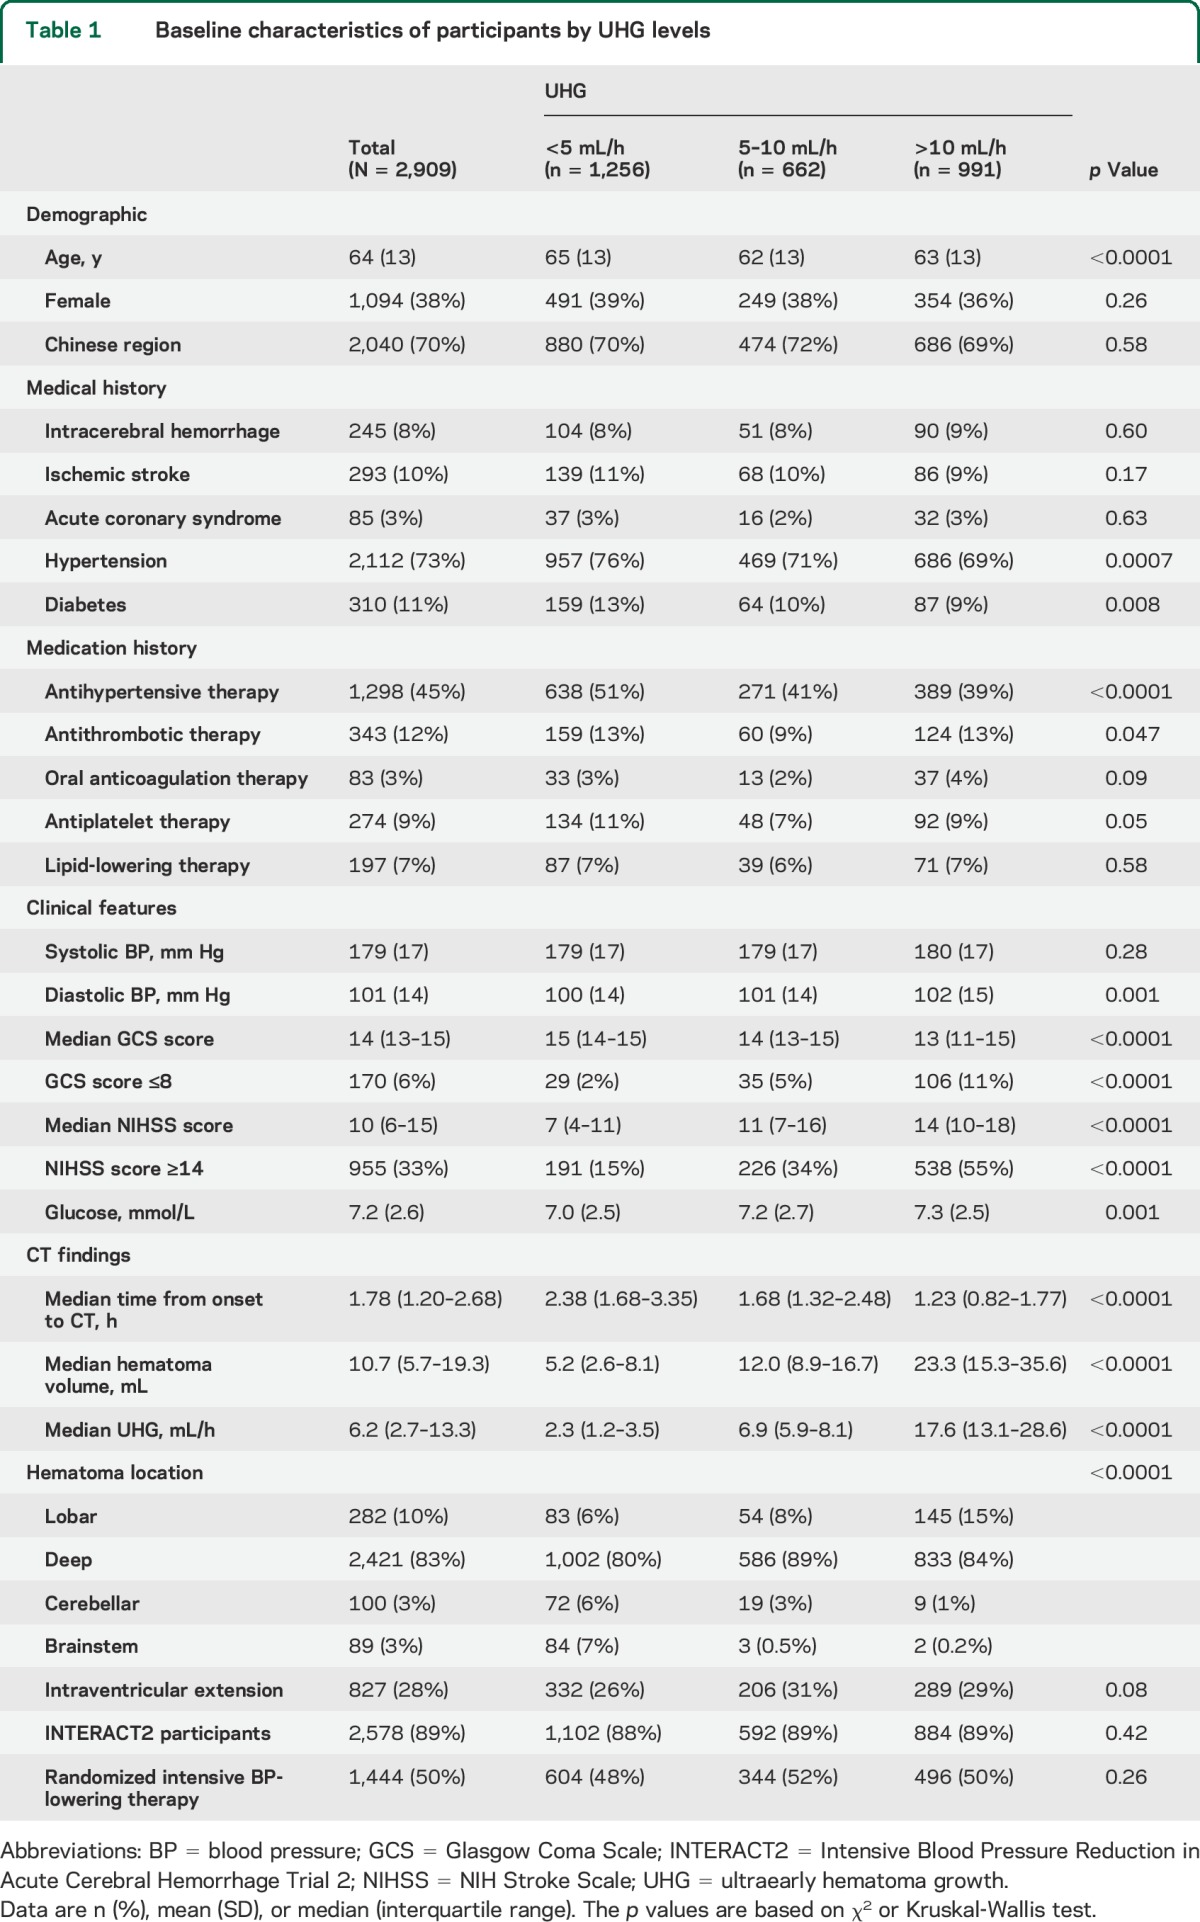
Table 2.
Association between UHG and clinical outcomes
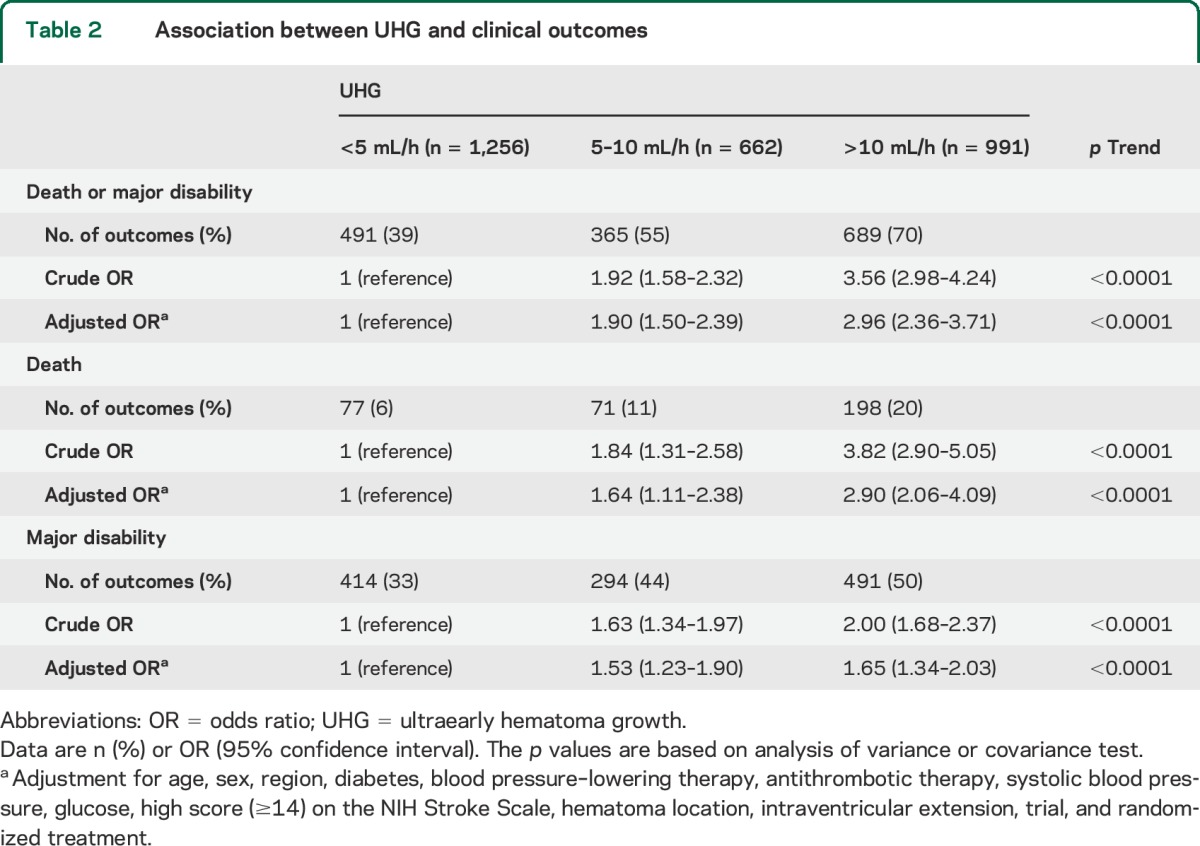
Figure 1. Association between UHG and clinical outcomes.
Association between UHG and clinical outcomes according to death or major disability (A), death (B), and major disability (C). Solid boxes represent odds ratio, and vertical lines 95% CI; <5 (mL/h) is reference. Results were adjusted for age, sex, region, diabetes, blood pressure–lowering therapy, antithrombotic therapy, systolic blood pressure, glucose, high score (≥14) on the NIH Stroke Scale, hematoma location, intraventricular extension, trial, and randomized treatment. CI = confidence interval; UHG = ultraearly hematoma growth.
UHG and hematoma growth in CT substudies.
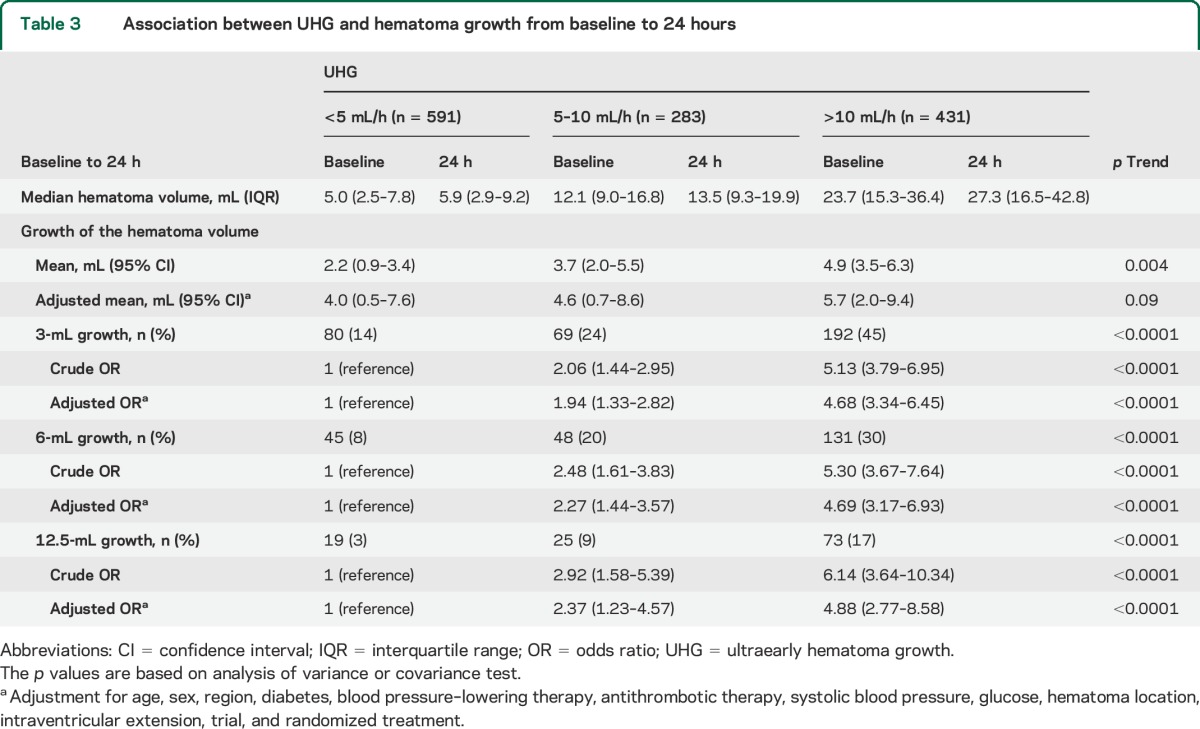
Among 1,310 selected patients of the CT substudies, 1,305 with information on time from onset to initial CT time were included in hematoma growth analysis. Baseline characteristics of 1,305 patients by speed of UHG are shown in table e-1 on the Neurology® Web site at Neurology.org. Associations between speed of UHG and absolute hematoma growth are shown in table 3. Speed of UHG was associated with mean absolute hematoma growth: 2.2 (95% CI 0.9–3.4), 3.7 (2.0–5.5), and 4.9 (3.5–6.3) mL for patient groups defined by UHG levels of <5, 5–10, and >10 mL/h, respectively (p = 0.004 for trend). However, the strength of this trend became insignificant after adjustment for age, sex, region, diabetes, BP-lowering therapy, antithrombotic therapy, SBP, glucose, hematoma location, intraventricular extension, trial, and randomized treatment (p = 0.09 for trend). Associations were observed when hematoma growth was used as binary outcomes with different cutoff points (3, 6, and 12.5 mL), even after adjustment for the same variables (p < 0.0001, p < 0.0001, and p < 0.0001 for trend, respectively).
Table 3.
Association between UHG and hematoma growth from baseline to 24 hours
Effects of randomized intensive BP lowering by speed of UHG.
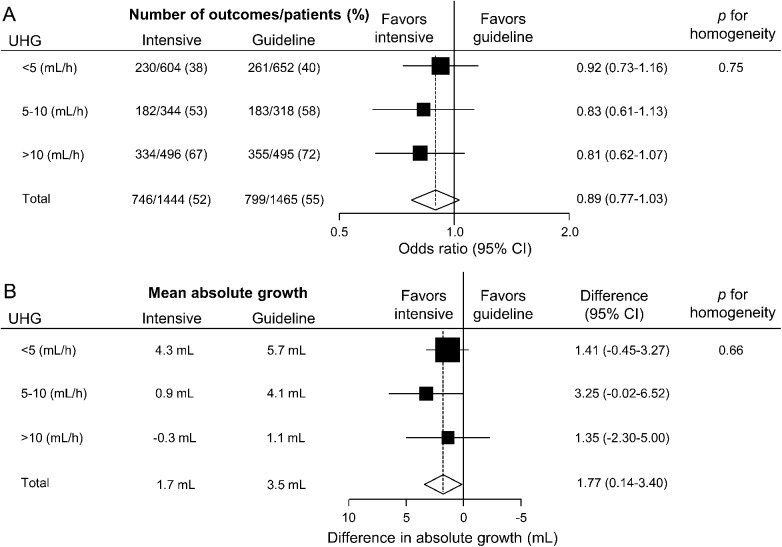
There was no evidence of differences in magnitude of the therapeutic effects of intensive BP lowering on death or major disability across the 3 speed groups of UHG: adjusted OR 0.92 (95% CI 0.73–1.16), 0.83 (0.61–1.13), and 0.81 (0.62–1.07) for UHG speeds of <5, 5–10, and >10 mL/h, respectively (p = 0.75 for homogeneity, figure 2A). There were also comparable effects of intensive BP lowering on mean absolute hematoma growth across the 3 speeds of UHG: absolute hematoma growth (mL) 1.41 (95% CI −0.45 to 3.27), 3.25 (−0.02 to 6.52), and 1.35 (−2.30 to 5.00), respectively (p = 0.66 for homogeneity, figure 2B).
Figure 2. Treatment effects on (A) death or major disability, and (B) absolute hematoma growth by UHG speeds.
Solid boxes represent estimates of treatment effect; horizontal lines, 95% CI; a diamond, the estimate and 95% CI for overall effect. (A) Areas of the boxes are proportional number of outcomes. Results were adjusted for trials. (B) Areas of the boxes are proportional to the reciprocal of the variance of estimates. Results were adjusted for trials and hematoma location. CI = confidence interval; UHG = ultraearly hematoma growth.
DISCUSSION
The present pooled analysis of the 2 INTERACT studies, which included more than 3,000 patients with acute ICH, demonstrates significant linear associations of the speeds of UHG with absolute hematoma growth at 24 hours and subsequent poor clinical outcome at 90 days. Increased hematoma growth and increased poor clinical outcome were observed for the 2 categories of UHG speeds greater than 5 mL/h. These data also indicate that intensive BP-lowering treatment is likely to have comparable beneficial effects irrespective of the speed of UHG.
Our analysis confirms the findings of a recent single-center study of 133 patients with acute ICH in which elevated UHG speeds of >10.2 mL/h were independently associated with hematoma growth and death or disability at 90 days.1 However, our study included a larger and broader range of patients, and demonstrated that faster UHG was related to both higher risks of death or major disability and hematoma growth, at least from the UHG speed of 5 mL/h, which is a lower cutoff point for prediction of 90-day death or major disability than in the prior report.
UHG speed represents the average speed of initial bleeding before brain imaging,1 where patients with faster UHG may have a larger culprit rupture point or fragility of vessel wall (e.g., advanced degenerative changes5,6 and amyloid angiopathy7) to cause continuous bleeding, rebleeding, and subsequent hematoma growth. In particular, both the infrequency of history of hypertension and high frequency of lobar hematoma location in patients with faster UHG might represent a causal relationship. Some patients with nonhypertensive ICH, in the case of amyloid angiopathy, might have fast UHG. In addition, rapid growth of hematoma may cause secondary injury in small vessels surrounding the hematoma and result in further hematoma growth.8,9 Because hematoma growth is a strong predictor of poor clinical outcome after acute ICH,10 larger hematoma growth observed in faster UHG groups is likely to be an important mechanism underlying the link between UHG speed and clinical outcome.
Treatment strategies using novel interventions (e.g., hemostatic agents) based on selection of patients with ICH at high risk of future hematoma growth have been proposed.9,11–13 Risk stratification of patients is usually based on the use of oral anticoagulants11,12 and/or spot sign on CT angiography.13 However, the clinical utility of the spot sign is limited by the requirement for clinical expertise and appropriate imaging (multislice spiral CT and contrast agent); and the optimal, standardized imaging procedures for the spot sign have not yet been established.14,15 Conversely, UHG speed arguably has greater potential as a simple marker for selecting patients with ICH at high risk of future hematoma growth for aggressive monitoring and treatment. Although caution is required generalizing these data to patients with large hematomas and in determining those with the most to gain (or be harmed) from surgical intervention.
The main results of the INTERACT2 study suggest that early intensive BP-lowering treatment can improve functional outcomes without any increase in mortality or serious adverse events in patients with acute ICH.4 In the present analysis, there was no evidence of heterogeneity in the effects of the study treatment on death or major disability, or on hematoma growth, among patients with different UHG speeds. Thus, intensive BP lowering is likely to be a generalizable treatment strategy across a broad range of patients with acute ICH.4
While key strengths of the INTERACT pooled analysis include the large sample size and heterogeneous patient population with early rigorous prospective evaluations after acute ICH, we recognize there are also several limitations. First, the present analysis was not prespecified. Therefore, the findings are exploratory and further validation is necessary. Second, UHG speed may have been underestimated because of misclassification in patients without accurate information on the time of onset of symptoms and in those whose bleeding had stopped before the initial imaging assessment. In these analyses, we have assumed a linear UHG but the bleeding may be markedly nonlinear. Third, because patients with a very high likelihood of early death and planned surgical evacuation of hematoma were excluded from the INTERACT studies, these findings may not be applicable to patients with severe ICH.
The speed of UHG had a strong positive association with absolute hematoma growth and subsequent poor clinical outcomes in a broad range of patients with ICH from heterogeneous populations. We have shown that the cutoff point for the speed of UHG at which higher risks of poor prognosis are seen from higher speeds after acute ICH is approximately 5 mL/h, which is lower than previously reported. These data extend the main results of INTERACT2 by showing that intensive BP lowering provided similar levels of treatment effects for clinical outcomes and hematoma growth irrespective of the speed of UHG. Thus, the speed of UHG appears to be a simple and validated predictor of poor outcome in patients with acute ICH.
Supplementary Material
GLOSSARY
- BP
blood pressure
- CI
confidence interval
- ICH
intracerebral hemorrhage
- INTERACT
Intensive Blood Pressure Reduction in Acute Cerebral Hemorrhage Trial
- mRS
modified Rankin Scale
- NIHSS
NIH Stroke Scale
- OR
odds ratio
- SBP
systolic blood pressure
- UHG
ultraearly hematoma growth
Footnotes
Supplemental data at Neurology.org
AUTHOR CONTRIBUTIONS
S.S., H.A., and C.S.A. contributed to the concept and rationale for the study. S.S., H.A., and Y.H. contributed to data analysis. S.S., H.A., E.H., C.D., R.B., Y.L., J.Z., E.J., J.W., P.M.L., T.R., R.I.L., J.C., and C.S.A. contributed to the interpretation of the results. All authors participated in the drafting and approval of the final manuscript and take responsibility for the content and interpretation of this article.
STUDY FUNDING
The INTERACT2 study was funded by the National Health and Medical Research Council of Australia.
DISCLOSURE
S. Sato holds a fellowship from the Uehara Memorial Foundation of Japan. H. Arima holds an Australian Research Council Future Fellowship. Y. Hirakawa holds a fellowship from the Uehara Memorial Foundation of Japan. E. Heeley, C. Delcourt, R. Beer, Y. Li, J. Zhang, E. Jüettler, J. Wang, P. Lavados, T. Robinson, R. Lindley, and J. Chalmers report no disclosures relevant to the manuscript. C. Anderson holds a National Health and Medical Research Council (NHMRC) Senior Principal Research Fellowship. Go to Neurology.org for full disclosures.
REFERENCES
- 1.Rodriguez-Luna D, Rubiera M, Ribo M, et al. Ultraearly hematoma growth predicts poor outcome after acute intracerebral hemorrhage. Neurology 2011;77:1599–1604. [DOI] [PubMed] [Google Scholar]
- 2.Anderson CS, Huang Y, Wang JG, et al. Intensive blood pressure reduction in acute cerebral haemorrhage trial (INTERACT): a randomised pilot trial. Lancet Neurol 2008;7:391–399. [DOI] [PubMed] [Google Scholar]
- 3.Delcourt C, Huang Y, Wang J, et al. The second (main) phase of an open, randomised, multicentre study to investigate the effectiveness of an intensive blood pressure reduction in acute cerebral haemorrhage trial (INTERACT2). Int J Stroke 2010;5:110–116. [DOI] [PubMed] [Google Scholar]
- 4.Anderson CS, Heeley E, Huang Y, et al. Rapid blood-pressure lowering in patients with acute intracerebral hemorrhage. N Engl J Med 2013;368:2355–2365. [DOI] [PubMed] [Google Scholar]
- 5.Marti-Fabregas J, Delgado-Mederos R, Granell E, et al. Microbleed burden and hematoma expansion in acute intracerebral hemorrhage. Eur Neurol 2013;70:175–178. [DOI] [PubMed] [Google Scholar]
- 6.Lou M, Al-Hazzani A, Goddeau RP, Jr, Novak V, Selim M. Relationship between white-matter hyperintensities and hematoma volume and growth in patients with intracerebral hemorrhage. Stroke 2010;41:34–40. [DOI] [PMC free article] [PubMed] [Google Scholar]
- 7.Brouwers HB, Biffi A, McNamara KA, et al. Apolipoprotein E genotype is associated with CT angiography spot sign in lobar intracerebral hemorrhage. Stroke 2012;43:2120–2125. [DOI] [PMC free article] [PubMed] [Google Scholar]
- 8.Fisher CM. Pathological observations in hypertensive cerebral hemorrhage. J Neuropathol Exp Neurol 1971;30:536–550. [DOI] [PubMed] [Google Scholar]
- 9.Brouwers HB, Greenberg SM. Hematoma expansion following acute intracerebral hemorrhage. Cerebrovasc Dis 2013;35:195–201. [DOI] [PMC free article] [PubMed] [Google Scholar]
- 10.Delcourt C, Huang Y, Arima H, et al. Hematoma growth and outcomes in intracerebral hemorrhage: the INTERACT1 study. Neurology 2012;79:314–319. [DOI] [PubMed] [Google Scholar]
- 11.Kuwashiro T, Yasaka M, Itabashi R, et al. Effect of prothrombin complex concentrate on hematoma enlargement and clinical outcome in patients with anticoagulant-associated intracerebral hemorrhage. Cerebrovasc Dis 2011;31:170–176. [DOI] [PubMed] [Google Scholar]
- 12.Sarode R, Matevosyan K, Bhagat R, Rutherford C, Madden C, Beshay JE. Rapid warfarin reversal: a 3-factor prothrombin complex concentrate and recombinant factor VIIa cocktail for intracerebral hemorrhage. J Neurosurg 2012;116:491–497. [DOI] [PubMed] [Google Scholar]
- 13.Huynh TJ, Flaherty ML, Gladstone DJ, et al. Multicenter accuracy and interobserver agreement of spot sign identification in acute intracerebral hemorrhage. Stroke 2014;45:107–112. [DOI] [PubMed] [Google Scholar]
- 14.Chakraborty S, Blacquiere D, Lum C, Stotts G. Dynamic nature of the CT angiographic “spot sign”. Br J Radiol 2010;83:e216–e219. [DOI] [PMC free article] [PubMed] [Google Scholar]
- 15.d'Esterre CD, Chia TL, Jairath A, Lee TY, Symons SP, Aviv RI. Early rate of contrast extravasation in patients with intracerebral hemorrhage. AJNR Am J Neuroradiol 2011;32:1879–1884. [DOI] [PMC free article] [PubMed] [Google Scholar]
Associated Data
This section collects any data citations, data availability statements, or supplementary materials included in this article.


