Abstract
Objectives:
To determine time to vigabatrin (VGB, Sabril; Lundbeck, Deerfield, IL) induced retinal damage in children with infantile spasms (IS) and to identify risk factors for VGB-induced retinal damage (VGB-RD).
Methods:
Observational cohort study including 146 participants (68 female, 81 male) with IS, an age-specific epilepsy syndrome of early infancy, treated with VGB. Participants ranged from 3 to 34.9 months of age (median 7.6 months). The median duration of VGB treatment was 16 months (range 4.6–78.5 months). Electroretinograms (ERGs) were performed according to the Standards of the International Society for Clinical Electrophysiology of Vision. Inclusion required baseline (pre-VGB or within 4 weeks of starting VGB treatment) and at least 2 follow-up ERGs. Significant reduction from baseline of the 30-Hz ERG flicker amplitude on 2 consecutive visits identified VGB-RD. Kaplan-Meier survival analyses depicted the effect of duration of VGB on VGB-RD.
Results:
These data represent the largest survival analysis of children treated with VGB who did not succumb to retinal toxicity during the study. Thirty of the 146 participants (21%) showed VGB-RD. The ERG amplitude reduced with duration of VGB treatment (p = 0.0004) with no recovery after VGB cessation. With 6 and 12 months of VGB treatment, 5.3% and 13.3%, respectively, developed VGB-RD. There was neither effect of age of initiation of VGB treatment nor sex of the child on survival statistics and no significant effect of cumulative dosage on the occurrence of VGB-RD.
Conclusions:
Minimizing VGB treatment to 6 months will reduce the prevalence of VGB-RD in patients with IS.
The antiepileptic drug vigabatrin (VGB, Sabril; Lundbeck, Deerfield, IL) is associated with vision defects.1,2 VGB is frequently used in the treatment of infantile spasms (IS).3 IS are an age-specific epilepsy syndrome occurring in early infancy. “SABRIL is indicated as monotherapy for pediatric patients with infantile spasms 1 month to 2 years of age for whom the potential benefits outweigh the potential risk of vision loss.”4
VGB-induced retinal toxicity is manifested by visual field loss, which occurs in 52% of adults and 34% of children treated with VGB.2 Visual field testing is dependent on the ability to respond to the presence of peripheral targets. Visual field testing in children with neuro-developmental delay is possible,5,6 but not in those younger than 2 years.
Reduction in the amplitude of the light-adapted 30-Hz flicker cone electroretinogram (ERG) is associated with VGB-attributed field loss.7,8 The 30-Hz flicker ERG provides assessment of VGB retinal damage (VGB-RD) in infants.9–15
Because of the known vision loss that has been attributed to VGB in the United States, physicians are required to participate in the Support, Help and Resources for Epilepsy program.16 A Visual Assessment Schedule16 is also required.
For patients aged 2 years and younger, the ERG is recommended for primary screening with testing at baseline (pre-VGB or within 4 weeks of starting VGB treatment) and at 3-month intervals.16,17
The objectives of the study were to provide evidence that the 30-Hz flicker ERG is a useful marker to quantify change in visual function over time in children taking VGB. It was hypothesized that the prevalence of VGB-RD varies with duration of VGB treatment. The secondary hypotheses were that cumulative dosage, age of initiation of VGB treatment, and sex of the child are related to the prevalence of VGB-RD.
METHODS
This was an observational cohort study investigating the outcome of retinal damage as measured by ERG including children with IS treated with VGB. Children had been referred to the Hospital for Sick Children (SickKids) Visual Electrophysiology Unit for vision monitoring.
Study population.
Children treated with VGB underwent ERG testing including assessment of 30-Hz flicker cone retinal responses, with testing at baseline and at regular intervals as recommended.17 Data were collected until after VGB was stopped. The study was conducted at SickKids, Department of Ophthalmology and Vision Sciences from September 1998 to December 2012. Previous publications by our group include some of the data reported in the current study.9–12,18,19
Inclusion criteria.
To be included in the current study, a clinical diagnosis of IS was confirmed by one of the authors (O.C.S.).20 Other inclusion criteria were a baseline ERG (before VGB treatment or within 4 weeks of treatment) and a minimum of 2 follow-up ERG visits. One hundred fifty-three children met these inclusion criteria.
For analysis, the post-VGB visits were specified with respect to 3-month time bins since baseline. Each time bin represented 3-month (±1.5 months) intervals. Exclusion criteria were any eye disease other than findings associated typically with IS and any previous intraocular surgery. Data were excluded if the baseline result was considered unreliable.
Standard protocol approvals, registrations, and patient consents.
Procedures followed were in accordance with SickKids ethical standards and conformed to the tenets of the Declaration of Helsinki. The study was approved by the Research Ethics Board at SickKids and written informed consent was obtained from parents or guardians.
Clinical evaluation.
All testing was performed in the Visual Electrophysiology Unit at SickKids. ERGs were performed according to standards of the International Society for Clinical Electrophysiology of Vision21 using Ganzfeld illumination with the Espion E2 System (Diagnosys LLC, Lowell, MA) or the LKC Utas 3000 (LKC Technologies, Inc., Gaithersburg, MD). Children were sedated with oral chloral hydrate (80 mg/kg of body weight; maximum single dose of 1 g). Pupil dilation was achieved with 1% cyclopentolate and 2.5% phenylephrine. Bipolar Burian-Allen electrodes (Hansen Ophthalmic Development Laboratory, Iowa City, IA) were used to record ERGs. The ERG response evaluated for the current study was the light-adapted 2.29 flicker ERG (LA 2.29 flicker): a 2.29 candela/s/m2 light flickering at 30 Hz on a 30 candela/s background luminance. For the purpose of this study, the LA 2.29 flicker amplitude was taken as the average of right and left eye responses.
Potential bias.
The average of right and left eye ERG response was used to avoid statistical error arising from lack of independence between right and left eye data. Sometimes the response from one eye was artificially reduced for technical reasons including Bell phenomenon whereby one eye elevates during testing; in these cases, the mean ERG responses would be less affected than individual eye testing.
To avoid the confounder of ERG changes during development, LA 2.29 flicker amplitudes were adjusted for age using published normal data from our laboratory.22 To achieve normalization, the difference between the log LA 2.29 flicker amplitude and age-corrected value was calculated for each data point; this age-adjusted LA 2.29 flicker amplitude (log µV) was the ERG response of interest for this study. The normal 95% confidence interval is ±0.21 log µV from the age-expected ERG amplitude.22
The definition of VGB-RD was significant reduction from baseline (pre-VGB) LA 2.29 flicker amplitude on 2 consecutive visits. Significant reduction was taken as change in amplitude exceeding normal intervisit change; 6 non-VGB-treated children (aged 0.6–1.6 years of age) with IS had ERG tests on 2 occasions. The median LA 2.29 flicker amplitude after age correction reduced by 14% over time; the greatest change was 0.16 log unit reduction (31%). A conservative estimate of reduction was taken as change over 2 visits greater than 0.2 log units (37% reduction). This reduction is considered clinically significant and is supported by published reports in which the requirement for significant reductions of the LA 30–32 Hz flicker amplitude varies from 37%23 (0.2 log units) to 52%24 (0.32 log units). The time of VGB-RD was taken as the first of 2 occurrences of significant reduction of LA 2.29 flicker ERG.
To achieve reliability of baseline responses, those data potentially contaminated with artifact were removed. The criteria for removal were reduced ERG amplitude compared with the 95% confidence limits of normal data22 in the absence of follow-up data that confirmed the low amplitude of the baseline response within 4 months.
Statistical methods.
Kaplan-Meier survival analyses25 were used to depict the effect of duration of VGB on survival (the proportion who never acquired VGB-RD). The time to event was described as the time from VGB commencement to time of VGB-RD.
Other analyses included the Cox proportional hazard models, analysis of variance (ANOVA) with repeated measures, and the log-rank test.26 Cox proportional hazard models were used to identify differences in survival between those who entered the study at a younger (<12 months) vs older (≥12 months) age and according to sex of the child. Repeated-measures ANOVA was used to assess change in the age-corrected LA 2.29 flicker amplitude over time. The log-rank test26 tested for differences in cumulative dosage between children who developed VGB-RD and those who did not at different treatment durations.
RESULTS
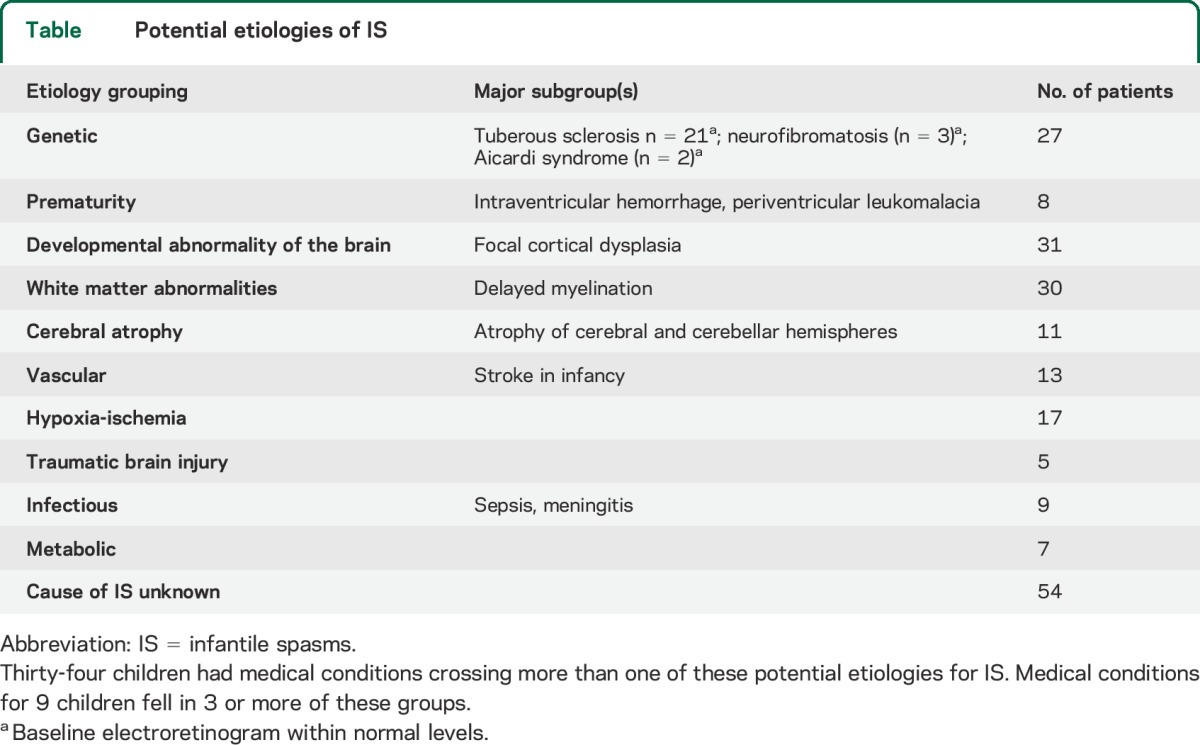
Of the 158 study participants, data from 12 children were excluded. In one of these, the child had an ERG consistent with congenital stationary night blindness, and in 11, the baseline data were considered unreliable. For each of the remaining 146 children, one of the authors (O.C.S.) ascertained etiologies that might be associated with the child's IS (table).
Table.
Potential etiologies of IS
For the 146 participants, the median age of the baseline ERG test was 7.6 months (25th percentile = 6 months, 75th percentile = 11.4 months) with a range of 3 to 34.9 months. The median duration of follow-up was 16.0 months (25th percentile = 11.7 months, 75th percentile = 23.9 months) with a range of 4.6 to 78.5 months. The number of visits per child varied from 3 to 10, with a median of 4 visits. VGB visits were specified with respect to 3-month time bins since VGB initiation and included 83 children tested within the 3-month time bin, 82 within 6-month time bin, 82 in the 9-month bin, 72 in the 12-month bin, and 37, 42, 20, 18, 20, 8, 5, 4, 6, 2, 2, and 2 within 15- to 48-month time bin, respectively. Eight children were treated with VGB for more than 51 months. Thirty of the 146 participants (21%) showed VGB-RD: 11 girls and 19 boys. Figure 1 displays ERG waveforms from 2 children, one who developed VGB-RD and one who did not. Figure 1A displays the sequential ERG from a child who showed reduction in LA 2.29 flicker amplitude, which was sustained and VGB-RD was confirmed. Figure 2 displays waveforms from a child who did not develop VGB-RD.
Figure 1. Raw ERG waveforms from a child who developed VGB-RD and one who did not.
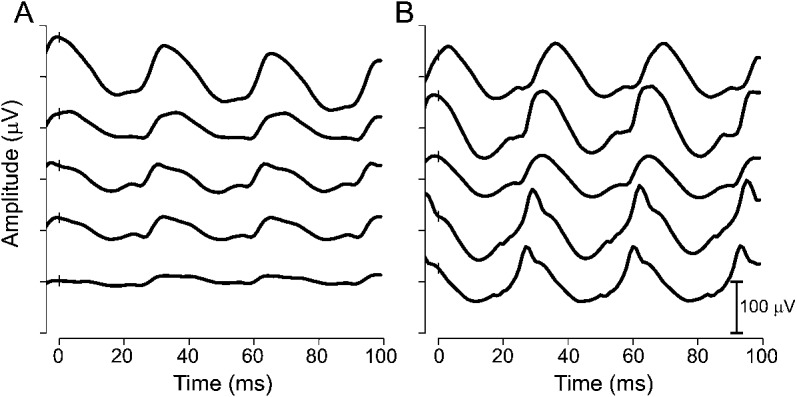
Light-adapted 2.29 flicker waveforms plotted against time (see insert for amplitude scale). (A) Male diagnosed with IS at 12 months of age and started VGB at 13 months of age. ERG waveforms are shown for the baseline test (top trace) and for 4 subsequent assessments at 3, 6, 10, and 13 months of VGB treatment. VGB-RD occurred after 3 months of VGB treatment. (B) Male diagnosed with IS at 4 months of age and started VGB at 7 months of age. ERG waveforms are shown for the baseline test (top trace) and for 4 follow-up assessments at 2, 6, 12, and 16 months of VGB treatment. There was no evidence of VGB-RD. ERG = electroretinogram; IS = infantile spasms; VGB = vigabatrin; VGB-RD = VGB-induced retinal damage.
Figure 2. Survival curve showing proportion of children without VGB-RD, according to duration of VGB treatment.
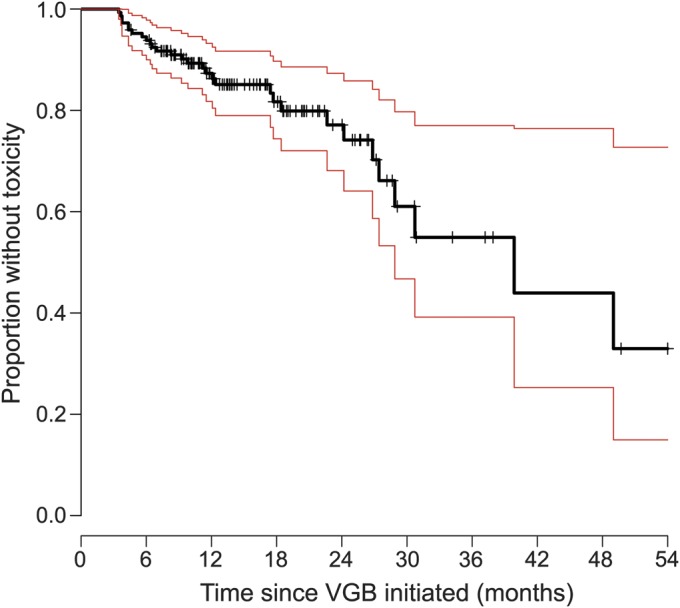
The black solid line represents the Kaplan-Meier estimator of the survival function. Red lines represent 95% confidence limits. The small vertical tick-marks represent withdrawal from the study resulting in censoring of this participant from the sample. VGB = vigabatrin; VGB-RD = VGB-induced retinal damage.
Figure 2 displays survival curves that represent a Kaplan-Meier estimator; the proportion of children with no VGB-RD (survival) is shown against the time on drug treatment. With 6, 12, and 30 months of VGB treatment, 5.3%, 13.33%, and 38% of children, respectively, developed VGB-RD. VGB-RD, assessed by the criteria detailed here, did not occur in 33% of the children who had been treated with VGB.
Cox proportional hazard models revealed no difference in the proportion of children who developed VGB-RD according to sex or age of VGB initiation (<12 months vs ≥12 months of age) (figure e-1A on the Neurology® Web site at Neurology.org). Although more boys than girls developed VGB-RD after 18 months of VGB treatment (figure e-2B), the difference was not significant.
Figure 3 depicts the LA 2.29 flicker amplitude plots for all children tested before and during VGB treatment. Repeated-measures ANOVA identified that the age-corrected LA 2.29 flicker amplitude reduced by 0.25 log units (44%) during the first 39 months of treatment (p = 0.0004). This is reflected by reduction to the median LA 2.29 flicker amplitude with treatment duration as depicted by the black line in figure 3.
Figure 3. Individual data points of age-adjusted LA 2.29 flicker amplitude plotted against time on VGB in months.
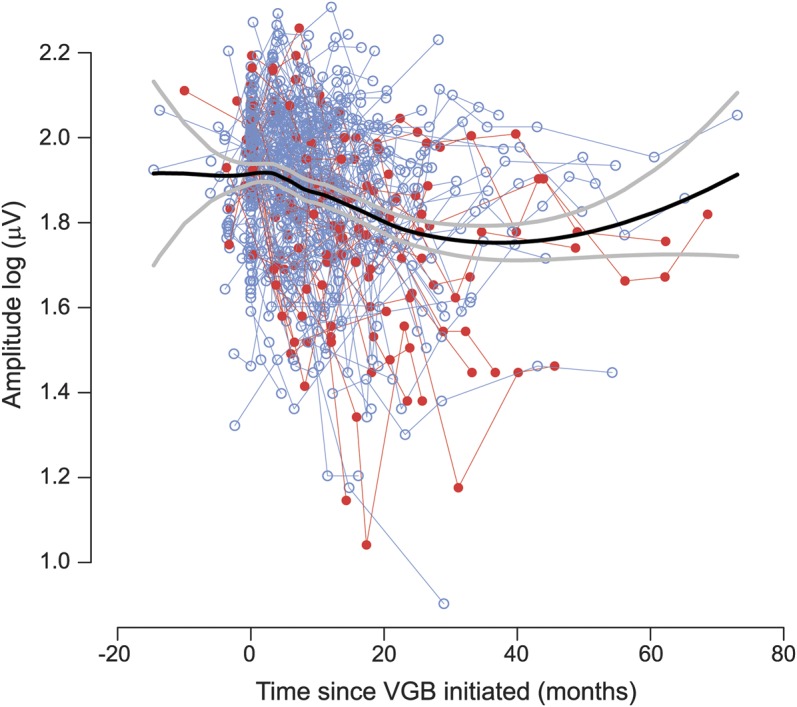
Individual thin lines join data points from individual participants. The thick black line represents the median amplitude. The thick gray line represents the 95% confidence interval. Data plots in red represent cases in which VGB-RD had occurred during the testing period and blue plots represent absence of VGB-RD. Round symbols represent the data points when the child was still receiving VGB. VGB = vigabatrin; VGB-RD = VGB-induced retinal damage.
Data from those who developed toxicity are presented separately from those who did not (figure e-2). After VGB discontinuation in those who did not succumb to VGB-RD (figure e-2C), an initial reduction was apparent and 12% of this group showed a deteriorating response. For those who developed VGB-RD (figure e-2B), the median response reduced during the first 2 years and then leveled off, reaching a plateau that was retained after cessation of VGB (figure e-2D).
Whether VGB-RD was related to cumulative dosage at each time bin is illustrated in figure 4. In the first 12 months of VGB treatment, there was no difference in cumulative dosage range between those who developed VGB-RD and those who did not. After 12 months of VGB treatment, cumulative dosage was higher for those who developed VGB-RD compared with those who did not develop VGB-RD; the difference was not significant.
Figure 4. Boxplots showing effect of cumulative dosage on VGB-RD.
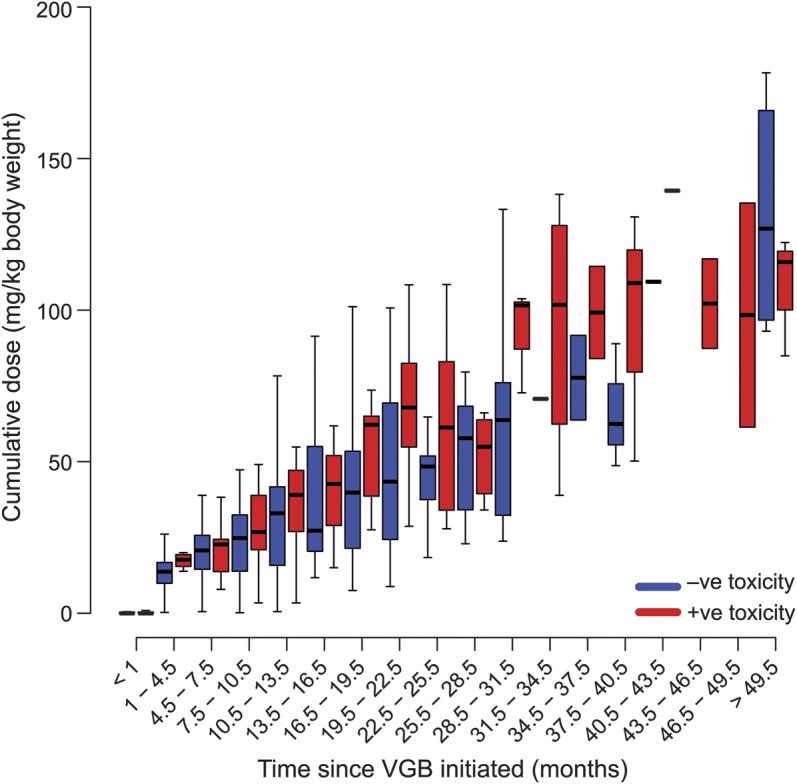
The x-axis identifies time bin of drug treatment (time on VGB, months). The y-axis identifies cumulative dose of VGB (g/kg) and red/blue bars identify presence/absence of VGB-RD, respectively. Each individual box represents the range in cumulative dosage. The boxes represent the 25th and 75th percentiles of cumulative dosage and the band near the middle of the box is the median. The ends of the whiskers represent the 1.5th and 98.5th percentile. VGB = vigabatrin; VGB-RD = VGB-induced retinal damage.
DISCUSSION
These data, representing the largest cohort of children with IS investigated for VGB toxicity, support our hypothesis that the prevalence of VGB-RD increases with longer VGB treatment. Thirty of the 146 participants (21%) showed VGB-RD. This is a lower prevalence than other studies. A systematic review, which ranked studies according to study design, found the prevalence of toxicity in children to be 34% (confidence interval 25%–42%).2 Data in the systemic review included children between 2.5 and 21 years of age who had received VGB treatment between 2 and 4 years.2 Eight of 28 children (29%) aged 1 to 19 years who received VGB treatment developed a visual field defect evidenced using an adapted double arc perimeter.5 These aforementioned studies provide evidence of visual field defect attributed to VGB treatment in pediatric populations. The reason for the lower prevalence of toxicity in the current study is the shorter duration of VGB treatment for most of the participants.
Another difference between our study and the above-mentioned studies is the ERG outcome measure for toxicity rather than visual field assessment. Since finding association between LA 30-Hz flicker and VGB-attributed field loss,7,8 ERGs have been used to investigate VGB-associated deficit in children; 30-Hz flicker and cone b-wave amplitude responses are reduced in children treated with VGB.13,14 Previously, our group found reductions in 30-Hz flicker cone amplitude and cone response b-wave amplitude after 6 months of VGB treatment, but no consistent change in ERG scotopic responses.9 Oscillatory potentials reduce with VGB treatment,18 but recover after cessation of VGB.11 The LA 30-Hz flicker amplitude does not recover after cessation of VGB, thus we concluded that the 30-Hz abnormality was an effect of toxicity rather than a drug effect.11 In the current study, the LA 2.29 flicker ERG amplitude reduced during VGB treatment. However, this differed from another study including 114 pediatric and young adult patients treated with VGB, 27 of whom were tested longitudinally27; here, an overall ERG reduction was not found and abnormal 30-Hz flicker amplitude occurred infrequently. The difference might be explained by the expression of our data as reduction in amplitude from baseline minimizing confounds not related to VGB, larger sample size, the young age of the cohort, and inclusion of only those with the diagnosis of IS.
Male predilection to VGB toxicity occurs in VGB-treated individuals.17,28,29 There was no effect of sex in the current study, although after 18 months of VGB treatment, more boys than girls showed VGB-RD. The lack of significance in the current study may be related to the reduced number of participants treated with VGB for treatment durations longer than 18 months.
A higher proportion of adults (mean age of 40 years) than children (mean age of 10 years) develop visual field loss with VGB.2 To our knowledge, there has been no study comparable to the current study evaluating the effect of age of VGB initiation on prevalence of VGB-RD. However, the lack of difference in the proportion of participants who developed VGB-RD when the treatment was started before 12 months of age compared with after 12 months of age suggests that the effect of retinal development had no major role on the occurrence of VGB-RD.
VGB-treated individuals capable of visual field assessment show increased frequency of visual field defect with increased cumulative VGB dose.17,29 In the current study, the effect of cumulative drug dose could not be separated from that of duration of VGB treatment because these factors were co-related. For the first 12 months of VGB treatment, the ranges of cumulative dosage were comparable between those patients who developed VGB-RD and those who did not suggesting that for these short treatment durations, cumulative dose did not contribute to VGB-RD. Treatment periods longer than 2 years were not associated with cumulative dosage effect because of depletion in numbers of participants and associated increased data variability.
Multiple factors are responsible for VGB-RD; at any treatment period, there was a possibility for a child to develop VGB-RD and some children never developed VGB-RD despite considerable treatment duration. Intersubject variability in the current data was greatest after 24 months of drug treatment. This is explained by reduction in numbers of VGB-treated children with only 2 children remaining at each of the 42, 45, and 48 VGB treatment month time bins. Likewise, the greater intersubject variability in those who developed VGB-RD compared with those who did not is also explained by lower number of participants in the former group. In those without VGB-RD, the reduction in amplitude after cessation of the drug might result from fluctuating γ-aminobutyric acid (GABA) levels when VGB was discontinued or tapered. In addition, change in antiepileptic medications might affect the ERG; adolescents treated with valproate and carbamazepine have deficits in color perception thought to occur as a result of changes in calcium and sodium membrane conductances.30 Retinal ganglion cell toxicity has also been attributed to these drugs.31
VGB toxicity has a complex pathophysiology occurring as a result of accumulation of VGB in the retina and/or elevated levels of retinal GABA. In humans, changes to the electrooculogram,32 cone and rod system,32,33 and disruption on retinal nerve fiber layer34 occur with VGB treatment. A change in the electrooculogram is probably an early, possibly reversible retinal defect attributed to VGB, resulting from disruption at the retinal pigment epithelium/photoreceptors border. This disruption might result in reduced ocular blood flow and increased metabolic stress representing a prelude to irreversible damage.35 With VGB treatment, retinal GABA levels increase markedly and an already stressed retina may be more susceptible to high GABA levels resulting in abnormal activation of GABAC receptors with an ensuing excitotoxicity.35 GABAC receptors involved in VGB-RD are located in amacrine, bipolar, Müller and ganglion cells, and photoreceptor cells,36 all of which contribute to the 30-Hz flicker ERG.
There are limitations of this study. Approximately 50% of children in the current study were treated with other antiepileptic medications. In a previous study, we found that the combination of other antiepileptic medications with VGB increases the prevalence of VGB-RD compared with VGB alone.12 There is a lack of data at all time intervals with loss of participants to follow-up. Loss to follow-up occurred if (1) there was no response to VGB and the drug treatment was stopped, (2) there was evidence of VGB-RD and the drug was stopped, or (3) changes to prescribing practice resulted in shortening of VGB treatment duration in the last 10 years of the study. Factors such as the underlying reason for IS and different times of onset for IS from prenatal to perinatal and postnatal onset may create confounding influences. Family history of retinal disease was not considered and early heritable retinal disease may not have been detected. This study did not take into account other factors that have been suggested to contribute to VGB-RD, such as light exposure and the levels of the amino acid taurine37–40 or unknown polymorphisms.
In a pediatric population, minimizing VGB treatment for 6 months or less reduced the prevalence of VGB-RD in patients with IS.
Supplementary Material
ACKNOWLEDGMENT
The authors thank William Logan, MD, for his role in facilitating referrals from Neurology to the Visual Electrophysiology Unit, Rita Nobile for data collection and analysis up to 2008, and Annie Dupuis, biostatistician, for help with statistical analyses.
GLOSSARY
- ANOVA
analysis of variance
- ERG
electroretinogram
- GABA
γ-aminobutyric acid
- IS
infantile spasms
- VGB
vigabatrin
- VGB-RD
vigabatrin-induced retinal damage
Footnotes
Supplemental data at Neurology.org
AUTHOR CONTRIBUTIONS
Westall was responsible for design or conceptualization of the study. Westall, Wright, Cortese, Snead, and Buncic contributed to drafting and/or revising the manuscript for intellectual content. Westall, Wright, Cortese, and Kumarappah were responsible for interpretation and analysis of data.
STUDY FUNDING
This study was funded by Lundbeck LLC (Deerfield, IL) as an investigator-initiated study and by the Canadian Institutes for Health Research (CIHR). Canadian Institutes of Health Research/Canada (CIHR) 51712-1 and Lundbeck LLC (Deerfield, IL).
DISCLOSURE
C. Westall has received industry-sponsorship from Lundbeck Pharmaceuticals for the investigator initiated study “Markers of neuro-retinal change over time in children with infantile spasms.” T. Wright, F. Cortese, A. Kumarappah, O. Snead, and J. Buncic report no disclosures relevant to the manuscript. Go to Neurology.org for full disclosures.
REFERENCES
- 1.Eke T, Talbot JF, Lawden MC. Severe persistent visual field constriction associated with vigabatrin. BMJ 1997;314:180–181. [DOI] [PMC free article] [PubMed] [Google Scholar]
- 2.Maguire MJ, Hemming K, Wild JM, Hutton JL, Marson AG. Prevalence of visual field loss following exposure to vigabatrin therapy: a systematic review Epilepsia 2010;51:2423–2431.21070215 [Google Scholar]
- 3.Go CY, Mackay MT, Weiss SK, et al. Evidence-based guideline update: medical treatment of infantile spasms. Report of the guideline development subcommittee of the American Academy of Neurology and the Practice Committee of the Child Neurology Society. Neurology 2012;78:1974–1980. [DOI] [PMC free article] [PubMed] [Google Scholar]
- 4.Lundbeck. Permanent vision loss. Available at: http://sabril.net/hcp/vision_loss_data/. Accessed May 23, 2014.
- 5.Agrawal S, Mayer DL, Hansen RM, Fulton AB. Visual fields in young children treated with vigabatrin. Optom Vis Sci 2009;86:767–773. [DOI] [PubMed] [Google Scholar]
- 6.Werth R, Schadler G. Visual field loss in young children and mentally handicapped adolescents receiving vigabatrin. Invest Ophthalmol Vis Sci 2006;47:3028–3035. [DOI] [PubMed] [Google Scholar]
- 7.Ponjavic V, Andreasson S. Multifocal ERG and full-field ERG in patients on long-term vigabatrin medication. Doc Ophthalmol 2001;102:63–72. [DOI] [PubMed] [Google Scholar]
- 8.Harding GF, Wild JM, Robertson KA, Rietbrock S, Martinez C. Separating the retinal electrophysiologic effects of vigabatrin: treatment versus field loss. Neurology 2000;55:347–352. [DOI] [PubMed] [Google Scholar]
- 9.Buncic JR, Westall CA, Panton CM, Munn JR, MacKeen LD, Logan WJ. Characteristic retinal atrophy with secondary “inverse” optic atrophy identifies vigabatrin toxicity in children. Ophthalmology 2004;111:1935–1942. [DOI] [PMC free article] [PubMed] [Google Scholar]
- 10.Westall CA, Logan WJ, Smith K, Buncic JR, Panton CM, Abdolell M. The Hospital for Sick Children, Toronto, longitudinal ERG study of children on vigabatrin. Doc Ophthalmol 2002;104:133–149. [DOI] [PMC free article] [PubMed] [Google Scholar]
- 11.Westall CA, Nobile R, Morong S, Buncic JR, Logan WJ, Panton CM. Changes in the electroretinogram resulting from discontinuation of vigabatrin in children. Doc Ophthalmol 2003;107:299–309. [DOI] [PMC free article] [PubMed] [Google Scholar]
- 12.McCoy B, Wright T, Weiss S, Go C, Westall CA. Electroretinogram changes in a pediatric population with epilepsy: is vigabatrin acting alone? J Child Neurol 2011;26:729–733. [DOI] [PMC free article] [PubMed] [Google Scholar]
- 13.Spencer EL, Harding GF. Examining visual field defects in the paediatric population exposed to vigabatrin. Doc Ophthalmol 2003;107:281–287. [DOI] [PubMed] [Google Scholar]
- 14.Harding GF, Spencer EL, Wild JM, Conway M, Bohn RL. Field-specific visual-evoked potentials: identifying field defects in vigabatrin-treated children. Neurology 2002;58:1261–1265. [DOI] [PubMed] [Google Scholar]
- 15.Sergott RC, Westall CA. Primer on visual field testing, electroretinography, and other visual assessments for patients treated with vigabatrin. Acta Neurol Scand Suppl 2011;192:48–56. [DOI] [PubMed] [Google Scholar]
- 16.Lundbeck. Support, Help, and Resources for Epilepsy (SHARE) program. Available at: http://www.lundbeckshare.com/. Accessed January 10, 2014.
- 17.Sergott RC, Wheless JW, Smith MC, et al. Evidence-based review of recommendations for visual function testing in patients treated with vigabatrin. Neuro-Ophthalmology 2010;34:20–35. [Google Scholar]
- 18.Morong S, Westall CA, Nobile R, et al. Longitudinal changes in photopic OPs occurring with vigabatrin treatment. Doc Ophthalmol 2003;107:289–297. [DOI] [PMC free article] [PubMed] [Google Scholar]
- 19.Westall CA, Morong SE, Buncie JR, Logan W. Importance of baseline for electrophysiology assessment of drug induced changes in children with seizures. J Vis 2002;2:92a. [Google Scholar]
- 20.Widjaja E, Kis A, Go C, Raybaud C, Snead OC, Smith ML. Abnormal white matter on diffusion tensor imaging in children with new-onset seizures. Epilepsy Res 2013;104:105–111. [DOI] [PubMed] [Google Scholar]
- 21.Marmor MF, Fulton AB, Holder GE, Miyake Y, Brigell M, Bach M. ISCEV standard for full-field clinical electroretinography (2008 update). Doc Ophthalmol 2009;118:69–77. [DOI] [PubMed] [Google Scholar]
- 22.Westall CA, Panton CM, Levin AV. Time course for maturation of electroretinogram response, from infancy to adulthood. Doc Ophthalmol 1999;96:355–379. [DOI] [PubMed] [Google Scholar]
- 23.Birch DG, Anderson JL. Standardized full-field electroretinography: normal values and their variation with age. Arch Ophthalmol 1992;110:1571–1576. [DOI] [PubMed] [Google Scholar]
- 24.Grover S, Fishman GA, Birch DG, Locke KG, Rosner B. Variability of full-field electroretinogram responses in subjects without diffuse photoreceptor cell disease. Ophthalmology 2003;110:1159–1163. [DOI] [PubMed] [Google Scholar]
- 25.Therneau T. A package for survival analysis in S: R package version 2.37-7 [online]. Available at: http://CRAN.R-project.org/package=survival. Accessed March 3, 2014.
- 26.Harrington DP, Fleming TR. A class of rank test procedures for censored survival data. Biometrika 1982;69:553–566. [Google Scholar]
- 27.Moskowitz A, Hansen RM, Eklund SE, Fulton AB. Electroretinographic (ERG) responses in pediatric patients using vigabatrin. Doc Ophthalmol 2012;124:197–209. [DOI] [PubMed] [Google Scholar]
- 28.Sergott RC. Recommendations for visual evaluations of patients treated with vigabatrin. Curr Opin Ophthalmol 2010;21:442–446. [DOI] [PubMed] [Google Scholar]
- 29.Wild JM, Ahn HS, Baulac M, et al. Vigabatrin and epilepsy: lessons learned. Epilepsia 2007;48:1318–1327. [DOI] [PubMed] [Google Scholar]
- 30.Verrotti A, Lobefalo L, Priolo T, et al. Color vision in epileptic adolescents treated with valproate and carbamazepine. Seizure 2004;13:411–417. [DOI] [PubMed] [Google Scholar]
- 31.Aktas Z, Cansu A, Erdogan D, et al. Retinal ganglion cell toxicity due to oxcarbazepine and valproic acid treatment in rat. Seizure 2009;18:396–399. [DOI] [PubMed] [Google Scholar]
- 32.Arndt CF, Derambure P, Defoort-Dhellemmes S, Hache JC. Outer retinal dysfunction in patients treated with vigabatrin. Neurology 1999;52:1201–1205. [DOI] [PubMed] [Google Scholar]
- 33.Coupland SG, Zackon DH, Leonard BC, Ross TM. Vigabatrin effect on inner retinal function. Ophthalmology 2001;108:1493–1496; discussion 1497–1498. [DOI] [PubMed] [Google Scholar]
- 34.Kjellstrom U, Andreasson S, Ponjavic V. Attenuation of the retinal nerve fibre layer and reduced retinal function assessed by optical coherence tomography and full-field electroretinography in patients exposed to vigabatrin medication. Acta Ophthalmol 2014;92:149–157. [DOI] [PubMed] [Google Scholar]
- 35.Wang QP, Jammoul F, Duboc A, et al. Treatment of epilepsy: the GABA-transaminase inhibitor, vigabatrin, induces neuronal plasticity in the mouse retina. Eur J Neurosci 2008;27:2177–2187. [DOI] [PMC free article] [PubMed] [Google Scholar]
- 36.Heim MK, Gidal BE. Vigabatrin-associated retinal damage: potential biochemical mechanisms. Acta Neurol Scand 2012;126:219–228. [DOI] [PubMed] [Google Scholar]
- 37.Froger N, Jammoul F, Gaucher D, et al. Taurine is a crucial factor to preserve retinal ganglion cell survival. Adv Exp Med Biol 2013;775:69–83. [DOI] [PubMed] [Google Scholar]
- 38.Izumi Y, Ishikawa M, Benz AM, Izumi M, Zorumski CF, Thio LL. Acute vigabatrin retinotoxicity in albino rats depends on light but not GABA. Epilepsia 2004;45:1043–1048. [DOI] [PubMed] [Google Scholar]
- 39.Jammoul F, Degardin J, Pain D, et al. Taurine deficiency damages photoreceptors and retinal ganglion cells in vigabatrin-treated neonatal rats. Mol Cell Neurosci 2010;43:414–421. [DOI] [PMC free article] [PubMed] [Google Scholar]
- 40.Jammoul F, Wang Q, Nabbout R, et al. Taurine deficiency is a cause of vigabatrin-induced retinal phototoxicity. Ann Neurol 2009;65:98–107. [DOI] [PMC free article] [PubMed] [Google Scholar]
Associated Data
This section collects any data citations, data availability statements, or supplementary materials included in this article.


