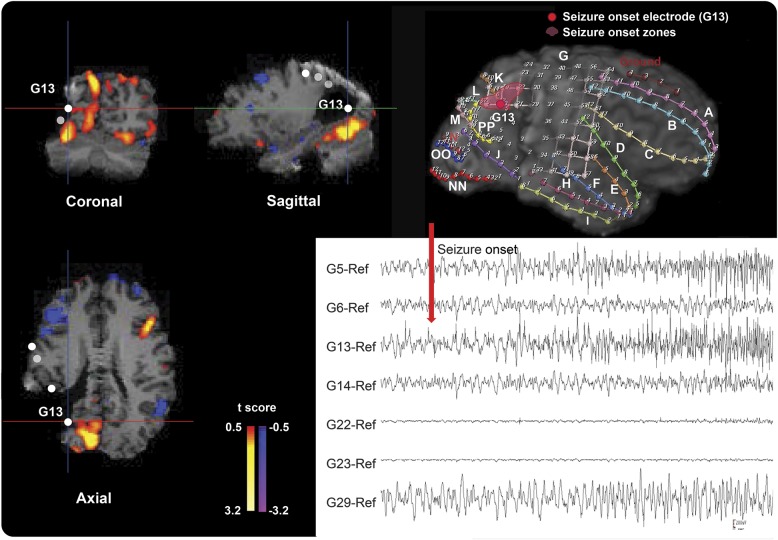
Figure 3. Example of the icEEG SOZ/ICCintra−inter map comparison in a 33-year-old woman with lesional extratemporal lobe epilepsy.
Patient 14 (table 1) with right parietooccipital lobe epilepsy shows positive values on the ICCintra−inter map in the right parietooccipital region in the top and bottom images on the left and the top image in the middle. This matches well with the icEEG SOZ shown in the 3-dimensional MRI surface rendering at the top right (marked as pink) and the bottom right icEEG finding (the red arrow marks a seizure onset). The color bar to the right of the ICC map indicates the t score for difference between intrahemispheric- and interhemispheric-ICC values. Both the results of the ICC map and the icEEG SOZ suggest that the epileptogenic zone is in the right parietooccipital lobe, and this patient has been seizure-free since resection of this region. ICC = intrinsic connectivity contrast; icEEG = intracranial EEG; SOZ = seizure onset zone.

