

Abstract
Diffusion weighted imaging (DWI) has been extensively used to study the microarchitecture of white matter in schizophrenia. However, popular DWI-derived measures such as fractional anisotropy (FA) may be sensitive to many types of pathologies, and thus the interpretation of reported differences in these measures remains difficult. Combining DWI with magnetization transfer ratio (MTR) - a putative measure of white matter myelination - can help us reveal the underlying mechanisms. Previous findings hypothesized that MTR differences in schizophrenia are associated with free water concentrations, which also affect the DWIs. In this study we use a recently proposed DWI-derived method called free-water imaging to assess this hypothesis. We have reanalysed data from a previous study by using a fiber-based analysis of free-water imaging, providing a free-water fraction, as well as mean diffusivity and FA corrected for free-water, in addition to MTR along twelve major white matter fiber bundles in 40 schizophrenia patients and 40 healthy controls. We tested for group differences in each fiber bundle and for each measure separately and computed correlations between the MTR and the DWI-derived measures separately for both groups. Significant higher average MTR values in patients were found for the right uncinate fasciculus, the right arcuate fasciculus and the right inferior-frontal occipital fasciculus. No significant results were found for the other measures. No significant differences in correlations were found between MTR and the DWI-derived measures. The results suggest that MTR and free-water imaging measures can be considered complementary, promoting the acquisition of MTR in addition to DWI to identify group differences, as well as to better understand the underlying mechanisms in schizophrenia.
Keywords: fiber based analysis, MTR, free water imaging, human brain, white matter, schizophrenia
INTRODUCTION
Although the etiology of schizophrenia is still unknown there is compelling evidence that white matter in the brain is implicated (Flynn et al., 2003; Friston and Frith, 1995; Hulshoff Pol et al., 2004; Kubicki et al., 2005a; Shenton et al., 2001; Voineskos et al., 2010). Magnetic resonance imaging (MRI) techniques such as diffusion weighted imaging (DWI) (Le Bihan and Breton, 1985; Stejskal E.O. and J.E., 1965) --- or when a tensor is used to model the diffusion profile of the water molecules, referred to as diffusion tensor imaging (DTI) (Basser, 1995) --- have been extensively used to study schizophrenia, with varying results. These differences in results may be due to differences in patient populations, MRI field strengths, MRI acquisition sequences used, and/or analysis techniques, but most likely are a result of a combination of these factors (Kubicki et al., 2013).
Although differences in the diffusion profile are reported for virtually all brain regions, the overall consensus is that these differences are most prominent in fiber bundles connecting to the fronto-temporal parts of the brain (Shenton et al., 2010). To compare diffusion profiles between subjects, a number of scalar measures have been introduced to describe certain aspects of the diffusion profile. These include fractional anisotropy (FA) (Basser and Pierpaoli, 1996) and mean diffusivity (MD), which represent the two most frequently measures used. Using these methods reductions in FA and increases in MD in patients with schizophrenia have been reported in several studies (Ellison-Wright et al., 2014; Kubicki et al., 2013; Shenton et al., 2010). However, the interpretation of reported differences in FA and MD is complicated because there are a number of possible underlying mechanisms that may be responsible. For instance, differences in fiber directionality, level of myelination and axonal diameter and, importantly, the degree of partial volume between different tissue types, will all result in differences in FA as well as MD (De Santis et al., 2014).
One way to increase the specificity of DWI measures is to compare them with other imaging contrasts (Kubicki et al., 2005c). In previous studies, DWI measurements were combined with magnetization transfer imaging (de Weijer et al., 2011; de Weijer et al., 2013; Kubicki et al., 2005b; Mandl et al., 2013b; Mandl et al., 2010; Palaniyappan et al., 2013; van den Heuvel et al., 2010), which measures the amount of signal that is transferred from macromolecules (including myelin) to the water molecules in the free water pool (Henkelman et al., 2001; Laule et al., 2007; Wolff and Balaban, 1994). Magnetization transfer ratio (MTR), a measure derived from the magnetization transfer images, is a putative measure of myelination because in white matter the myelin molecules form a large fraction of the macromolecules present. Since both FA and MTR are (amongst others) sensitive to myelin content, combining both imaging contrasts can help us to understand better the underlying mechanisms. Many studies used MTR to study white matter in schizophrenia albeit with varying results. Several studies reported on lower MTR values in schizophrenia (Bohner et al., 2012; Du et al., 2013; Foong et al., 2000; Kubicki et al., 2005b; Palaniyappan et al., 2013; Price et al., 2010), one study reported no differences (Antosik-Biernacka et al., 2006) while other studies reported on higher MTR signal in schizophrenia (de Weijer et al., 2011; de Weijer et al., 2013; Mandl et al., 2013b; Mandl et al., 2010). Of particular relevance here, in our previous study (Mandl et al., 2010) we combined MTR and FA with a focus on prefrontal fiber bundles, i.e., left and right uncinate fasciculus and the genu of the corpus callosum. These three fiber bundles were reconstructed using fiber tracking (Jones, 2008; Mori et al., 1999) and FA, MD and MTR values were measured along the reconstructed fiber bundles. The main finding was a statistically significantly higher MTR along the right uncinate fasciculus in schizophrenia patients, which was not accompanied by a higher FA. Since the MTR changes did not overlap with the FA changes, and since MTR is sensitive, but not specific to myelin changes, we speculated that the increased MTR finding is not related to myelin changes. It is also known that MTR is influenced by other mechanisms such as changes in T1 relaxation time, and modulation of neuroinflammation (Laule et al., 2007). Accordingly, we speculated that this higher MTR may reflect differences in the free water pool (e.g., water in the extracellular space) between groups. Our rationale was that an increase in free water in patients with schizophrenia would lead to prolonged T1 relaxation times (Kalus et al., 2005), which could then explain the measured increase in MTR.
Here, our goal was to further test the hypothesis that differences in bulk water contribute to the observed increased MTR by incorporating free-water imaging, which is a recently proposed post processing method that operates on DWI data and can estimate the fractional volume of free water in each voxel (Pasternak et al., 2009). In line with our hypothesis, a previous free-water study in schizophrenia found that there was an increase in the volume of the extracellular space in schizophrenia patients following their first psychotic episode (Pasternak et al., 2012). For this reason we reanalyzed the data from Mandl et al. (Mandl et al., 2010) to obtain free-water measures, and we added nine more major fiber bundles (Boos et al., 2013) (Figure 1A) to the three bundles tested earlier. By combining the measures we tested whether differences in free water concentrations could indeed be an alternative explanation for the higher MTR values measured in patients with schizophrenia.
Figure 1.

Twelve major fiber bundles and corresponding model average fiber bundles.
A) The twelve major fiber bundles reconstructed for one single subject.
B) Average model fiber bundles used to compute the mean FAc, MDc MTR and Free water signal along the fiber bundles for all subjects. The use of these average model fiber bundles allows us to perform a point-by-point comparison between subjects along a fiber bundle. gcc=genu of the corpus callosum, scc=splenium of the corpus callosum, ilf=inferior longitudinal fasciculus, cin=cingulum bundle, af=arcuate fasciculus, unc=uncinate fasciculus, ifo=inferior fronto-occipital fasciculus. The diameter of the model fibers represents the variability of the positions of the individual fiber bundles that were used to construct the model fiber.
MATERIALS AND METHODS
Subjects
Forty patients with schizophrenia and 40 healthy participants, matched for age, gender, handedness and parental education participated in this study. The healthy participants were recruited by means of local newspaper advertisements. The study was approved by the medical ethics committee for research in humans (METC) of the University Medical Center Utrecht, the Netherlands. All subjects participated after written informed consent was obtained. All participants underwent extensive psychiatric assessment procedures using the Comprehensive Assessment of Symptoms and History (CASH) (Andreasen et al., 1992). Patients met the DSM-IV criteria for schizophrenia. “Age of onset of illness” was defined here as the age at which the patients experienced psychotic symptoms for the first time, as obtained from the CASH interview, and Schedule for Affective Disorder and Schizophrenia Lifetime version (SADS-L) assessed by two independent raters. Diagnostic consensus was achieved in the presence of a psychiatrist. “Duration of illness” was defined as time between age of onset of illness and age at the time of the MRI scan. All healthy participants met Research Diagnostic Criteria for “never mentally ill” and had no first-degree family member with a mental illness or second-degree relatives with a psychotic disorder. Drug use was assessed with the Composite International Diagnostic Interview (CIDI). Four patients and one healthy participant met criteria for drug abuse, one patient met criteria for drug dependency. Drugs used included cannabis (in all 6 subjects) and others (3).
All patients were receiving typical, or atypical antipsychotic medication at the time of the scan. A table from the Dutch National Health Service (Commissie Farmaceutische Hulp van het College voor Zorgverzekeringen, 2002) was used to calculate the cumulative dosage of typical antipsychotics during the scan interval and to derive the haloperidol equivalents. For atypical antipsychotics the respective pharmaceutical companies suggested how to convert dosage into haloperidol equivalents (clozapine, 40:1; olanzapine, 2.5:1; risperidone, 1:1, sulpiride, 170:1; quetiapine, 50:1; and sertindole, 2:1). See Table 1 for demographics.
Table 1.
Demographic data
| Patients with schizophrenia (N=40) |
Healthy participants (N=40) |
|
|---|---|---|
| Male/female, no | 3 | 2 7/11 |
| Age, yr † | 26.8 (5.8) | 28.0 (7.7) |
| Age, yr range | 20-41 | 18-45 |
| Height, cm † | 179.3 (9.2) | 182.5 (9.0) |
| Height, yr range | 163-198 | 167-204 |
| Weight (kg) † | 76.3 (13.3) | 74.3 (9.1) |
| Weight, kg range | 55-110 | 57-92 |
| Handedness – right /left /ambidexter, no | 37/3/0 | 35/5/0 |
| Level of education, yr † | 10.4 (2.5)* | 13.8 (2.2) |
| Parental level of education, yr † | 13.6 (2.7) | 13.6 (3.2) |
| Age at first symptoms, yr † | 24.7 (5.6) | |
| Age at first symptoms yr range | 16.9-38.4 | |
| Duration of illness, mean (sd), months | 25.1 (17.4) | |
| Medication at time of the scan ঠ| ||
| Typical antipsychotics, no | 4 | |
| – median (range) Haldol eq. | 3.5 (4.7) | |
| Atypical antipsychotics, no | 29 | |
| – median (range) Haldol eq. | 7.1 (12) | |
| No medication at time of scan, no | 0 | |
| Cumulative medication†§ | ||
| Typical antipsychotics no | 1 | |
| – mean | 106.5 | |
| Atypical antipsychotics no | 22 | |
| – mean | 6208.4 (6830.9) | |
| Typical+Atypical antipsychotics no | 13 | |
| – mean | 10956.2 (9640.3) | |
| PANSS positive symptoms | 15.7 (5.6) | |
| PANSS negative symptoms | 15.6 (5.7) | |
| PANSS general symptoms | 31.0 (7.2) | |
| PANSS total score | 62.3 (15.8) | |
| CAN total score | 14.4 (7.9) |
p<0.01
values are mean ± SD
in 7 patients medication information was unavailable
haloperidol, broomperidol, pipamperon, thioridazine, flufenazine, perfenazine, zuclopentixol, penfluridol, pimozide, fluspirilen, largactil and flufenazine were considered typical antipsychotic drugs; clozapine, risperidone, olanzapine, and sertindole were considered atypical antipsychotic drugs.
in 4 patients cumulative medication use was unavailable.
Image acquisition
Magnetic resonance imaging (MRI) scans were obtained on a 1.5 Tesla Intera Achieva Philips System using a six-element SENSE receiver head-coil at the University Medical Center Utrecht. For each subject a high-resolution T1-weighted scan (for anatomical reference), DWI scans, and an MTR scan were acquired. First, a whole head three-dimensional T1-weighted coronal spoiled-gradient echo scan was acquired (256 × 256 matrix; TE = 4.6 ms; TR = 30 ms; flip angle = 30 degrees; 160-180 contiguous slices; 1 × 1 × 1.2 mm3 voxels; FOV = 256 mm / 70%; parallel imaging applied in both phase-encoding directions with SENSE-factor = 1.5). For computation of FA, white matter fiber tract reconstruction as well as the free-water measures, we acquired two repetitions of a transverse DWI scan (32 diffusion-weighted volumes with different non-collinear diffusion directions with b-factor = 1000 s/mm2 and 8 diffusion-unweighted volumes with b-factor = 0 s/mm2; parallel imaging SENSE factor 2.5; flip angle 90 degrees; 60 slices of 2.5 mm; no slice gap; 96 × 96 acquisition matrix; reconstruction matrix 128 × 128; FOV 240 mm; TE = 88 ms; TR = 9822 ms; no cardiac gating; total scan duration 296 s). The MTR was computed on the basis of a three-dimensional magnetization transfer scan comprised of two volumes (transverse; 60 slices of 2.5 mm; 128 × 128 acquisition matrix; FOV 240 mm; flip angle 8 degrees; TE = 3.7 ms; TR = 37.5 ms SENSE factor 2.5). For the second volume an additional off-resonance prepulse was applied (frequency offset 1100 Hz; 620 degrees; three-lobe sync-shaped; total scan duration 394 s).
Image processing
The two DWI scans were simultaneously realigned and corrected for possible gradient induced distortions (Andersson and Skare, 2002). To compute MTR, the second volume of the magnetization transfer scan was rigidly aligned with the first volume using the ANIMAL software package (Collins et al., 1995). Mutual information was used as a similarity metric. MTR was computed on the image with the magnetization prepulse, Im, and the image without magnetization prepulse, I0, using the equation: MTR = (I0-Im)/I0 ×100. The MTR is expressed as a percentage where 0% represents no signal reduction and 100% represents total signal reduction due to magnetization transfer.
Fiber tracking and fiber bundle selection
In the first step, all possible tracts in each brain were reconstructed individually in native DWI space using the single tensor fiber tracking algorithm implemented in the UKF Tractography library (Malcolm et al., 2010), which is part of the Slicer 3D software package (http://www.slicer.org), with the following parameter settings: 2 seed-points per voxel, minimum FA (corrected for free water volume) = 0.15, step size 1 mm, using the simple tensor model + free water model. The free water fractional volume (FW) was estimated along the reconstructed tracts and used to compute the corresponding FA and MD values corrected for free water (hereafter denoted as FAc and MDc) (Baumgartner et al., 2012). To calculate MTR values along the tracts, the MTR image I0 was rigidly transformed to spatially align with the diffusion unweighted (b = 0 s/mm2) volume of the DWI scan using mutual information as similarity metric.
For each subject a nonlinear transformation was computed using the ANIMAL software package that spatially aligns the subject’s T1-weighted scan with a T1-weighted model brain. This nonlinear transformation was used at a later stage to warp the reconstructed tracts into model space. The selection of the twelve major fiber bundles for each subject was done using a multiple ROI fiber selection procedure as described in detail in (Boos et al., 2013).
A so-called average fiber (Mandl et al., 2010) was then computed for each individual fiber bundle from each subject. Figure 1B shows the 12 model average fibers that were defined previously (Boos et al., 2013), and that we used in the current study to compute the average fiber bundles. Note that the current analysis differs from the original analysis (Mandl et al., 2010) (e.g. different FA threshold, selection ROIs, fiber-tracking algorithm) and therefore the FA, MD and MTR values for the uncinate fasciculi and the genu of the corpus callosum may differ from the originally reported values.
Statistical analysis
To determine group differences (patients with schizophrenia versus healthy controls) we used a general linear model (GLM) with FW, FAc, MDc and MTR as dependent variables and group label, age, gender and handedness as independent variables.
In previous studies higher MTR signals in patients with schizophrenia (de Weijer et al., 2011; de Weijer et al., 2013; Mandl et al., 2013b; Mandl et al., 2010) were reported. If these group differences in MTR signal predominantly reflect differences in free water, as was hypothesized previously (Mandl et al., 2010), then we would expect a higher positive correlation between the MTR signal and the FW signal measured in patients compared with healthy controls. If, on the other hand, the differences in MTR actually reflect a change in myelin content, then a higher positive correlation between FAc and MTR for patients would be expected compared to healthy controls, as well as a higher negative correlation between MDc and MTR. However, we note that a further complicating factor is that other types of macromolecules may influence the MTR signal as well and that it is estimated that the fraction of myelin forms at most 50% of the macromolecules present in white matter (MacKay et al., 2006). If these other types of macromolecules are responsible for the measured increases in MTR in patients, then the relation between these differences and differences in DWI-derived measures is not clear beforehand.
To investigate these three possible explanations for fiber bundles in which a significant group difference was previously found, we first computed the residuals of four GLMs with age, gender and handedness as independent variables and MTR, FW, FAc and MDc as dependent variables.
Next, we computed the (partial) spearman rank correlation between the MTR residuals and the residuals for DWI-derived measures separately for patients with schizophrenia and healthy controls. Finally, the Fisher’s z transformation was used to determine if there was a significant difference in correlation strengths (i.e., correlations between MTR and the separate DWI-derived measures) between the two groups.
RESULTS
Using the fiber-based analysis we found statistically significantly higher MTR values for schizophrenia patients in the right uncinate fasciculus, the right inferior fronto-occipital fasciculus and the right arcuate fasciculus (See Figure 2). The results for all fiber bundles are shown in Table 2. Note that the right uncinate finding is not a new finding but one that was already reported in the previous study.
Figure 2.
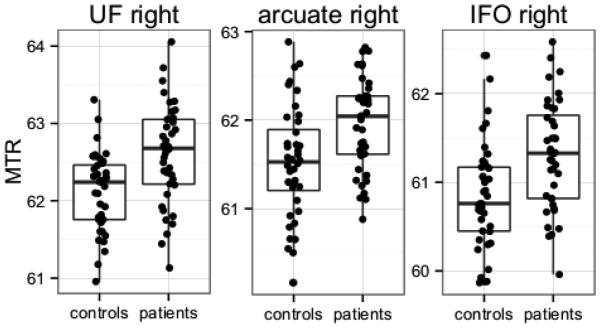
average MTR values for the right uncinate fasciculus, the right arcuate fasciculus and the right inferior fronto-occipital fasciculus. MTR values were higher in schizophrenia patients
Table 2.
average fiber results
| tra ct |
FAc | MDc(×10−4) | MTR | free water (×100) | ||||||||
|---|---|---|---|---|---|---|---|---|---|---|---|---|
|
patien
ts |
control
s |
p |
patient
s |
contr
ols |
p |
patien
ts |
contr
ols |
p |
patien
ts |
contr
ols |
p | |
| unc (l) |
0.26(0. 02) |
0.27(0. 02) |
n.s . |
4.13(0. 09) |
4.15(0. 08) |
n.s. | 62.43(0. 66) |
62.19(0 .65) |
n.s. | 8.64(1. 48) |
7.84(0. 96) |
0.00 47 |
| unc (r) |
0.27(0. 02) |
0.27(0. 02) |
n.s . |
4.15(0. 09) |
4.14(0. 08) |
n.s. | 62.60(0. 65) |
62.12(0 .50) |
0.000 27* |
7.73(1. 03) |
7.56(0. 90) |
n.s. |
| af(l ) |
0.27(0. 02) |
0.28(0. 02) |
n.s . |
4.05(0. 09) |
4.03(0. 08) |
n.s. | 62.31(0. 60) |
62.00(0 .64) |
0.03 | 6.64(0. 97) |
6.83(0. 90) |
n.s. |
| af(r ) |
0.27(0. 02) |
0.27(0. 02) |
n.s . |
4.07(0. 07) |
4.07(0. 08) |
n.s. | 61.96(0. 52) |
61.52(0 .63) |
0.000 74* |
6.39(0. 80) |
6.31(0. 77) |
n.s. |
| ilf(l ) |
0.30(0. 02) |
0.30(0. 02) |
n.s . |
4.19(0. 13) |
4.18(0. 11) |
n.s. | 60.86(0. 99) |
60.84(0 .91) |
n.s. | 11.11(2 .01) |
11.24(1 .56) |
n.s. |
| ilf(r ) |
0.29(0. 02) |
0.29(0. 02) |
n.s . |
4.25(0. 15) |
4.30(0. 13) |
n.s . |
60.68(1. 34) |
60.45(0 .92) |
n.s. | 11.94(3 .03) |
10.58(2 .54) |
0.03 1 |
| ifo( l) |
0.29(0. 02) |
0.30(0. 02) |
n.s . |
4.11(0. 10) |
4.11(0. 10) |
n.s. | 61.42(0. 73) |
61.12(0 .75) |
n.s. | 10.63(1 .25) |
10.58(1 .43) |
n.s. |
| ifo( r) |
0.29(0. 02) |
0.29(0. 02) |
n.s . |
4.11(0. 09) |
4.11(0. 09) |
n.s. | 61.31(0. 61) |
60.84(0 .60) |
0.000 6* |
10.27(1 .10) |
10.54(1 .40) |
n.s. |
| gcc | 0.36(0. 02) |
0.36(0. 02) |
n.s . |
4.09(0. 11) |
4.13(0. 08) |
n.s. | 62.38(0. 78) |
62.03(0 .74) |
0.04 | 9.38(1. 11) |
8.96(1. 18) |
n.s. |
| scc | 0.40(0. 02) |
0.41(0. 02) |
n.s . |
4.30(0. 09) |
4.25(0. 11) |
0.0 3 |
59.90(1. 07) |
59.64(0 .99) |
n.s. | 15.19(1 .84) |
14.72(2 .01) |
n.s. |
| cin( l) |
0.30(0. 03) |
0.30(0. 03) |
n.s . |
4.06(0. 13) |
4.08(0. 08) |
n.s. | 62.62(0. 61) |
62.36(0 .73) |
n.s. | 9.34(2. 13) |
8.93(1. 05) |
n.s. |
| cin( r) |
0.28(0. 03) |
0.28(0. 02) |
n.s . |
4.10(0. 08) |
4.13(0. 08) |
n.s. | 62.71(0. 49) |
62.32(0 .69) |
0.004 7 |
8.09(1. 58) |
7.93(1. 12) |
n.s. |
mean values (standard deviation between parentheses) of FAc, MDc, MTR and free water for patients with schizophrenia versus healthy controls using age, sex, handedness as covariates. p denotes p-value. Degrees of freedom were 1 and 76 for all tests.
denotes significant after Bonferroni correction for multiple testing.
See Figure 1 for explanation of the tract names.
Application of the Fisher’s z transformation revealed no statistically significant group differences for correlations between MTR and the diffusion-derived measures in patients with schizophrenia and healthy controls. Here the maximum z value of 1.1 (two-sided, ρ1 (patients) = −0.47, ρ2 (controls) = −0.25, n1 = n2 = 40, p = 0.27) was found between MTR and MDc in the right uncinate fasciculus.
DISCUSSION
We compared white matter integrity in 12 fibers between schizophrenia and healthy controls using diffusion tensor imaging and magnetic transfer imaging. We find increased MTR values in the uncinate and arcuate fasciculus in patients with schizophrenia. However, we find no statistically significant differences for FAc, MDc or FW. Although in the patients with schizophrenia there were trend level increases in the MDc (splenium of the corpus callosum), decreases in the FAc (genu of the corpus callosum and the right cingulum) and increases in FW (the left uncinate fasciculus and the right inferior longitudinal fasciculus), these results did not survive conservative Bonferroni correction for multiple testing.
The increase in MTR in schizophrenia is compatible with findings reported previously in studies that were conducted by our group in different schizophrenia cohorts and with different scanner strengths (1.5 and 3 tesla) (de Weijer et al., 2011; de Weijer et al., 2013; Mandl et al., 2013b). The fact that significant group differences were found in MTR but not in the diffusion derived measures suggests that MTR is a more sensitive measure for distinguishing between the groups. Moreover, the consistency of these findings across studies from our group suggests that these MTR increases are robust and, for example, may be useful in automatic classification methods for the early detection of disease (Mandl et al., 2013a).
We did not find significant changes in FA values in the patients. Regarding FA values, the results from previous studies from our group were not equivocal. In a study by De Weijer et al. (de Weijer et al., 2011), significantly lower FA values were reported in patients for the arcuate fasciculi. In contrast, in a study conducted by Boos et al. (Boos et al., 2013), similar analysis methods were used, but no statistically significantly lower FA values were reported for patients, and only a statistically significant negative correlation was reported between FA and the PANSS score on negative symptoms for the uncinate fasciculi. It could be argued that effects of cumulative medication, duration of illness or educational level obscure possible group differences in FA, MD or Free Water content. Therefore we added these three factors as covariates in a post hoc analysis but the addition of these covariates did not change the nature of our findings.
There are a number of possible explanations for the differences in FA findings between studies. One possible explanation may lie in differences in the populations studied. For instance the mean duration of illness for the population studied by de Weijer et al. was 13.6 years, while the mean duration of illness for the population studied by Boos et al was 4.1 years, and it was 2.1 years for the population in the current study. Results from other studies utilizing fiber based analysis also indicate that FA reductions are progressive and that they are not always detectable in the early (or even prodromal) stage of the disease (Peters et al., 2010).
However, results from schizophrenia studies that utilized voxel based analysis frequently report significantly lower FA values in schizophrenia patients with a short illness duration (Peters et al., 2010). More recent studies that use tract-based spatial statistics (Smith et al., 2006) reveal a similar pattern (Clemm von Hohenberg et al., 2013; Douaud et al., 2007; Freitag et al., 2013; Fujino et al., 2014; Guo et al., 2012; Holleran et al., 2013; Jeong et al., 2009; Karlsgodt et al., 2009; Karlsgodt et al., 2008; Lee et al., 2013; Liu et al., 2013). Of note, none of the aforementioned studies corrected the FA measure for free-water contamination, and it is likely that such correction would decrease the extent of lower FA values, as demonstrated by Pasternak et al. (Pasternak et al., 2012). In our study the patients were scanned on a 1.5T magnet, which has lower SNR than 3T or higher magnetic fields. This may be another reason for the lack of diffusion MRI findings, as reviews suggest that there are more findings in 3T studies than in 1.5T (Fitzsimmons et al., 2013).
Another possible explanation for the lack of FA findings in our study may be found in the relatively mild negative symptoms reported for the current patient population. In a recent study Voineskos and colleagues showed that schizophrenia patients with more severe negative symptoms (with a mean negative PANSS score of 20) showed significantly lower FA and higher MD values than healthy controls for the left inferior longitudinal fasciculus, the left uncinate fasciculus and the right arcuate fasciculus (Voineskos et al., 2013). In contrast, schizophrenia patients with lower negative symptoms (mean negative PANSS score 14) showed no FA or MD differences compared to healthy controls. The mean negative PANSS score of the patient population in the current study is 15.6, which could explain the absence of any significant results for the diffusion-derived measures.
Maximal differences in FW between patients with schizophrenia and healthy controls are expected near the psychotic episode and close to the onset of the disease, and are then expected to decrease due to the use of antipsychotic medication (Pasternak et al., 2012). This could explain why no significantly higher FW values were found in patients with schizophrenia compared to healthy controls in the current study. All 40 patients have been using antipsychotic medication and the mean duration of illness was 25 months.
We hypothesized that if significantly higher MTR values found in patients were directly related to higher amounts of free water or to higher levels of myelination, then stronger correlations (as compared to healthy controls) should be measured in patients between MTR and FW, and MTR and FA (and MD), respectively. However, no significant group differences in correlation strength between MTR and the three diffusion-derived measures were found for the fiber bundles that showed a significantly higher MTR for patients. Moreover, the fact that the non-significant higher levels of FW in patients in the left uncinate fasciculus and (to a lesser extent) in the right inferior longitudinal fasciculus were not accompanied by similar differences in MTR values further complicates the interpretation of the results. These results therefore provide no further support for either of the two proposed interpretations (i.e., increased MTR reflecting more free water or more myelin).
This absence of support may of course be due to a lack of statistical power. Post hoc power calculation (Hoenig and Heisey, 2001) suggests that at least equally sized groups of 122 subjects are needed to reach a (two-sided) significantly different correlation between MTR and MDc for schizophrenia patients compared to healthy controls in the right uncinate fasciculus (the tract for which we found the largest non-significant effect). Alternatively this absence of support suggests that MTR might be a complimentary measure to diffusion MRI, since it is sensitive to changes that do not significantly affect the diffusion MRI signal. Indeed, studies that compared MTR with the myelin water fraction (the fraction of water molecules between the myelin bilayer) show that in healthy tissue, MTR and myelin water fraction are not correlated and in fact provide complementary information (MacKay et al., 2006). Myelin water fraction measurements are considered to be a more direct measure of myelination, and the lack of association with MTR is a further indication that the measured higher MTR values in patients are not an indication of higher myelin concentrations.
Including myelin water fraction measurements in future studies could help to understand better mechanism(s) underlying the higher MTR values found in patients. Another interesting option is to include diffusion weighted MR spectroscopy (DW-MRS) (Du et al., 2013; Du and Ongur, 2013). This type of MR acquisition does not only provide information on metabolite concentrations but also on the diffusion profiles of these metabolites. DW-MRS can give us more detailed information on the microstructure because, in contrast to water, various different metabolites reside in different tissue compartments (e.g., intracellular versus extracellular). Especially of interest is the combination of ultra-high field (7 tesla) DW-MRS (Ronen et al., 2013) and tract-based MRS (Mandl et al., 2011) because this combination allows for a detailed study of various metabolite diffusion profiles in a particular fiber bundle (e.g., the arcuate fasciculus).
We note that the inclusion of additional measurements to obtain more information is not limited to MRI per se. Given the fact that MTR is also sensitive to inflammation (Laule et al., 2007), it would be very interesting to combine MTR and DWI with PET (for instance using tracer (R)-11C-(R)-PK11195) to study possible correlations between MTR and microglial activation in white matter (Doorduin et al., 2009; Kannan et al., 2007; Monji et al., 2013; van Berckel et al., 2008).
In this study we compared FW, FAc, MDc, and MTR measurements in schizophrenia using fiber-based analysis. The results show that MTR and free-water imaging derived measures are for a large part complementary measures and that MTR is a more sensitive imaging contrast than the DWI-derived imaging contrasts in identifying group differences in our data. Thus including MTR scans in future studies can provide valuable information despite the fact that the relation between MTR and the underlying biological mechanisms are still not fully understood.
Acknowledgments
Financial disclosure
This work was partially funded by grants from the NIH (nos. P41RR013218, P41EB015902, and R01MH074794). OP was partially supported by a NARSAD (National Alliance for Research on Schizophrenia and Depression) Young Investigator grant from the Brain & Behavior Research Foundation.
Footnotes
Publisher's Disclaimer: This is a PDF file of an unedited manuscript that has been accepted for publication. As a service to our customers we are providing this early version of the manuscript. The manuscript will undergo copyediting, typesetting, and review of the resulting proof before it is published in its final citable form. Please note that during the production process errors may be discovered which could affect the content, and all legal disclaimers that apply to the journal pertain.
Conflicts of Interest
All authors declare no conflicts of interest.
References
- Andersson JL, Skare S. A model-based method for retrospective correction of geometric distortions in diffusion-weighted EPI. Neuroimage. 2002;16(1):177–199. doi: 10.1006/nimg.2001.1039. [DOI] [PubMed] [Google Scholar]
- Andreasen NC, Flaum M, Arndt S. The Comprehensive Assessment of Symptoms and History (CASH). An instrument for assessing diagnosis and psychopathology. Arch Gen Psychiatry. 1992;49(8):615–623. doi: 10.1001/archpsyc.1992.01820080023004. [DOI] [PubMed] [Google Scholar]
- Antosik-Biernacka A, Peuskens H, De Hert M, Peuskens J, Sunaert S, Van Hecke P, Goraj B. Magnetization transfer imaging in chronic schizophrenia. Medical science monitor : international medical journal of experimental and clinical research. 2006;12(4):MT17–21. [PubMed] [Google Scholar]
- Basser PJ. Inferring microstructural features and the physiological state of tissues from diffusion-weighted images. NMR Biomed. 1995;8(7-8):333–344. doi: 10.1002/nbm.1940080707. [DOI] [PubMed] [Google Scholar]
- Basser PJ, Pierpaoli C. Microstructural and physiological features of tissues elucidated by quantitative-diffusion-tensor MRI. J Magn Reson B. 1996;111(3):209–219. doi: 10.1006/jmrb.1996.0086. [DOI] [PubMed] [Google Scholar]
- Baumgartner C, Pasternak O, Bouix S, Westin CF, Rathi Y. Filtered multi-tensor tractography using free water estimation; International Society for Magnetic Resonance in Medicine; Melbourne, Australia. 2012. [Google Scholar]
- Bohner G, Milakara D, Witthaus H, Gallinat J, Scheel M, Juckel G, Klingebiel R. MTR abnormalities in subjects at ultra-high risk for schizophrenia and first-episode schizophrenic patients compared to healthy controls. Schizophrenia research. 2012;137(1-3):85–90. doi: 10.1016/j.schres.2012.01.020. [DOI] [PubMed] [Google Scholar]
- Boos HB, Mandl RC, van Haren NE, Cahn W, van Baal GC, Kahn RS, Hulshoff Pol HE. Tract-based diffusion tensor imaging in patients with schizophrenia and their non-psychotic siblings. Eur Neuropsychopharmacol. 2013;23(4):295–304. doi: 10.1016/j.euroneuro.2012.05.015. [DOI] [PubMed] [Google Scholar]
- Clemm von Hohenberg C, Pasternak O, Kubicki M, Ballinger T, Vu MA, Swisher T, Green K, Giwerc M, Dahlben B, Goldstein JM, Woo TU, Petryshen TL, Mesholam-Gately RI, Woodberry KA, Thermenos HW, Mulert C, McCarley RW, Seidman LJ, Shenton ME. White Matter Microstructure in Individuals at Clinical High Risk of Psychosis: A Whole-Brain Diffusion Tensor Imaging Study. Schizophrenia bulletin. 2013 doi: 10.1093/schbul/sbt079. [DOI] [PMC free article] [PubMed] [Google Scholar]
- Collins DL, Holmes CJ, Peters TM, Evans AC. Automatic 3-D model-based neuroanatomical segmentation. Human Brain Mapping. 1995;3(3):190–208. [Google Scholar]
- De Santis S, Drakesmith M, Bells S, Assaf Y, Jones DK. Why diffusion tensor MRI does well only some of the time: Variance and covariance of white matter tissue microstructure attributes in the living human brain. NeuroImage. 2014;89:35–44. doi: 10.1016/j.neuroimage.2013.12.003. [DOI] [PMC free article] [PubMed] [Google Scholar]
- de Weijer AD, Mandl RC, Diederen KM, Neggers SF, Kahn RS, Hulshoff Pol HE, Sommer IE. Microstructural alterations of the arcuate fasciculus in schizophrenia patients with frequent auditory verbal hallucinations. Schizophrenia research. 2011;130(1-3):68–77. doi: 10.1016/j.schres.2011.05.010. [DOI] [PubMed] [Google Scholar]
- de Weijer AD, Neggers SF, Diederen KM, Mandl RC, Kahn RS, Hulshoff Pol HE, Sommer IE. Aberrations in the arcuate fasciculus are associated with auditory verbal hallucinations in psychotic and in non-psychotic individuals. Human brain mapping. 2013;34(3):626–634. doi: 10.1002/hbm.21463. [DOI] [PMC free article] [PubMed] [Google Scholar]
- Doorduin J, de Vries EF, Willemsen AT, de Groot JC, Dierckx RA, Klein HC. Neuroinflammation in schizophrenia-related psychosis: a PET study. J Nucl Med. 2009;50(11):1801–1807. doi: 10.2967/jnumed.109.066647. [DOI] [PubMed] [Google Scholar]
- Douaud G, Smith S, Jenkinson M, Behrens T, Johansen-Berg H, Vickers J, James S, Voets N, Watkins K, Matthews PM, James A. Anatomically related grey and white matter abnormalities in adolescent-onset schizophrenia. Brain : a journal of neurology. 2007;130:2375–2386. doi: 10.1093/brain/awm184. Pt 9. [DOI] [PubMed] [Google Scholar]
- Du F, Cooper AJ, Thida T, Shinn AK, Cohen BM, Ongur D. Myelin and axon abnormalities in schizophrenia measured with magnetic resonance imaging techniques. Biological psychiatry. 2013;74(6):451–457. doi: 10.1016/j.biopsych.2013.03.003. [DOI] [PMC free article] [PubMed] [Google Scholar]
- Du F, Ongur D. Probing myelin and axon abnormalities separately in psychiatric disorders using MRI techniques. Front Integr Neurosci. 2013;7:24. doi: 10.3389/fnint.2013.00024. [DOI] [PMC free article] [PubMed] [Google Scholar]
- Ellison-Wright I, Nathan PJ, Bullmore ET, Zaman R, Dudas RB, Agius M, Fernandez-Egea E, Muller U, Dodds CM, Forde NJ, Scanlon C, Leemans A, McDonald C, Cannon DM. Distribution of tract deficits in schizophrenia. BMC Psychiatry. 2014;14(1):99. doi: 10.1186/1471-244X-14-99. [DOI] [PMC free article] [PubMed] [Google Scholar]
- Fitzsimmons J, Kubicki M, Shenton ME. Review of functional and anatomical brain connectivity findings in schizophrenia. Current opinion in psychiatry. 2013;26(2):172–187. doi: 10.1097/YCO.0b013e32835d9e6a. [DOI] [PubMed] [Google Scholar]
- Flynn SW, Lang DJ, Mackay AL, Goghari V, Vavasour IM, Whittall KP, Smith GN, Arango V, Mann JJ, Dwork AJ, Falkai P, Honer WG. Abnormalities of myelination in schizophrenia detected in vivo with MRI, and post-mortem with analysis of oligodendrocyte proteins. Mol Psychiatry. 2003;8(9):811–820. doi: 10.1038/sj.mp.4001337. [DOI] [PubMed] [Google Scholar]
- Foong J, Maier M, Barker GJ, Brocklehurst S, Miller DH, Ron MA. In vivo investigation of white matter pathology in schizophrenia with magnetisation transfer imaging. J Neurol Neurosurg Psychiatry. 2000;68(1):70–74. doi: 10.1136/jnnp.68.1.70. [DOI] [PMC free article] [PubMed] [Google Scholar]
- Freitag MT, van Bruggen T, Fritzsche KH, Henze R, Brunner R, Parzer P, Resch F, Stieltjes B. Reduced lateralization in early onset schizophrenia. Neuroscience letters. 2013;537:23–28. doi: 10.1016/j.neulet.2013.01.024. [DOI] [PubMed] [Google Scholar]
- Friston KJ, Frith CD. Schizophrenia: a disconnection syndrome? Clin Neurosci. 1995;3(2):89–97. [PubMed] [Google Scholar]
- Fujino J, Takahashi H, Miyata J, Sugihara G, Kubota M, Sasamoto A, Fujiwara H, Aso T, Fukuyama H, Murai T. Impairedempathic abilities and reduced white matter integrity in schizophrenia. Prog Neuropsychopharmacol Biol Psychiatry. 2014;48:117–123. doi: 10.1016/j.pnpbp.2013.09.018. [DOI] [PubMed] [Google Scholar]
- Guo W, Liu F, Liu Z, Gao K, Xiao C, Chen H, Zhao J. Right lateralized white matter abnormalities in first-episode, drug-naive paranoid schizophrenia. Neuroscience letters. 2012;531(1):5–9. doi: 10.1016/j.neulet.2012.09.033. [DOI] [PubMed] [Google Scholar]
- Henkelman RM, Stanisz GJ, Graham SJ. Magnetization transfer in MRI: a review. NMR Biomed. 2001;14(2):57–64. doi: 10.1002/nbm.683. [DOI] [PubMed] [Google Scholar]
- Hoenig JM, Heisey DM. The Abuse of Power. the american statistician. 2001;55(1):19–15. [Google Scholar]
- Holleran L, Ahmed M, Anderson-Schmidt H, McFarland J, Emsell L, Leemans A, Scanlon C, Dockery P, McCarthy P, Barker GJ, McDonald C, Cannon DM. Altered Interhemispheric and Temporal Lobe White Matter Microstructural Organization in Severe Chronic Schizophrenia. Neuropsychopharmacology : official publication of the American College of Neuropsychopharmacology. 2013 doi: 10.1038/npp.2013.294. [DOI] [PMC free article] [PubMed] [Google Scholar]
- Hulshoff Pol HE, Schnack HG, Mandl RC, Cahn W, Collins DL, Evans AC, Kahn RS. Focal white matter density changes in schizophrenia: reduced inter-hemispheric connectivity. Neuroimage. 2004;21(1):27–35. doi: 10.1016/j.neuroimage.2003.09.026. [DOI] [PubMed] [Google Scholar]
- Jeong B, Wible CG, Hashimoto R, Kubicki M. Functional and anatomical connectivity abnormalities in left inferior frontal gyrus in schizophrenia. Human brain mapping. 2009;30(12):4138–4151. doi: 10.1002/hbm.20835. [DOI] [PMC free article] [PubMed] [Google Scholar]
- Jones DK. Studying connections in the living human brain with diffusion MRI. Cortex. 2008;44(8):936–952. doi: 10.1016/j.cortex.2008.05.002. [DOI] [PubMed] [Google Scholar]
- Kalus P, Slotboom J, Gallinat J, Wiest R, Ozdoba C, Federspiel A, Strik WK, Buri C, Schroth G, Kiefer C. The amygdala in schizophrenia: a trimodal magnetic resonance imaging study. Neuroscience letters. 2005;375(3):151–156. doi: 10.1016/j.neulet.2004.11.004. [DOI] [PubMed] [Google Scholar]
- Kannan S, Saadani-Makki F, Muzik O, Chakraborty P, Mangner TJ, Janisse J, Romero R, Chugani DC. Microglial activation in perinatal rabbit brain induced by intrauterine inflammation: detection with 11C-(R)-PK11195 and small-animal PET. J Nucl Med. 2007;48(6):946–954. doi: 10.2967/jnumed.106.038539. [DOI] [PubMed] [Google Scholar]
- Karlsgodt KH, Niendam TA, Bearden CE, Cannon TD. White matter integrity and prediction of social and role functioning in subjects at ultra-high risk for psychosis. Biological psychiatry. 2009;66(6):562–569. doi: 10.1016/j.biopsych.2009.03.013. [DOI] [PMC free article] [PubMed] [Google Scholar]
- Karlsgodt KH, van Erp TG, Poldrack RA, Bearden CE, Nuechterlein KH, Cannon TD. Diffusion tensor imaging of the superior longitudinal fasciculus and working memory in recent-onset schizophrenia. Biological psychiatry. 2008;63(5):512–518. doi: 10.1016/j.biopsych.2007.06.017. [DOI] [PubMed] [Google Scholar]
- Kubicki M, McCarley R, Westin CF, Park HJ, Maier S, Kikinis R, Jolesz FA, Shenton ME. A review of diffusion tensor imaging studies in schizophrenia. J Psychiatr Res. 2005a doi: 10.1016/j.jpsychires.2005.05.005. [DOI] [PMC free article] [PubMed] [Google Scholar]
- Kubicki M, Park H, Westin CF, Nestor PG, Mulkern RV, Maier SE, Niznikiewicz M, Connor EE, Levitt JJ, Frumin M, Kikinis R, Jolesz FA, McCarley RW, Shenton ME. DTI and MTR abnormalities in schizophrenia: analysis of white matter integrity. Neuroimage. 2005b;26(4):1109–1118. doi: 10.1016/j.neuroimage.2005.03.026. [DOI] [PMC free article] [PubMed] [Google Scholar]
- Kubicki M, Westin CF, McCarley RW, Shenton ME. The application of DTI to investigate white matter abnormalities in schizophrenia. Ann N Y Acad Sci. 2005c;1064:134–148. doi: 10.1196/annals.1340.024. [DOI] [PMC free article] [PubMed] [Google Scholar]
- Kubicki M, Westin CF, Pasternak O, Shenton M. Diffusion Tensor Imaging and Its Applications to Schizophrenia and Related Disorders. In: Johansen-Berg H, Behrens TEJ, editors. Diffusion MRI: From Quantitative Measurement to In vivo Neuroanatomy. 2 Academic Press; London: 2013. pp. 251–270. [Google Scholar]
- Laule C, Vavasour IM, Kolind SH, Li DK, Traboulsee TL, Moore GR, MacKay AL. Magnetic resonance imaging of myelin. Neurotherapeutics. 2007;4(3):460–484. doi: 10.1016/j.nurt.2007.05.004. [DOI] [PMC free article] [PubMed] [Google Scholar]
- Le Bihan D, Breton E. Imagerie de diffusion in vivo par résonance magnétique nucléaire. Compte Rendus de l`Académie de Sciences Paris. 1985;301:1109–1112. [Google Scholar]
- Lee SH, Kubicki M, Asami T, Seidman LJ, Goldstein JM, Mesholam-Gately RI, McCarley RW, Shenton ME. Extensive white matter abnormalities in patients with first-episode schizophrenia: a Diffusion Tensor Iimaging (DTI) study. Schizophrenia research. 2013;143(2-3):231–238. doi: 10.1016/j.schres.2012.11.029. [DOI] [PMC free article] [PubMed] [Google Scholar]
- Liu X, Lai Y, Wang X, Hao C, Chen L, Zhou Z, Yu X, Hong N. Reduced white matter integrity and cognitive deficit in never-medicated chronic schizophrenia: a diffusion tensor study using TBSS. Behav Brain Res. 2013;252:157–163. doi: 10.1016/j.bbr.2013.05.061. [DOI] [PubMed] [Google Scholar]
- MacKay A, Laule C, Vavasour I, Bjarnason T, Kolind S, Madler B. Insights into brain microstructure from the T2 distribution. Magn Reson Imaging. 2006;24(4):515–525. doi: 10.1016/j.mri.2005.12.037. [DOI] [PubMed] [Google Scholar]
- Malcolm JG, Shenton ME, Rathi Y. Filtered multitensor tractography. IEEE Trans Med Imaging. 2010;29(9):1664–1675. doi: 10.1109/TMI.2010.2048121. [DOI] [PMC free article] [PubMed] [Google Scholar]
- Mandl RC, Brouwer RM, Cahn W, Kahn RS, Hulshoff Pol HE. Family-wise automatic classification in schizophrenia. Schizophrenia research. 2013a;149(1-3):108–111. doi: 10.1016/j.schres.2013.07.002. [DOI] [PubMed] [Google Scholar]
- Mandl RC, Rais M, van Baal GC, van Haren NE, Cahn W, Kahn RS, Hulshoff Pol HE. Altered white matter connectivity in never-medicated patients with schizophrenia. Human brain mapping. 2013b;34(9):2353–2365. doi: 10.1002/hbm.22075. [DOI] [PMC free article] [PubMed] [Google Scholar]
- Mandl RC, Schnack HG, Luigjes J, van den Heuvel MP, Cahn W, Kahn RS, Hulshoff Pol HE. Tract-based analysis of magnetization transfer ratio and diffusion tensor imaging of the frontal and frontotemporal connections in schizophrenia. Schizophr Bull. 2010;36(4):778–787. doi: 10.1093/schbul/sbn161. [DOI] [PMC free article] [PubMed] [Google Scholar]
- Mandl RC, van den Heuvel MP, Klomp DW, Boer VO, Siero JC, Luijten PR, Hulshoff Pol HE. Tract-based magnetic resonance spectroscopy of the cingulum bundles at 7 T. Hum Brain Mapp. 2011 doi: 10.1002/hbm.21302. [DOI] [PMC free article] [PubMed] [Google Scholar]
- Monji A, Kato TA, Mizoguchi Y, Horikawa H, Seki Y, Kasai M, Yamauchi Y, Yamada S, Kanba S. Neuroinflammation in schizophrenia especially focused on the role of microglia. Prog Neuropsychopharmacol Biol Psychiatry. 2013;42:115–121. doi: 10.1016/j.pnpbp.2011.12.002. [DOI] [PubMed] [Google Scholar]
- Mori S, Crain BJ, Chacko VP, van Zijl PC. Three-dimensional tracking of axonal projections in the brain by magnetic resonance imaging. Ann Neurol. 1999;45(2):265–269. doi: 10.1002/1531-8249(199902)45:2<265::aid-ana21>3.0.co;2-3. [DOI] [PubMed] [Google Scholar]
- Palaniyappan L, Al-Radaideh A, Mougin O, Gowland P, Liddle PF. Combined white matter imaging suggests myelination defects in visual processing regions in schizophrenia. Neuropsychopharmacology : official publication of the American College of Neuropsychopharmacology. 2013;38(9):1808–1815. doi: 10.1038/npp.2013.80. [DOI] [PMC free article] [PubMed] [Google Scholar]
- Pasternak O, Sochen N, Gur Y, Intrator N, Assaf Y. Free water elimination and mapping from diffusion MRI. Magnetic resonance in medicine : official journal of the Society of Magnetic Resonance in Medicine / Society of Magnetic Resonance in Medicine. 2009;62(3):717–730. doi: 10.1002/mrm.22055. [DOI] [PubMed] [Google Scholar]
- Pasternak O, Westin CF, Bouix S, Seidman LJ, Goldstein JM, Woo TU, Petryshen TL, Mesholam-Gately RI, McCarley RW, Kikinis R, Shenton ME, Kubicki M. Excessive extracellular volume reveals a neurodegenerative pattern in schizophrenia onset. The Journal of neuroscience : the official journal of the Society for Neuroscience. 2012;32(48):17365–17372. doi: 10.1523/JNEUROSCI.2904-12.2012. [DOI] [PMC free article] [PubMed] [Google Scholar]
- Peters BD, Blaas J, de Haan L. Diffusion tensor imaging in the early phase of schizophrenia: what have we learned? J Psychiatr Res. 2010;44(15):993–1004. doi: 10.1016/j.jpsychires.2010.05.003. [DOI] [PubMed] [Google Scholar]
- Price G, Cercignani M, Chu EM, Barnes TR, Barker GJ, Joyce EM, Ron MA. Brain pathology in first-episode psychosis: magnetization transfer imaging provides additional information to MRI measurements of volume loss. NeuroImage. 2010;49(1):185–192. doi: 10.1016/j.neuroimage.2009.07.037. [DOI] [PMC free article] [PubMed] [Google Scholar]
- Ronen I, Ercan E, Webb A. Axonal and glial microstructural information obtained with diffusion-weighted magnetic resonance spectroscopy at 7T. Front Integr Neurosci. 2013;7:13. doi: 10.3389/fnint.2013.00013. [DOI] [PMC free article] [PubMed] [Google Scholar]
- Shenton ME, Dickey CC, Frumin M, McCarley RW. A review of MRI findings in schizophrenia. Schizophrenia research. 2001;49(1-2):1–52. doi: 10.1016/s0920-9964(01)00163-3. [DOI] [PMC free article] [PubMed] [Google Scholar]
- Shenton ME, Whitford TJ, Kubicki M. Structural neuroimaging in schizophrenia: from methods to insights to treatments. Dialogues in clinical neuroscience. 2010;12(3):317–332. doi: 10.31887/DCNS.2010.12.3/mshenton. [DOI] [PMC free article] [PubMed] [Google Scholar]
- Smith SM, Jenkinson M, Johansen-Berg H, Rueckert D, Nichols TE, Mackay CE, Watkins KE, Ciccarelli O, Cader MZ, Matthews PM, Behrens TE. Tract-based spatial statistics: voxelwise analysis of multi-subject diffusion data. NeuroImage. 2006;31(4):1487–1505. doi: 10.1016/j.neuroimage.2006.02.024. [DOI] [PubMed] [Google Scholar]
- Stejskal EO. Spin diffusion measurementsL spin echoes in the presence of a time-dependent field gradient. Journal of Chemical Physics. 1965;42:5. J.E., T. [Google Scholar]
- van Berckel BN, Bossong MG, Boellaard R, Kloet R, Schuitemaker A, Caspers E, Luurtsema G, Windhorst AD, Cahn W, Lammertsma AA, Kahn RS. Microglia activation in recent-onset schizophrenia: a quantitative (R)-[11C]PK11195 positron emission tomography study. Biological psychiatry. 2008;64(9):820–822. doi: 10.1016/j.biopsych.2008.04.025. [DOI] [PubMed] [Google Scholar]
- van den Heuvel MP, Mandl RC, Stam CJ, Kahn RS, Hulshoff Pol HE. Aberrant frontal and temporal complex network structure in schizophrenia: a graph theoretical analysis. The Journal of neuroscience : the official journal of the Society for Neuroscience. 2010;30(47):15915–15926. doi: 10.1523/JNEUROSCI.2874-10.2010. [DOI] [PMC free article] [PubMed] [Google Scholar]
- Voineskos AN, Foussias G, Lerch J, Felsky D, Remington G, Rajji TK, Lobaugh N, Pollock BG, Mulsant BH. Neuroimaging evidence for the deficit subtype of schizophrenia. JAMA Psychiatry. 2013;70(5):472–480. doi: 10.1001/jamapsychiatry.2013.786. [DOI] [PubMed] [Google Scholar]
- Voineskos AN, Lobaugh NJ, Bouix S, Rajji TK, Miranda D, Kennedy JL, Mulsant BH, Pollock BG, Shenton ME. Diffusion tensor tractography findings in schizophrenia across the adult lifespan. Brain : a journal of neurology. 2010;133:1494–1504. doi: 10.1093/brain/awq040. Pt 5. [DOI] [PMC free article] [PubMed] [Google Scholar]
- Wolff SD, Balaban RS. Magnetization transfer imaging: practical aspects and clinical applications. Radiology. 1994;192(3):593–599. doi: 10.1148/radiology.192.3.8058919. [DOI] [PubMed] [Google Scholar]