

Abstract
We describe our efforts to understand the key mechanistic aspects of the previously reported alkene hydrofunctionalization reactions using 9-mesityl-10-methylacridinium (Mes-Acr+) as a photoredox catalyst. Importantly, we are able to detect alkene cation radical intermediates, and confirm that phenylthiyl radical is capable of oxidizing the persistent acridinyl radical in a fast process that unites the catalytic activity of the photoredox and hydrogen atom transfer (HAT) manifolds. Additionally, we present evidence that diphenyl disulfide ((PhS)2) operates on a common catalytic cycle with thiophenol (PhSH) by way of photolytic cleaveage of the disulfide bond. Transition structure analysis of the HAT step using DFT reveals that the activation barrier for H atom donation from PhSH is significantly lower than 2-phenylmalononitrile (PMN) due to structural reorganization. In the early stages of the reaction, Mes-Acr+ is observed to engage in off-cycle adduct formation, presumably as buildup of PhS− becomes significant. The kinetic differences between PhSH and (PhS)2 as HAT catalysts indicate that the proton transfer step may have significant rate limiting influence.
Introduction
Alkenes are one of the most versatile chemical feedstocks and are key components of innumerable synthetic transformations. A particularly active field of catalysis utilizes alkene reactants in hydrofunctionalization reactions such as olefin hydroalkoxylation and hydroamination reactions.1−3 A vast majority of these alkene hydrofunctionalization reactions proceed with Markovnikov selectivity. In the past decade and a half, there have been significant efforts by a number of research laboratories to develop catalytic protocols to access the opposite regioisomeric hydrofunctionalization adducts;4−6 however, a more general catalytic platform has yet to be identified.
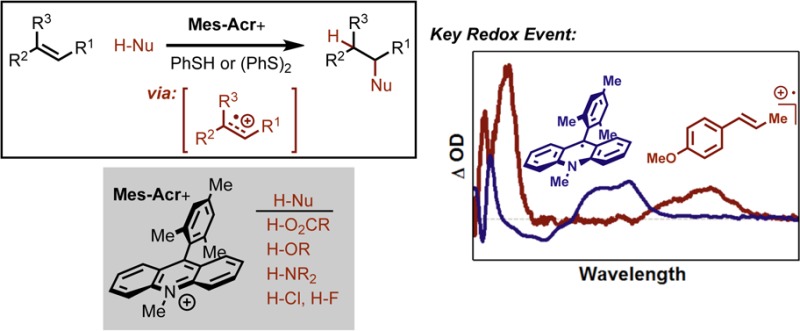
To address this, our laboratory has recently developed a number of methods for alkene hydrofunctionalization7−12 that have demonstrated the unique synthetic control accessible through systems which rely upon the well-defined redox cycles of a photoredox catalyst.13 These methods display complete anti-Markovnikov selectivity, employing a catalytic quantity of the organic dye 9-mesityl-10-methyl acridinium14−29 (Mes-Acr+)30 as a photooxidant along with a cocatalyst proposed to be a redox-active hydrogen atom donor (Figure 1).
Figure 1.
Anti-Markovnikov hydrofunctionalization using Mes-Acr+ as a photoredox catalyst and PMN, PhSH, or (PhS)2 as viable HAT catalysts.
One initial report from our group featured the use of Mes-AcrClO4 as a catalytic photooxidant along with 50–200 mol % 2-phenylmalononitrile (PMN) as an H atom transfer (HAT) reagent in a hydroetherification reaction that proceeds with complete regioselectivity.7 This is particularly noteworthy in the context of oxidative alkene functionalizations, which often result in overoxidation and subsequent difunctionalization.31−34 Further optimization of this and related transformations identified thiophenol (PhSH) and, intriguingly, diphenyl disulfide ((PhS)2) as competent HAT catalysts, and these second-generation conditions have allowed for improved yields and drastically shortened reaction times. The increased efficiency rendered by arenethiol-based cocatalysts has enabled extension of this anti-Markovnikov methodology to include a diverse array of nucleophiles, including carboxylic acids,8 amines,9,10 mineral acids such as HF, HCl, and MsOH,11 as well as propargylic and allylic alcohols and acids in a tandem addition-cyclization sequence.35,36 This demonstration of an efficient and broadly applicable complement to Markovnikov-selective protocols is a testament to the value of the alkene cation radical as an intermediate accessible via single electron transfer (SET).
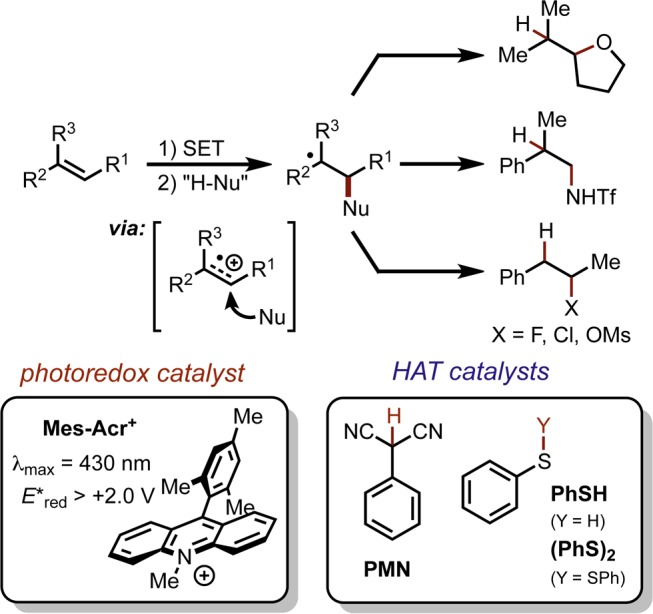
As these transformations are all believed to proceed by a similar mechanism, we were eager to establish a more intimate understanding of the reaction mechanism in order to further expand the synthetic utility of this reaction class. We viewed the intramolecular hydroetherification of alkenols as a model transformation for this study. Our current mechanistic hypothesis is depicted in Scheme 1, using alkenol hydroetherification as a representative example. Following single electron transfer from the alkene (1) to the electronically excited Mes-Acr+, the pendant alcohol undergoes intramolecular nucleophile addition to the alkenyl cation radical (2). Deprotonation of distonic cation radical 3 and subsequent hydrogen atom transfer (HAT) furnishes the cyclic ether (5). In the excited state, Mes-Acr+* is thought to undergo one electron reduction from the alkene; however, exciplex-mediated cyclization has been implicated in similar systems.37−43 The HAT catalyst is believed to operate in a concomitant redox cycle where HAT generates phenylthiyl radical (PhS·), which serves as a one electron oxidant for the acridine radical (Mes-Acr·). In this way, regeneration of ground state Mes-Acr+ and proton transfer to the resulting thiolate (7) completes a net redox-neutral cycle. The efficacy of the arenethiol-based HAT catalysts has been attributed in part to the oxidizing nature of PhS· (E1/2red = +0.16 V vs SCE),44 which is expected to be an excellent redox partner for oxidation of Mes-Acr· (E1/2 = −0.55 V vs SCE).11
Scheme 1. Proposed Mechanism for Anti-Markovnikov Hydroetherification.

While many photoredox reactions feature additives that can greatly improve reaction efficacy through redox activity in parallel with the photosensitizer, few examples are truly catalytic with respect to the additive. In contrast, our system constitutes an interesting example where a redox active H atom donor seems to be catalytically relevant in both electron and proton transfer steps. However, mechanistic analysis of such multicomponent catalytic systems is notoriously challenging. To understand the interdependent nature of dual catalyst cycles requires an in-depth inquiry beyond macroscopic study of overall rate and reaction order. Thus, we sought to conduct kinetic studies on the elementary steps in the proposed reaction mechanism toward elucidation of the rate limiting factors. We took a tandem approach in our study of the mechanism: steady state and transient absorption and emission spectroscopies were employed in determining rate constants for steps 1–2 and 5–6, while computational methods were utilized to offer complementary insight where spectroscopic study was impracticable (step 4).
Results and Discussion
Oxidative Activity of Excited State Mes-Acr+
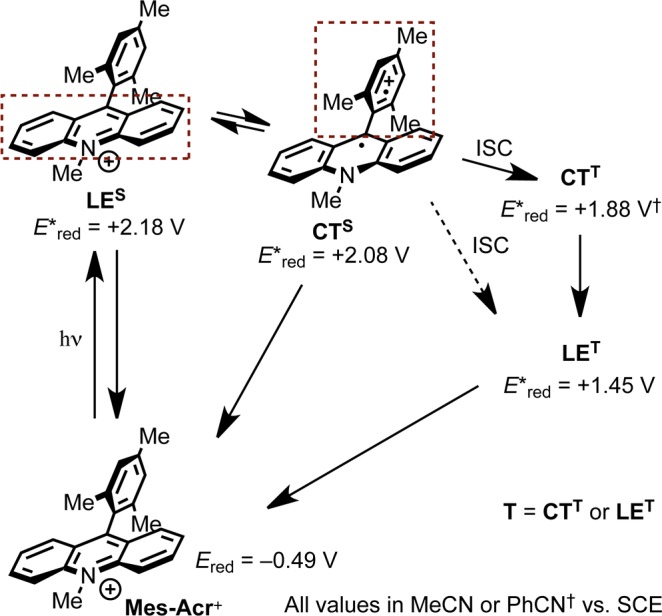
To address the photocatalytic activity of Mes-Acr+, we focused on the use of transient spectroscopic methods. Although Mes-Acr+ has been a well-studied, yet contentious chromophore in recent years, photophysical studies have been mainly directed toward characterization of its excited state topology (Scheme 2). Verhoeven et al. report that the first singlet excited state of Mes-Acr+, localized on the acridinium system (hereafter referred to as the locally excited singlet state or LES) undergoes rapid intramolecular charge transfer from acridinium to the mesityl substituent to form the singlet CT state (CTS).26LES and CTS are understood to be in thermal equilibrium, and fluorescence from both singlet states is measured on the nanosecond time scale. Moreover, both Fukuzumi and Verhoeven identify a long-lived transient species that is observed to decay on the order of microseconds following laser excitation. Much of the debate has centered on the identity of this microsecond transient species, suggested by Fukuzumi to possess CT character and an excited state reduction potential (E*red) of +1.88 V vs SCE,14 while Verhoeven provides evidence that the species is the locally excited triplet state with E*red = +1.45 V vs SCE.26 In the absence of unambiguous evidence that the triplet state is comprised of two distinct states or that it is singly a CT or LE triplet, we will simply refer to this long-lived intermediate as the triplet (T), noting that T may denote CTT (charge transfer triplet) or LET (locally excited triplet), or both.
Scheme 2. Excited State Energy Diagram Adapted from Verhoeven26 and Fukuzumi15.
In the course of our investigation, additional questions arose as to the photophysical nature of the excited state Mes-Acr+ in the midst of previous reports which draw varying conclusions from spectroscopic data. A crucial difference in our work was the use of nonpolar solvents such as 1,2-dichloroethane (DCE) rather than acetonitrile (MeCN), which was the medium employed in prior studies. Herein we share new evidence regarding the photophysical characteristics of Mes-Acr+ and its ET behavior in oxidation reactions with alkenes.
Fluorescence Quenching: Rate of Primary Electron Transfer k1
Of the reports where Mes-Acr+ is used as a preparative photolytic oxidant, the long-lived transient (T) has been primarily implicated in inquiries of its excited state oxidative capacity.16,19−21,23,24,45 Although Fukuzumi presents evidence that T is responsible for oxidation of arenes with moderate oxidation potentials (e.g., anthracene; Eox = +1.19 vs SCE16), the oxidation potentials of many substrates employed in our methodology (e.g., 9–11, Table 1) approach or exceed the excited state reduction potential of T (E*red), which is estimated to lie between +1.45 and +1.88 V vs SCE based on the values reported by Verhoeven and Fukuzumi, respectively. Thus, while we acknowledged the possibility T could undergo reduction from more oxidizible alkenes (e.g., 8, 9, and 1b in Table 1 could be oxidized by CTT), it seemed unlikely that T-mediated oxidation could be general with respect to all alkenes used in our system, on the grounds that SET from alkenes 1 to T is endergonic in the cases where Ep/2 of the alkene exceeds +1.88 V. We considered the possibility that a viable pathway for oxidation is through SET to a singlet excited state of Mes-Acr+ (both LES and CTS are estimated to have excited state reduction potentials exceeding +2.0 V vs SCE).26 Since both singlet states are fluorescent, we elected to measure the rate of electron transfer by Stern–Volmer analysis of Mes-Acr+ fluorescence quenching.46
Table 1. Mes-Acr+ Fluorescence Quenching by Alkenes and HAT Catalysts.
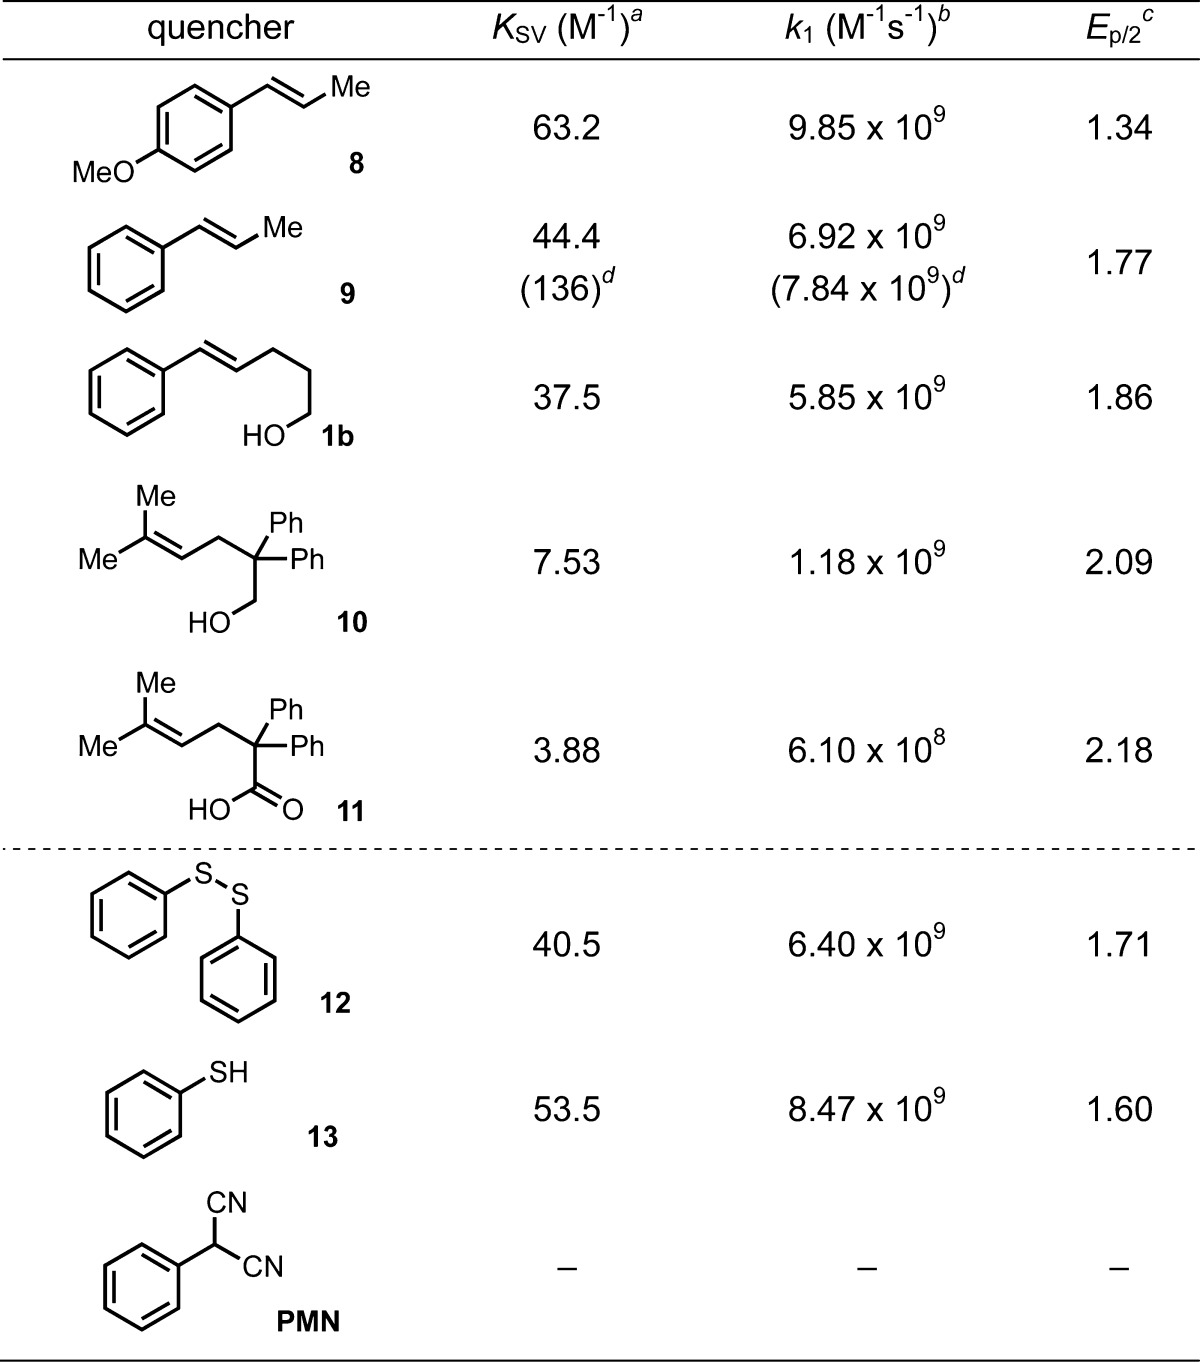
KSV: Stern–Volmer Constant; error <5% (estimated from multiple trials).
k1: bimolecular quenching constant (i.e., kq) where k1 = KSV/τo; error <6% (error in τo = 0.5%).
V vs SCE. Irreversible half wave potential measured by cyclic voltammetry (sweep rate = 100 mV/s).
Xyl-Acr+ as the fluorophore.
Employing Time-Correlated Single Photon Counting (TCSPC), we measure a fluorescence lifetime of 6.40 ± 0.03 ns for Mes-AcrBF4 in DCE.47 Stern–Volmer analysis was carried out on the observed quenching of fluorescence lifetime at increasing concentration of the quenchers given in Table 1. Anethole (8) quenches Mes-Acr+* most efficiently with a second order rate constant (9.9 ± 0.1 × 10⁹ M–1 s–1) near the diffusion limit, while even the poorly oxidizable alkenoic acid 11 quenches Mes-Acr+* with a rate constant of 6.1 ± 0.2 × 10⁸ M–1 s–1. Significantly, quenching of fluorescence is not observed for PMN, whereas both PhSH and (PhS)2 are competent quenchers at rates competitive with the alkenes studied.
Figure 2 shows the quenching constant, k1, plotted against the thermodynamic driving force ΔGo calculated from one electron oxidation potentials (Ep/2) of each quencher and the excited state reduction potential for Mes-Acr+ (E*red(LES) = +2.12 V vs SCE; Supporting Information Figure S3). The trend of this Rehm–Weller plot reveals a plateau in the rate of quenching as k1 approaches the diffusion limit, characteristic of a mechanism of quenching which proceeds via electron transfer.46,48 Furthermore, these results indicate that alkene oxidation by way of the singlet excited states of Mes-Acr+ is a feasible pathway for all substrates examined.
Figure 2.
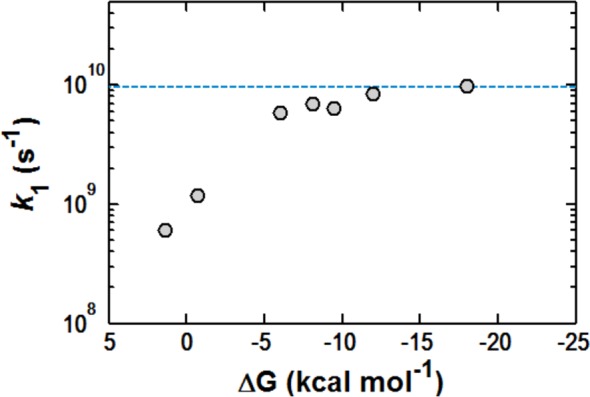
Rehm–Weller plot for k1 as determined by Stern–Volmer analysis of Mes-Acr+ fluorescence quenching where [Mes-Acr+] = 16 μM in DCE. Dashed blue line represents the diffusion limit in DCE (kdif ≈ 9.5 × 10⁹ s–1) estimated using the modified Debye equation.49
Emission Spectroscopy: Role of LES and CTS States in Oxidative Activity of Mes-Acr+
Although the above fluorescence quenching analysis clarifies that photoinduced electron transfer can be effected by a singlet state, it does not explicitly address whether the singlet state responsible for alkene oxidation is LE or CT in nature. At the wavelength of detection for fluorescence decay (515 nm), the contribution from CT emission is expected to be minimal (see Supporting Information, Figure S3), a finding consistent with the records reported by Verhoeven.26 Yet, because LES and CTS exist in equilibrium, a feature emphasized by the variable temperature emission spectra shown in Figure 3, the particular behavior of each individual singlet state is not easily extracted. Although seemingly a trivial question, we recognized that this detail has important implications in the design of more powerful photooxidants based on the mesityl-acridinium template. For example, if the active oxidant is a CTS state, then the oxidizing power of any mesityl-acridinium possessing a CTS state is approximately limited to the redox potential of the mesityl- cation radical. Alternatively, if the active oxidant is the LES state, then development of more oxidizing acridinium catalysts should focus on suppressing intramolecular charge transfer as a superfluous pathway.
Figure 3.
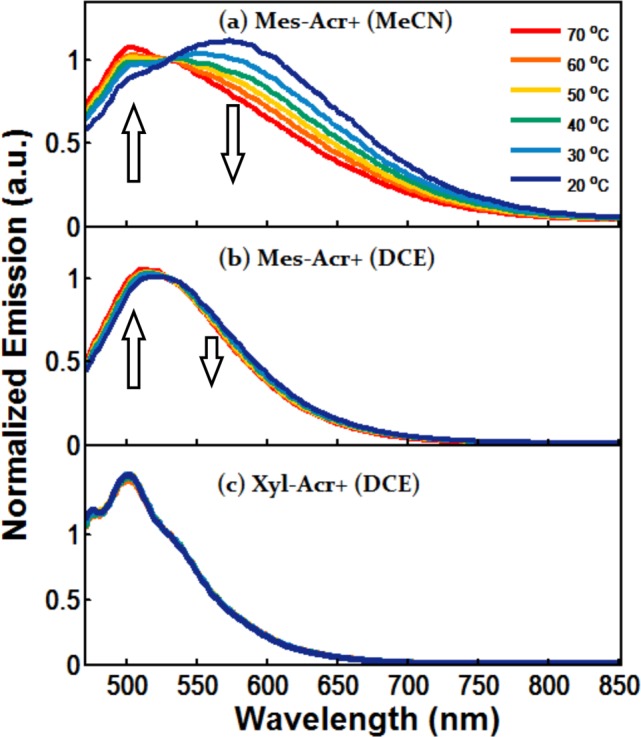
Variable temperature fluorescence spectra of Mes-Acr+ in (a) MeCN and (b) DCE and of (c) Xyl-Acr+ in DCE (λex = 450 nm). Spectra normalized to 530 nm to show decrease in CT and increase in LE components with increasing temperature.
To investigate this behavior, we compared the fluorescence properties of Mes-Acr+ to that of the 9-xylyl analogue (Xyl-Acr+ = 9-mesityl-10-methylacridinium tetrafluoroborate),50 which does not form a CT state in DCE,51 yet is seen to undergo fluorescence quenching (see Table 1, footnote d). The emission spectrum of Mes-Acr+ in MeCN shows a strong emission band centered around 570 nm that confirms the existence of a CTS state previously observed.52,53CTS is in equilibrium with LES, with emission centered around 500 nm (Figure 3a). Variable temperature emission spectra for Mes-Acr+ reveal a decrease in CTS fluorescence at elevated temperature as thermal repopulation of the LES becomes more significant, seen also as an increase in the LES emission component (Figure 3a).26 In DCE, the emission spectrum for Mes-Acr+ exhibits features of both LES and CTS states, but differs from the spectrum in MeCN in that the LES appears more pronounced (Figure 3b). In contrast, Xyl-Acr+ exhibits a comparatively narrow emission band and lacks CT fluorescence on the low-energy side as seen in Mes-Acr+ (Figure 3c). Variable temperature studies on Xyl-Acr+ reveal no change in the shape of fluorescence, and only a decrease in quantum yield (Supporting Information, Figure S6) is seen as temperature is increased, leading to the conclusion that the locally excited singlet state of Xyl-Acr+ is most prominent in DCE.
Having confirmed that Xyl-Acr+ exhibits no discernible CT fluorescence, we compared the rate of fluorescence quenching in Xyl-Acr+ to that of Mes-Acr+. We discovered that Xyl-Acr+ exhibits an enhanced fluorescence lifetime of 17 ± 0.8 ns, and is quenched by β-methylstyrene (9) with an even larger rate constant (k1 = 7.8 ± 0.3 × 10⁹ M–1 s–1) than is Mes-Acr+ (6.9 ± 0.3 × 10⁹ M–1 s–1). Because emission from Xyl-Acr+ occurs primarily from an LES state, this finding demonstrates that the CTS is not required for productive quenching. Furthermore, observation of a significantly longer fluorescence lifetime (τLEs) for Xyl-Acr+ emphasizes that CTS is formed by intramolecular quenching of LES in Mes-Acr+.26,52,53 That Xyl-Acr+* undergoes SET from alkenes faster than Mes-Acr+* suggests that the CTS is an unnecessary photophysical pathway for catalysts of this type. In fact, formation of CTS may decrease the likelihood of alkene oxidation by competitive quenching of the longer-lived LES. While this example does not preclude that the active oxidant in Mes-Acr+ is the CTS, it does reveal that an intramolecular charge transfer state is not essential to the oxidative activity of this acridinium class. We view these results as having important implications for catalyst development through future modifications to the currently deployed scaffold.
Laser Flash Photolysis: Detection of Cation Radical Intermediates
While absorbance spectra for styrenyl cation radicals have been reported upon generation in a solid matrix,54 key studies by Johnston and Schepp elucidated the solution phase spectra and kinetic behavior of styrenyl cation radicals when reacted with various nucleophiles.55−59 In light of this precedent, we felt confident that we could observe cation radicals (2) as intermediates upon Laser Flash Photolysis (LFP) with Mes-Acr+, given that the absorption for the cation radical (λmax = 590–600 nm) was expected to be spectrally separated from the transient signal for both T (λmax = 500 nm) and Mes-Acr· (λmax = 520 nm).
Laser flash photolysis was first performed on a 50 μM solution of Mes-AcrBF4 in DCE in order to determine the transient absorption spectrum for T and to establish a point of reference with prior photophysical studies. Although the transient absorption spectrum for the triplet matches the previously reported spectra closely, the observed microsecond transient decays with complicated kinetics (Supporting Information, Figures S10 and S11). The kinetic model used to achieve a best fit to the signal decay at 480 nm contained a first-order exponential (τT = 36 μs) and a second-order term (τT = 0.25 μs). The lifetime of the first order decay constant is similar to that calculated by Verhoeven in MeCN, while a second-order decay component has been by observed by Fukuzumi, who determined that bimolecular decay results from formation of a T···T dimer.22
When laser flash photolysis is performed on Mes-Acr+ with anethole (8), the anethole cation radical 8+· is detected by a new feature at 600 nm in the transient absorption spectrum after laser excitation of Mes-Acr+ at 430 nm (Figure 4a). The absorption spectrum for the anethole cation radical is calculated by subtraction of the contribution from Mes-Acr·, which was determined by spectroelectrochemical analysis (Supporting Information, Figures S1 and S10). The anethole cation radical 8+· possesses a maximum near 600 nm, and is in close agreement with the spectrum reported previously.55 Styrenyl cation radicals were also detected at a 20 ns time delay for β-methylstyrene (9), alkenol 1b and TBDMS-protected alkenol 14 using the same method of Laser Flash Photolysis (Figure 4b; see Supporting Information Figures S12–14a for curve fitting procedure). Centered roughly at 590 nm, these spectra likewise match the absorption spectra for β-alkyl cation radicals reported in the literature.54,60 The difference spectrum for protected alkenol cation radical 14 exhibits a maximum at 590 nm, and a corresponding absorbance for free alkenol 1b is observed with a maximum at the same wavelength, though this signal is significantly lessened at the 20 ns time delay.
Figure 4.
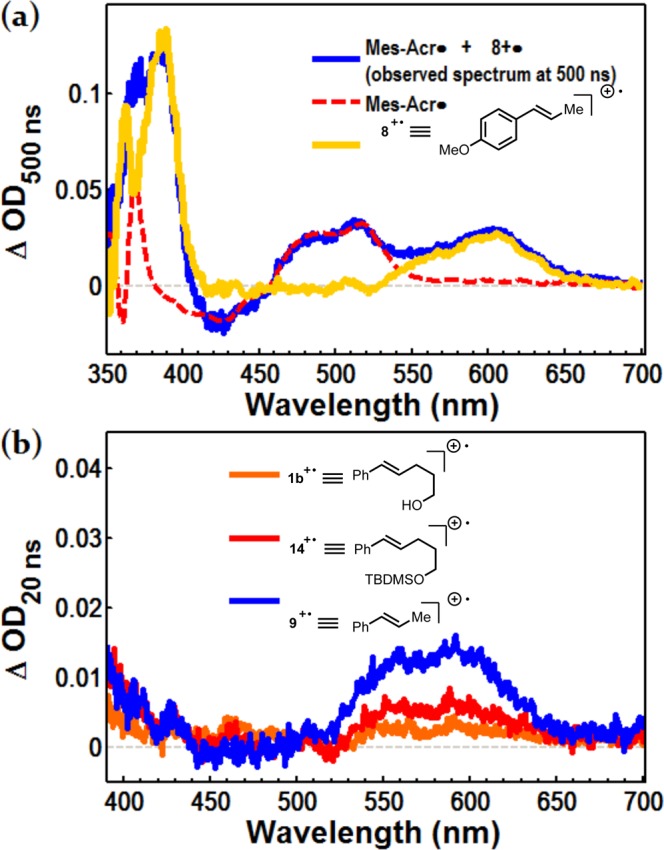
Detection of alkenyl cation radicals by Laser Flash Photolysis where [Mes-Acr+] = 50 μM in DCE. (a) The differential absorption spectrum for 8+· (yellow) obtained by subtraction of Mes-Acr· from the transient absorption spectrum at 500 ns. (b) The differential absorbance spectra for cation radicals 1b+·, 14+·, and 9+· (orange, red and blue, respectively) obtained by subtraction of Mes-Acr· and LET from the transient absorption spectrum recorded 20 ns after the laser pulse. OD = optical density, or absorbance.
Comparison between the lifetime of each cation radical 1b and 9 allows for estimation of the rate of cyclization (k2). Single wavelength kinetic decay (Supporting Information, Figures S12–14b) of the signal at 590 nm for TBDMS-protected alkenol 14 persists well into the microsecond regime (τ = 5.9 μs), while a signal for cation radical 1b cannot be detected at 590 nm at a time delay of 40 ns. We interpret this comparison to signify consumption of the styrenyl cation radical by nucleophilic addition of the tethered oxygen-nucleophile in 1b. On the basis of the observation that cation radical 1b cannot be detected beyond 40 ns, the first-order rate constant for intramolecular nucleophile addition is estimated to have an approximate lower limit of 2.5 × 10⁷ s–1 for this class of alkenols.61
Triplet or Singlet?
While quenching of singlet state Mes-Acr+* is observed for all substrates in Table 1 with large bimolecular rate constants k1, we noted that the efficiency of fluorescence quenching is generally low due to the short fluorescence lifetime of 6.4 ns. For example, when alkene 9 is the quencher, roughly 20% of fluorescence is quenched at a concentration of [9] = 6.0 mM (Supporting Information, Figure S9). In combination with a poor quantum yield of fluorescence (ΦF = 8%; Supporting Information, Figure S7), this corresponds to an oxidation quantum yield of roughly 1.6% at this concentration. Under the conditions where cation radical 9+· was detected by transient absorption spectroscopy (Figure 4b; [9] = 6.0 mM, [Mes-AcrBF4] = 0.050 mM), the estimated maximum concentration of both 9+· and Mes-Acr· is 0.8 μM following quenching of the singlet. However, based on the absorption for Mes-Acr· at 20 ns (Supporting Information, Figure S12), the actual concentration of Mes-Acr· (and 9+·) is 2.4 μM. Thus, regarding singlet Mes-Acr+* as the sole oxidant is inconsistent with the ca. 3-fold greater formation of 9+· than is predicted. This disparity leads us to believe that the singlet manifold of Mes-Acr+ is not the exclusive pathway for oxidation in the case of 9.
As previously noted, the triplet state T may be sufficiently oxidizing to undergo reduction by 9 (and other alkenes with less positive oxidation potentials). Indeed, given that the singlet excited states are insufficient to explain the degree of cation radical formation in Figure 4b, it is our conclusion that 9 can be oxidized by both the singlet and triplet excited states of Mes-Acr+. However, in our attempt to address the dynamics of alkene oxidation, we discovered that Mes-Acr+ forms ground state donor–acceptor complexes with alkenes (eq 1; see also Supporting Information, Figures S23 and S24), resulting in some degree of preassociation of the quencher with Mes-Acr+. For the portion of Mes-Acr+ complexed with the alkene as [Mes-Acr···9]+, excitation of the acridinium chromophore to LES can be followed by rapid electron transfer, likely faster than diffusion or excited state deactivation by fluorescence or intersystem crossing.62 Thus, if the efficiency of this electron transfer is assumed to be unity, the concentration of 9+· generated from irradiation of [Mes-Acr···9]+ can be estimated as the concentration of the complex [Mes-Acr···9]+ upon determination of the equilibrium constant KDA.
| 1 |
Using the Benesi–Hildebrands method,63 we estimate the equilibrium constant KDA to be 0.96 M–1. When applied to the conditions used in the spectroscopic analysis of Figure 4b, an additional 0.3 μM 9+· can be accounted for as originating from a donor–acceptor complex. In combination with the 0.8 μM generated by diffusion-limited quenching of the singlet state, we estimate that singlet Mes-Acr+ is responsible for roughly 45% (1.1 μM) of 9+· shown in Figure 4b, while the other 55% is most likely formed by reductive quenching of a triplet T. In this case, ET to LET would be disfavored, so the probable identity of T is CTT according to the assignment by Fukuzumi (E*red = +1.88 V vs SCE for CTT).
Importantly, we note that the preparative reactions are carried out at drastically higher concentrations than those used in spectroscopic studies (see Scheme 1). At higher concentrations, the proportion of [Mes-Acr···9]+ approaches that of free Mes-Acr+, which has the effect of increasing the efficiency of 9+· formation, even though the solutions are optically dense (i.e., Absorbance450 nm ≫ 2.0). Thus, while increasing the overall concentration does not increase the number of photons absorbed, it may increase the efficiency of oxidative quenching due to increased donor–acceptor complexation. Interestingly, the photochemical quantum yield of reaction (ΦR) was determined to be ∼1.7% at full conversion for the reaction of 1b with 0.1 equiv PhSH as the H atom donor.64 At earlier time points (t < 20 min), ΦR is slightly higher (∼2.3%), consistent with additional efficiency conferred by complexation when the substrate concentration is highest. Notably, the overall quantum efficiency of the reaction is compatible with the degree of fluorescence quenching observed for this substrate, supporting our mechanistic hypothesis for alkenes with high oxidation potentials.
Disulfide Exchange Experiments
Our lab has reported the use of diphenyl disulfide (PhS)2 as a HAT cocatalyst in place of PhSH. Although initially puzzling, we proposed that the activity of (PhS)2 could be understood to operate on the same mechanistic landscape as PhSH if either PhS· or PhS– was generated in situ from the disulfide (step 6). In this respect, it is important to note that (PhS)2 can be isolated as a minor byproduct when PhSH is used as an HAT catalyst. Conversely, significant amounts of PhSH are detected in reactions employing (PhS)2, implicating a possible equilibrium between the two species. Thus, we were eager to understand how the activity of the (PhS)2 and PhSH might be mechanistically related.
Given the sulfur–sulfur bond dissociation energy of (PhS)2,65 we reasoned that a homolytic mechanism was more likely than reductive cleavage in a redox system which lacks a strong reductant, given the highly negative reduction potential of (PhS)2 (Ep = −1.65 V vs Ag/AgCl).66,67 Both oxidative68−70 and triplet-sensitized71 mechanisms of S–S cleavage have been proposed for aryl- and alkyl-disulfides. While direct homolytic mechanisms are well-known in the literature,72 we were unaware of any previous report where an aryl disulfide is cleaved by irradiation with visible light. In order to evaluate the possibility of homolytic disulfide cleavage, we designed a crossover experiment with disulfide (4-MePhS)2 (15) as a “labeled” analogue to (PhS)2.71 Disulfide 15 was selected as a suitable “labeled” phenyl-disulfide as it affords a tractable difference in chromatographic mobility and mass-spectral signature without possessing a significant difference in dissociative behavior.65,73 In the event of homolysis, crossover of the arylthiyl units would be observed (whether by radical–radical recombination or by a homolytic substitution mechanism), which could be detected by gas chromatography as the symmetrical disulfides 12 and 15 exchange to form mixed disulfide 16 (Scheme 3).
Scheme 3. Disulfide Crossover Experiment Probing Mechanism of Disulfide Homolysis.
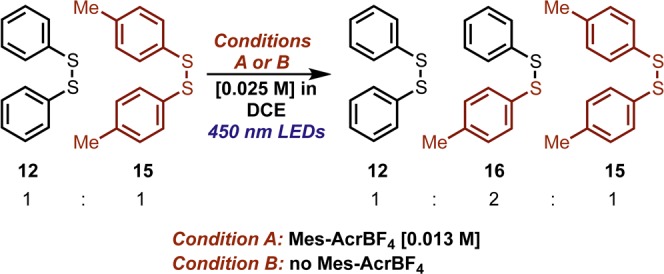
Under conditions directly analogous to the preparative reaction conditions (i.e., total disulfide concentration = 25 mM), the rate of exchange was monitored by GC–MS. Under irradiation of an equimolar solution of (PhS)2, (12), (4-MePhS)2 (15) and Mes-AcrBF4 (13 mM in each) with a blue LED lamp (Condition A), we observed disulfide crossover, with 16 formed in a ratio of 2:1:1 with respect to the symmetrical disulfides after approximately 120 min (Supporting Information, Figure S20). We were surprised to find that irradiation in the absence of Mes-AcrBF4 (Condition B) gave rise to disulfide 16, with apparent zero-order behavior until the equilibrium disulfide amounts were reached. Dark control experiments show no exchange within the analytical limits of the experiment at both room temperature and heating to 40 °C. Although we are unaware of any precedent where an aryl disulfide was cleaved with such low energy radiation, the spectral overlap between the disulfide solution and the emission output of the LED lamp is evident (Supporting Information, Figure S22).
These results indicate that the aryl disulfide bond can be homolytically cleaved directly in a light-dependent reaction, consistent with the zero-order behavior seen when Mes-Acr+ is absent. Presumably, the mechanism of disulfide exchange is different in the presence of the Mes-Acr+, as the mixed disulfide 16 forms with more complicated kinetics under Condition A. Considering that (PhS)2 quenches Mes-Acr+* fluorescence (Table 1), oxidation of (PhS)2 to the cation radical (PhS)2+· followed by sulfur–sulfur cleavage seems like a plausible mechanistic step. Additionally, triplet sensitization and subsequent homolysis is also possible. However, as it relates to the preparative reactions, we observe that Mes-Acr+ bleaches after approximately 3 min (vide infra) before the disulfide undergoes significant exchange. Thus, because Mes-Acr+ is not present in a photoactive form for a majority of the reaction, direct photolytic homolysis is the most mechanistically relevant possibility.
Laser Flash Photolysis: Direct Observation and Rate of Mes-Acr· Oxidation (k5) by PhS·
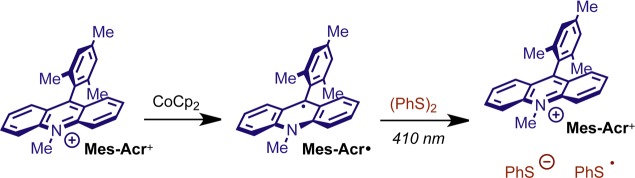
We viewed the photooxidant regeneration step 5 as vital in understanding the efficacy of the HAT catalyst and how the rate of this step affects the overall kinetics. Although there is literature precedent suggesting that the phenyl-thiyl radical PhS· would be capable of oxidizing the crucial intermediate Mes-Acr·,44,74 a fast dimerization process (Step 6) might be expected to compete with electron transfer (Step 5). Having characterized Mes-Acr· in isolation by spectroelectrochemical methods, we were optimistic that we could take advantage of the persistence of this acridinyl radical in a kinetic study of the regeneration event described by the rate constant k5. We anticipated that laser-induced generation of PhS· by LFP44,71,75−79 would allow us to monitor the oxidation of Mes-Acr· by transient absorption spectroscopy. To this end, we successfully prepared Mes-Acr· by chemical reduction with stoichiometric CoCp2 (Scheme 4).80−82 The acridinyl radical Mes-Acr· was indefinitely persistent at room temperature under dark, anaerobic conditions (Supporting Information, Figure S16).
Scheme 4. Chemical Reduction of Mes-Acr+ and Reoxidation via PhS· by Laser Flash Photolysis of (PhS)2.
To generate PhS· by photolysis of (PhS)2 while minimizing excitation of Mes-Acr·, we selected a laser excitation wavelength of λex = 410 nm, where Mes-Acr· absorption is at a minimum. We confirmed that PhS· could be generated under these conditions, decaying by second order kinetics (2kr = 2.7 × 10⁶ M–1 s–1, Supporting Information Figure S18a)78 independent of pump wavelength. When Mes-Acr· was prepared in a solution containing (PhS)2 and subjected to laser photolysis at 410 nm, a bleach in the signal at 520 nm was observed concomitant with a recovery of the Mes-Acr+ absorption at 445 nm. The bleach at 520 nm can be fit to a monoexponential curve with an observed rate constant k = 2.5 ± 0.4 × 10⁵ s–1 (Figure 5a). At this wavelength, absorbance due to PhS· is insignificant. However, the kinetics of Mes-Acr+ appearance at 445 nm are more complex due to the absorption of PhS· in this wavelength range (ε ≈ 2000 M–1 cm–1 at 460 nm).83
Figure 5.
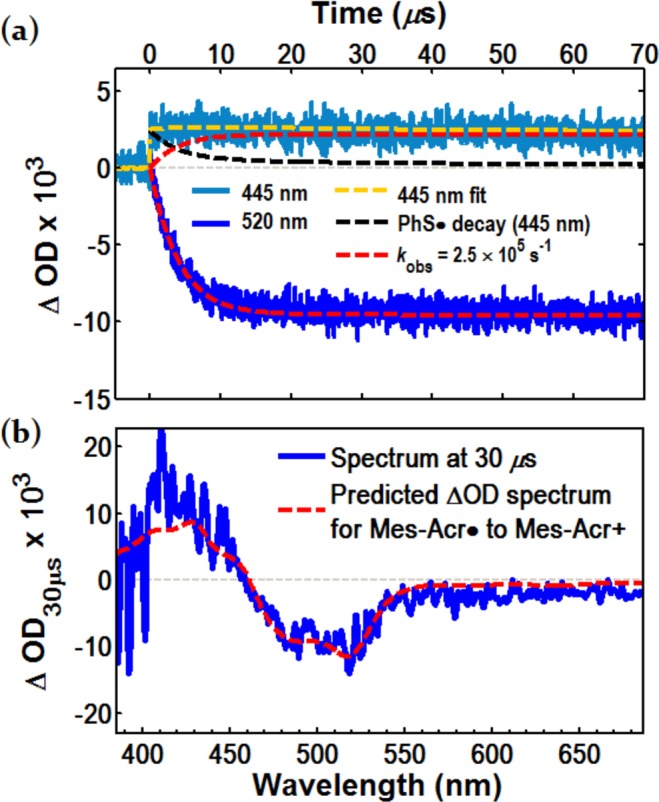
Direct observation of Mes-Acr· turnover by PhS· generated during LFP with excitation at 410 nm. (a) Bleach in absorbance at 520 nm (blue) corresponding to consumption of Mes-Acr·; fit to a monoexponential curve (dashed red) with an observed rate constant of 2.5 ± 0.4 × 10⁵ s–1; growth of the signal at 445 nm (light blue) corresponds to appearance of Mes-Acr+ and decay of PhS· and is fit to a curve (dashed yellow) consisting of a single exponential describing Mes-Acr+ appearance (dashed red) and mixed-order decay of PhS· (dashed black). (b) Transient difference spectrum at a 30 μs time delay. The dashed red trace is the predicted difference spectrum for 1:1 conversion of Mes-Acr· to Mes-Acr+.
As shown in Figure 5a, the transient signal at 445 nm is a combination of Mes-Acr+ growth and PhS· decay84 from an initial maximum of ∼2.5 mΔOD (OD = optical density, or absorbance). After taking PhS· decay into account,75,85−88 a single exponential fit describes the growth of Mes-Acr+ with an observed rate constant k = 2.5 × 10⁵ s–1, confirming that Mes-Acr+ grows in at the same rate that Mes-Acr· disappears. To a reasonable approximation, the concentration of Mes-Acr+ at t < 50 μs matches the amount of Mes-Acr· consumed, as determined from the ΔOD at 445 and 520 nm, respectively. Comparison of the transient spectrum at 30 μs with the predicted differential absorption spectrum (i.e., the opposite of the Mes-Acr· transient difference spectrum) yields strong similarity, further validating a direct conversion of Mes-Acr· to Mes-Acr+. In control experiments excluding (PhS)2, we are unable to observe any significant transient signal exceeding baseline absorbance (Supporting Information, Figure S17), supporting our interpretation that the radical PhS· is an oxidant for Mes-Acr·.89
To obtain a second-order rate constant k5, a pseudo-first-order kinetic study90 was conducted. The low photolytic yield of PhS· with laser photolysis at 410 nm precluded consistent generation of the thiyl radical over a range of Mes-Acr· concentrations. LFP was instead performed with 355 nm laser excitation.77 At this wavelength, photolysis of (PhS)2 is consistent over a range of Mes-Acr· concentration, and the concentration of PhS· generated in a 3 mM solution of (PhS)2 is estimated to be less than 6 μM. Varying the concentration of Mes-Acr· under pseudo-first-order conditions results in a linear increase in the rate of oxidation, measured as the rate of disappearance of the signal at 520 nm (Figure 6a). The second order rate constant k5 is taken as the slope of the line fit to the pseudo-first order plot in Figure 6b, and is calculated at 3.1 ± 0.5 × 10⁹ M–1 s–1. The magnitude of k5 is on the same order as k1 (kET), consistent with the expectation that ET between Mes-Acr· and PhS· is significantly exothermic.91 Control experiments under conditions where Mes-Acr+ and (PhS)2 are respectively excluded show no significant bleaching at 520 nm. We believe this experiment offers further evidence in support of our mechanistic proposal that Mes-Acr· is oxidized by PhS· in a key step that unites the cooperative activity of the photoredox and HAT cocatalysts.
Figure 6.
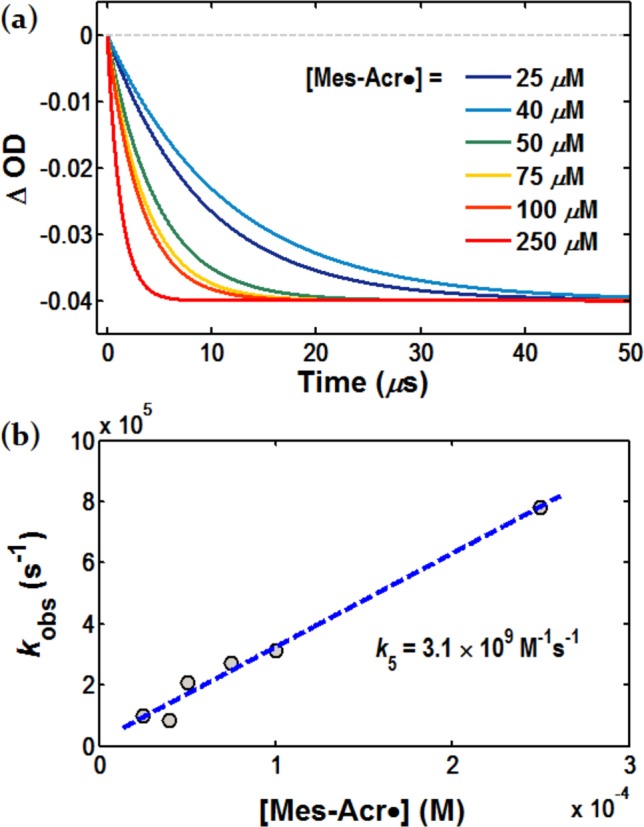
Determination of the second-order rate constant k5 describing oxidation of Mes-Acr· to Mes-Acr+ by PhS·. (a) Normalized monoexponential fitting for Mes-Acr· disappearance at 520 nm where [Mes-Acr·] ranges from 25 to 250 μM. (b) The observed rate constants for Mes-Acr· disappearance plotted against [Mes-Acr·]; the second order rate constant k5 is determined from the slope of the linear regression as 3.1 ± 0.5 × 10⁹ M–1 s–1 (error estimated from regression statistics).
Computational Results: Rate of HAT (k4)
We viewed steps 3 and 4 (proton transfer and HAT, respectively) more difficult to address experimentally. Thus, we turned to computational methods for estimating the rates of these steps. Although Arnold disclosed an ab initio study on the regioselective addition of methanol to alkene cation radicals,92 we wanted to model the intramolecular reaction using modern DFT methods. We recognized that a number of post-Hartree–Fock methodologies suffer from systematic errors in describing open shell systems where charge and spin localization are required, as in a cation radical.93−95 For this reason, we could not obtain meaningful information from inquiries into cation radicals 3 using the (U)B3LYP methodology.31,96−101 Thus, we focused our attention on step 4 (HAT) with calculations performed at the UB3LYP/6-311+G(d) level of theory.102−107
The lowest energy configuration of radical 4/PhSH (structure 17) following deprotonation is shown in Figure 7 to possess a hydrogen-bonding interaction between O and S–H groups. Radical 4 and PMN possess a similar H-bonded conformation (structure 19). In both cases, this structural configuration lies on the reaction coordinate for suprafacial HAT. The lowest energy transition structures computed for PhSH and PMN both exhibit geometries where the phenyl ring of the cocatalyst is perpendicular to the bond undergoing cleavage in the transition state (structures 18‡ and 20‡). For both H atom donors, this requires ca. 90 deg rotation of the dihedral angle, which, owing to double −CN substitution in PMN, is less energetically costly for PhSH. Additionally, the benzylic carbon atom of PMN is seen to undergo a change in hybridization in the transition state. The calculated activation free energy barrier (ΔG‡) for HAT is 9.5 kcal mol–1 for PhSH, as compared with 15.1 kcal mol–1 for PMN, likely reflecting the requirements for structural reorganization in PMN. This difference in activation barrier corresponds to a ca. 104-fold difference in rate, where HAT with PhSH is estimated to proceed with a rate constant of approximately 6.2 × 10⁵ M–1 s–1 at 298 K (cf. k4 with PMN computed at 5.0 × 101 M–1 s–1). The calculated rate constant k4 is in good agreement with experimentally determined rates for HAT between PhSH and alkyl and benzylic radicals (e.g., k = 3.13 × 10⁵ for PhCH2· in hexane).108,109 Moreover, the drastic lowering in activation energy for HAT with PhSH over PMN is likely to contribute to the enhanced efficacy of PhSH as an HAT cocatalyst.
Figure 7.
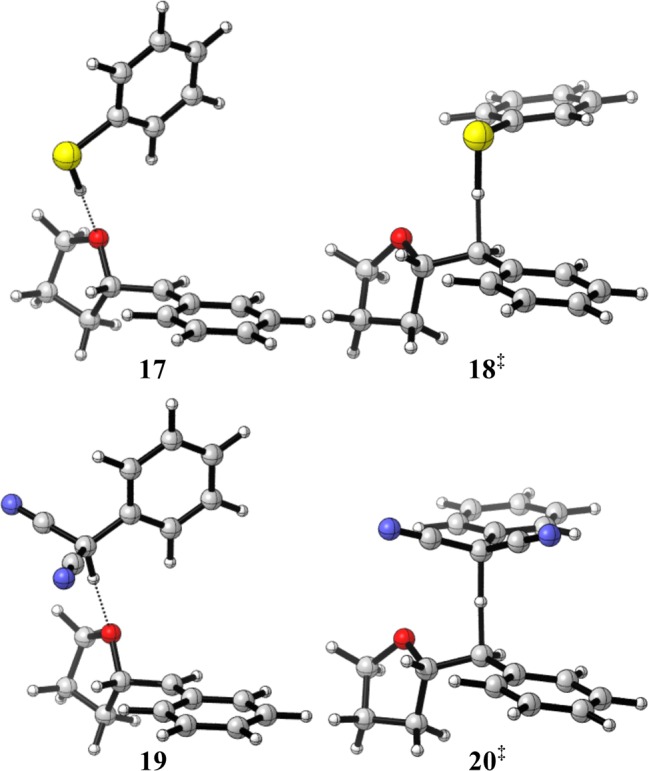
Computed structures for HAT between PhSH (17, 18‡) or PMN (19, 20‡) and benzylic radical 4. Structures 17 and 19 are local minima; structures 18‡ and 20‡ are transition states for HAT.
Preparative Scale Reaction Kinetics
The kinetic studies reported above predict fast alkene oxidation and intramolecular O-addition with catalyst turnover occurring on the nanosecond time scale. Furthermore, computational analysis predicts HAT to be relatively fast when PhSH is the H atom donor. Yet, the rate to completion of the preparative reaction is empirically slow. Therefore, we aimed to identify a resting state in both catalytic cycles in order to understand the key rate limiting factors.
1. HAT Catalyst Resting State and Substrate Conversion: Gas Chromatography (GC)
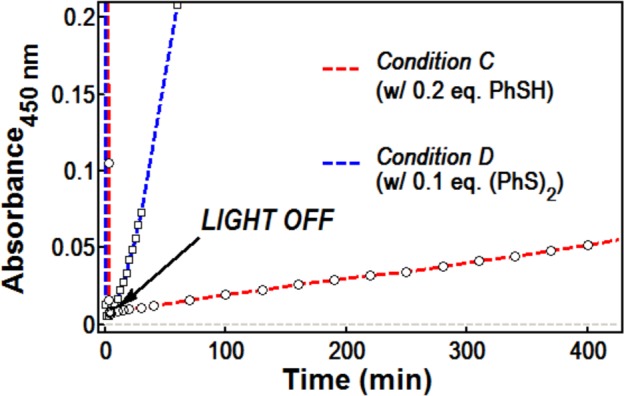
Kinetic analysis of alkenol 1b conversion (as shown in Figure 8) was conducted by sampling the mixture over the course of the reaction. A side-by-side comparison of PhSH and (PhS)2 as HAT catalysts reveals a marked difference between the activity of PhSH and (PhS)2. When the HAT catalyst is PhSH (Condition C), alkenol consumption and ether formation are approximately linear until reaction completion. In contrast, the overall rate of ether formation is significantly faster when (PhS)2 is employed (Condition D), and the reaction goes to completion after 4 h, but only after an induction period where the rate of product formation is somewhat delayed. Notably, the yield of ether 5b at full conversion is roughly 10% less (91% yield) for the reaction with (PhS)2 than with PhSH (essentially quantitative yield), possibly reflecting a bias toward reduction of the disulfide bond by 2H+/2e–.
Figure 8.

Reaction progress for hydroetherification of alkenol 1b under conditions C or D (scale: approximately 0.5 mmol alkenol 1b). (a and b) Conversion of 1b to 5b (PhSH and (PhS)2 also shown in units of mol % relative to [1b]o) as determined by gas chromatography with dodecane as an internal standard. (c and d) Monitoring Mes-Acr+/Mes-Acr· during reaction by UV–vis. Highlighted spectral traces: red = 0 min, orange = 1 min, yellow = 2 min, cyan = 3 min. Time traces of absorbance at 450 and 520 nm are highlighted in blue. Absorbance cut off above 1.75 absorbance units.
Monitoring the relative quantities of PhSH and (PhS)2 as the reactions proceed lends important insight into the resting state of the HAT catalyst. Under Condition C (Figure 8a), the amount of PhSH present (yellow) changes very little, and is maintained at approximately 17–19 mol % when PhSH is the HAT catalyst. In these cases, the remaining molar balance can be accounted for as (PhS)2 (orange), formed in roughly 1 mol % over the course of the reaction. In contrast, when 10 mol % (PhS)2 is employed, the disulfide is progressively converted to PhSH as the reaction goes to completion (Figure 8b, yellow/orange traces). This conversion is correlated with the formation of ether 5b, and in both reactions (Conditions C and D), the final amounts of PhSH and (PhS)2 are ca. 18 mol % and 1 mol % respectively, further evidence that (PhS)2 and PhSH share a common catalytic role.
2. Mes-Acr Resting State: UV–Vis Time Evolution
When Mes-Acr+ (13 mM) with alkenol 1b (250 mM) and either PhSH (Condition C) or (PhS)2 (Condition D) were continuously irradiated in a cuvette with 450 nm LEDs while monitored by UV–vis, the absorption for Mes-Acr· quickly grew in (λmax = 520 nm), but then decayed sharply, disappearing entirely by t = 4 min when PhSH is the HAT catalyst (Condition C) or t = 3 min when (PhS)2 is used (Condition D). Under the preparative conditions, the absorbance for 13 mM Mes-Acr+ is too intense to be measured; however, this absorption band (λ = 400–460 nm) likewise disappeared after only 3 min of irradiation. In the case of Condition C (HAT catalyst = PhSH), absorption at both 450 and 520 nm begin to return at ca. 6 h, corresponding to reappearance of Mes-Acr+ and Mes-Acr·, respectively. For Condition D (HAT catalyst = (PhS)2), both absorptions increase from baseline after only 1 h, reaching significant levels after ca. 4 h. Although the absorptions for both Mes-Acr+ and Mes-Acr· disappear early in the reaction, the kinetics in Figure 8 clearly indicate steady product formation during this period, verifying that the catalytic activity is not depleted.
Given that Mes-AcrBF4 can be isolated after the reaction is complete, we considered the possibility that the period when Mes-Acr+/Mes-Acr· absorbance is not detectable represents formation of a reversible adduct110−113 as a resting state. Shown in Scheme 5, we postulated that the PhS− could add to Mes-Acr+ following oxidation of Mes-Acr·. If this addition is reversible, a steady state concentration of Mes-Acr+ is available for immediate excitation and photoinduced ET with alkene 1b. In support of this hypothesis, we observe reappearance of the Mes-Acr+ absorption in the dark when irradiation is ceased after reaching depletion of Mes-Acr+/Mes-Acr· absorbance under Conditions C (Figure 9). Absorbance for Mes-Acr+ at 450 nm returns slowly, validating that Mes-Acr+ is catalytically relevant even after apparent bleaching. Similar behavior is observed when 0.1 eq. (PhS)2 is employed (Condition D); however, Mes-Acr+ reappears faster in this case (Figure 9). In both experiments, absorbance at 520 nm remains at baseline, indicating that Mes-Acr· is not formed. Attempts to observe a thiolate-acridinium adduct by 1H NMR or to isolate an adduct (e.g., 21) synthetically were unsuccessful, but efforts to characterize the resting state behavior of the Mes-Acr+ manifold are ongoing.
Scheme 5. Proposed Adduct Formation between PhS– and Mes-Acr+.

Figure 9.
Recovery of Mes-Acr+ absorbance at 450 nm under dark conditions after bleaching at t = 5 min.
Discussion: Rate Limiting Factors
We believe the difference in overall reaction rate when comparing PhSH and (PhS)2 is consistent with deprotonation (step 3, Scheme 1) having rate limiting influence. Because (PhS)2 does not depend on HAT for generation of thiyl radical PhS· in the early stages of reaction (i.e., before ca. 50% conversion), fast oxidation of Mes-Acr· results in a higher steady state concentration of PhS–, leading to a higher rate of deprotonation. On the other hand, PhSH is required to encounter radical 4 before generating PhS· at all points in the reaction. Although HAT is expected to be fast, concentration of radical 4 is in turn limited by the rate of deprotonation, to the effect of decreased PhS– concentration, and thus, a slower overall rate.
One consequence of the overlap between the catalytic cycles of Mes-Acr+ and HAT reagent is that the effect of a single rate limiting step could be amplified by preventing formation of intermediates crucial in the turnover of either cycle. Thus, the rate limiting step may change as the reaction progresses. If proton transfer is rate limiting as we suggest, the expected buildup of PhS– is consistent with the observation that Mes-Acr+ is occupied in an off-cycle intermediate. We acknowledge the possibility that such a step might also result in a rate limiting equilibrium. Pending current investigations into the rate of deprotonation (k4) and the putative equilibrium of the Mes-Acr+ catalyst and an as yet unidentified adduct, it is plausible that both steps have a combined limiting effect on the overall reaction rate when PhSH or (PhS)2 is employed as the hydrogen-atom donor catalyst.
Conclusion
Through the use of transient and steady state spectroscopic techniques, we have addressed the rate constants describing the elementary steps in our proposed mechanism for anti-Markovnikov alkene hydrofunctionalization, using an alkenol as an intramolecular model system. Detection of alkene cation radical intermediates validates that the mechanism proceeds by electron transfer rather than by formation of an exciplex between the catalyst an alkene as has been postulated in prior alkene hydrofunctionalization reactions involving photocatalysts. We found that all alkenes examined are oxidized on the nanosecond time scale by a singlet Mes-Acr+* state, while alkenes with moderate oxidation potentials can also be oxidized by the triplet state. Moreover, direct observation of Mes-Acr· turnover by PhS· supports the intermediacy of a key step which unites the parallel catalytic cycles of photoredox and HAT catalysts. Exchange studies reveal that disulfides are competent HAT catalysts which operate on the same cycle as the corresponding thiophenols by way of photolytic thiyl radical generation. We estimate the rate of HAT to be fast, with PhSH reacting at a rate ca. 104 times faster than PMN. Given that the rate constants addressed explicitly herein are estimated to be fast, our working hypothesis is that deprotonation may be rate limiting in some capacity. Observation that Mes-Acr+ is engaged in an off-cycle equilibrium is consistent with buildup of thiolate PhS– and further suggests the possibility that reversible adduct formation might have additional rate limiting influence. Many of the insights gained through this mechanistic analysis can be applied to other anti-Markovnikov hydrofunctionalizations reported by our group, although reaction specific considerations are the subject of an ongoing research program, along with current efforts toward photoredox catalyst development based on the acridinium scaffold.
Acknowledgments
A portion of this work was performed in the UNC-EFRC Instrumentation Facility established by the UNC EFRC (Center for Solar Fuels, an Energy Frontier Research Center funded by the U.S. Department of Energy, Office of Science, Office of Basic Energy Sciences under Award Number DE-SC0001011). This work was also supported by Award No. R01 GM098340 from the National Institute of General Medical Sciences. N.A.R. also acknowledges an NSF Predoctoral Fellowship. We are grateful to Dr. M. Kyle Brennaman, Prof. Alex Miller, and Prof. Jillian Dempsey for insightful conversations and assistance with spectroscopic measurements.
Supporting Information Available
Experimental procedures and spectral data. This material is available free of charge via the Internet at http://pubs.acs.org.
The authors declare no competing financial interest.
Funding Statement
National Institutes of Health, United States
Supplementary Material
References
- Beller M.; Seayad J.; Tillack A.; Jiao H. Angew. Chem., Int. Ed. 2004, 43, 3368–3398. [DOI] [PubMed] [Google Scholar]
- Müller T. E.; Hultzsch K. C.; Yus M.; Foubelo F.; Tada M. Chem. Rev. 2008, 108, 3795–3892. [DOI] [PubMed] [Google Scholar]
- Hintermann L. In C-X Bond Formation; Vigalok A., Ed.; Topics in Organometallic Chemistry; Springer: Berlin Heidelberg, 2010; pp 123–155. [Google Scholar]
- Utsunomiya M.; Kuwano R.; Kawatsura M.; Hartwig J. F. J. Am. Chem. Soc. 2003, 125, 5608–5609. [DOI] [PubMed] [Google Scholar]
- Utsunomiya M.; Hartwig J. F. J. Am. Chem. Soc. 2004, 126, 2702–2703. [DOI] [PubMed] [Google Scholar]
- Dong G.; Teo P.; Wickens Z. K.; Grubbs R. H. Science 2011, 333, 1609–1612. [DOI] [PubMed] [Google Scholar]
- Hamilton D. S.; Nicewicz D. A. J. Am. Chem. Soc. 2012, 134, 18577–18580. [DOI] [PMC free article] [PubMed] [Google Scholar]
- Perkowski A. J.; Nicewicz D. A. J. Am. Chem. Soc. 2013, 135, 10334–10337. [DOI] [PMC free article] [PubMed] [Google Scholar]
- Nguyen T. M.; Nicewicz D. A. J. Am. Chem. Soc. 2013, 135, 9588–9591. [DOI] [PMC free article] [PubMed] [Google Scholar]
- Nguyen T. M.; Manohar N.; Nicewicz D. A. Angew. Chem., Int. Ed. 2014, 53, 6198–6201. [DOI] [PMC free article] [PubMed] [Google Scholar]
- Wilger D. J.; Grandjean J.-M. M.; Lammert T. R.; Nicewicz D. A. Nat. Chem. 2014, 6, 720–726. [DOI] [PubMed] [Google Scholar]
- Wilger D. J.; Gesmundo N. J.; Nicewicz D. A. Chem. Sci. 2013, 4, 3160–3165. [Google Scholar]
- Prier C. K.; Rankic D. A.; MacMillan D. W. C. Chem. Rev. 2013, 113, 5322–5363. [DOI] [PMC free article] [PubMed] [Google Scholar]
- Fukuzumi S.; Ohkubo K.; Suenobu T. Acc. Chem. Res. 2014, 47, 1455–1464. [DOI] [PubMed] [Google Scholar]
- Fukuzumi S.; Kotani H.; Ohkubo K.; Ogo S.; Tkachenko N. V.; Lemmetyinen H. J. Am. Chem. Soc. 2004, 126, 1600–1601. [DOI] [PubMed] [Google Scholar]
- Kotani H.; Ohkubo K.; Fukuzumi S. J. Am. Chem. Soc. 2004, 126, 15999–16006. [DOI] [PubMed] [Google Scholar]
- Hasobe T.; Hattori S.; Kotani H.; Ohkubo K.; Hosomizu K.; Imahori H.; Kamat P. V.; Fukuzumi S. Org. Lett. 2004, 6, 3103–3106. [DOI] [PubMed] [Google Scholar]
- Ohkubo K.; Kotani H.; Fukuzumi S. Chem. Commun. 2005, 4520–4522. [DOI] [PubMed] [Google Scholar]
- Ohkubo K.; Nanjo T.; Fukuzumi S. Bull. Chem. Soc. Jpn. 2006, 79, 1489–1500. [Google Scholar]
- Fukuzumi S. Pure Appl. Chem. 2007, 79, 981–991. [Google Scholar]
- Ohkubo K.; Iwata R.; Yanagimoto T.; Fukuzumi S. Chem. Commun. 2007, 3139–3141. [DOI] [PubMed] [Google Scholar]
- Fukuzumi S.; Kotani H.; Ohkubo K. Phys. Chem. Chem. Phys. 2008, 10, 5159–5162. [DOI] [PubMed] [Google Scholar]
- Ohkubo K.; Mizushima K.; Iwata R.; Souma K.; Suzuki N.; Fukuzumi S. Chem. Commun. 2010, 46, 601–603. [DOI] [PubMed] [Google Scholar]
- Ohkubo K.; Fujimoto A.; Fukuzumi S. Chem. Commun. 2011, 47, 8515–8517. [DOI] [PubMed] [Google Scholar]
- Hoshino M.; Uekusa H.; Tomita A.; Koshihara S.; Sato T.; Nozawa S.; Adachi S.; Ohkubo K.; Kotani H.; Fukuzumi S. J. Am. Chem. Soc. 2012, 134, 4569–4572. [DOI] [PubMed] [Google Scholar]
- Benniston A. C.; Harriman A.; Li P.; Rostron J. P.; van Ramesdonk H. J.; Groeneveld M. M.; Zhang H.; Verhoeven J. W. J. Am. Chem. Soc. 2005, 127, 16054–16064. [DOI] [PubMed] [Google Scholar]
- Benniston A. C.; Harriman A.; Li P.; Rostron J. P.; Verhoeven J. W. Chem. Commun. 2005, 2701–2703. [DOI] [PubMed] [Google Scholar]
- Verhoeven J. W.; van Ramesdonk H. J.; Zhang H.; Groeneveld M. M.; Benniston A. C.; Harriman A. Int. J. Photoenergy 2005, 7, 103–108. [Google Scholar]
- Benniston A. C.; Harriman A.; Verhoeven J. W. Phys. Chem. Chem. Phys. 2008, 10, 5156–5156. [DOI] [PubMed] [Google Scholar]
- The tetrafluoroborate (BF4–) salt was employed in all studies herein; “Mes-Acr+” will be used synonymous to the 9-mesityl-10-methylacridinum cation when the counter-anion is irrelevant. Previous studies indicate that the mesityl-acridinium salts of non-coordinating anions (e.g. PF6–, ClO4–) exhibit indistinguishable photophysical behavior (ref (26)).
- Campbell J. M.; Xu H.-C.; Moeller K. D. J. Am. Chem. Soc. 2012, 134, 18338–18344. [DOI] [PubMed] [Google Scholar]
- Smith J. A.; Moeller K. D. Org. Lett. 2013, 15, 5818–5821. [DOI] [PubMed] [Google Scholar]
- Huang Y.; Moeller K. D. Tetrahedron 2006, 62, 6536–6550. [Google Scholar]
- Tang F.; Chen C.; Moeller K. Synthesis 2007, 3411–3420. [Google Scholar]
- Grandjean J.-M. M.; Nicewicz D. A. Angew. Chem., Int. Ed. 2013, 52, 3967–3971. [DOI] [PubMed] [Google Scholar]
- Zeller M. A.; Riener M.; Nicewicz D. A. Org. Lett. 2014, 16, 4810–4813. [DOI] [PubMed] [Google Scholar]
- Mizuno K.; Tamai T.; Nishiyama T.; Tani K.; Sawasaki M.; Otsuji Y. Angew. Chem., Int. Ed. Engl. 1994, 33, 2113–2115. [Google Scholar]
- Asaoka S.; Kitazawa T.; Wada T.; Inoue Y. J. Am. Chem. Soc. 1999, 121, 8486–8498. [Google Scholar]
- Asaoka S.; Wada T.; Inoue Y. J. Am. Chem. Soc. 2003, 125, 3008–3027. [DOI] [PubMed] [Google Scholar]
- Nishiyama Y.; Kaneda M.; Saito R.; Mori T.; Wada T.; Inoue Y. J. Am. Chem. Soc. 2004, 126, 6568–6569. [DOI] [PubMed] [Google Scholar]
- Nishiyama Y.; Kaneda M.; Asaoka S.; Saito R.; Mori T.; Wada T.; Inoue Y. J. Phys. Chem. A 2007, 111, 13432–13440. [DOI] [PubMed] [Google Scholar]
- Nishiyama Y.; Wada T.; Asaoka S.; Mori T.; McCarty T. A.; Kraut N. D.; Bright F. V.; Inoue Y. J. Am. Chem. Soc. 2008, 130, 7526–7527. [DOI] [PubMed] [Google Scholar]
- Fukuhara G.; Mori T.; Inoue Y. J. Org. Chem. 2009, 74, 6714–6727. [DOI] [PubMed] [Google Scholar]
- Larsen A. G.; Holm A. H.; Roberson M.; Daasbjerg K. J. Am. Chem. Soc. 2001, 123, 1723–1729. [DOI] [PubMed] [Google Scholar]
- Griesbeck A. G.; Cho M. Org. Lett. 2007, 9, 611–613. [DOI] [PubMed] [Google Scholar]
- Lakowicz J. R.Principles of Fluorescence Spectroscopy; 3rd ed.; Springer: New York, 2006. [Google Scholar]
- Compare with a lifetime of 6.0 ns as measured by Verhoeven with the PF6– salt. We also measured the fluorescence lifetime of Mes-AcrBF4 in MeCN to be 7.3 ns. These values are reasonably consistent with the fluorescence lifetimes reported by Verhoeven, et al.26
- Kavarnos G. J.; Turro N. J. Chem. Rev. 1986, 86, 401–449. [Google Scholar]
- The diffusion limiting rate in DCE is estimated by the modified Debye equation (Bäckström H. L. J.; Sandros K.; Lindgren J.-E.; Varde E.; Westin G. Acta Chem. Scand. 1960, 14, 48–62. [Google Scholar]; ) of the form: kdif = 2RT(2 + r1/r2 + r2/r1)/3000η where R = universal gas constant; T = 298 K; r1 and r2 are the collisional radii of the acridinium and quencher, respectively; η (viscosity of DCE at 298 K) = 0.779 mPa·s (; Haynes W. M.; Lide D. R.; Bruno T. J.. CRC Handbook of Chemistry and Physics; CRC Press: Boca Raton, FL; London; New York, 2013.); r1/r2 is estimated to be roughly 2, returning a value of ∼9.5 × 10⁹ s–1. [Google Scholar]
- Kuruvilla E.; Ramaiah D. J. Phys. Chem. B 2007, 111, 6549–6556. [DOI] [PubMed] [Google Scholar]
- Kuruvilla and Ramaiah (ref (50)) report that the iodide salt of Xyl-Acr+ possesses a CT-singlet state in an aqueous buffer, exhibiting a contracted fluorescence lifetime (τ = 3.6 ns) compared the value measured in DCE in our hands (τ = 17 ns).
- Jones G. II; Farahat M. S.; Greenfield S. R.; Gosztola D. J.; Wasielewski M. R. Chem. Phys. Lett. 1994, 229, 40–46. [Google Scholar]
- Van Willigen H.; Jones G.; Farahat M. S. J. Phys. Chem. 1996, 100, 3312–3316. [Google Scholar]
- Andrews L.; Harvey J. A.; Kelsall B. J.; Duffey D. C. J. Am. Chem. Soc. 1981, 103, 6415–6422. [Google Scholar]
- Johnston L. J.; Schepp N. P. J. Am. Chem. Soc. 1993, 115, 6564–6571. [Google Scholar]
- Schepp N. P.; Johnston L. J. J. Am. Chem. Soc. 1994, 116, 6895–6903. [Google Scholar]
- Johnston L. J.; Schepp N. P. Pure Appl. Chem. 1995, 67, 71–78. [Google Scholar]
- Schepp N. P.; Johnston L. J. J. Am. Chem. Soc. 1996, 118, 2872–2881. [Google Scholar]
- Schepp N. P.; Shukla D.; Sarker H.; Bauld N. L.; Johnston L. J. J. Am. Chem. Soc. 1997, 119, 10325–10334. [Google Scholar]
- Shida T.Electronic Absorption Spectra of Radical Ions; Elsevier: Amsterdam, 1988. [Google Scholar]
- This is in good agreement with values published by Johnston and Schepp on the rate of nucleophilic addition to substituted styrene cation radicals by various nucleophiles (ref (55)). Addition of alcohols to β-methylstyrene takes place with second order rate constants ranging from 1.0 × 10⁶ to 1.1 × 10⁷ M–1 s–1. One would expect the intramolecular addition to occur even faster.
- Rosokha S. V.; Kochi J. K. Acc. Chem. Res. 2008, 41, 641–653. [DOI] [PubMed] [Google Scholar]
- a Benesi H. A.; Hildebrand J. H. J. Am. Chem. Soc. 1949, 71, 2703–2707. [Google Scholar]; b Foster R.Organic Charge-Transfer Complexes; Academic Press, Inc. Ltd.: London, 1969. [Google Scholar]; c Bunting J. W.; Luscher M. A. Can. J. Chem. 1988, 66, 2532–2539. [Google Scholar]; d Although we are aware of the propensity of the Benesi-Hildebrand Method towards erroneous results (ref (63b)), the value for KDA obtained is within reason of the association constant estimated previously for an acridinium donor acceptor complex (ref (63c))
- The photochemical quantum yield of reaction was determined by chemical actinometry using Potassium Ferrioxalate. See Supporting Information, p S31 for details.
- Luo Y.-R.Handbook of Bond Dissociation Energies in Organic Compounds; CRC Press: Boca Raton, FL, 2003. [Google Scholar]
- Antonello S.; Daasbjerg K.; Jensen H.; Taddei F.; Maran F. J. Am. Chem. Soc. 2003, 125, 14905–14916. [DOI] [PubMed] [Google Scholar]
- Meneses A. B.; Antonello S.; Arévalo M. C.; González C. C.; Sharma J.; Wallette A. N.; Workentin M. S.; Maran F. Chem.—Eur. J. 2007, 13, 7983–7995. [DOI] [PubMed] [Google Scholar]
- Giordan J.; Bock H. Chem. Ber. 1982, 115, 2548–2559. [Google Scholar]
- Töteberg-Kaulen S.; Steckhan E. Tetrahedron 1988, 44, 4389–4397. [Google Scholar]
- Lakkaraju P.; Roth H. J. Chem. Soc., Perkin Trans. 1998, 2, 1119–1122. [Google Scholar]
- Wallace W. L.; Van Duyne R. P.; Lewis F. D. J. Am. Chem. Soc. 1976, 98, 5319–5326. [Google Scholar]
- Dénès F.; Pichowicz M.; Povie G.; Renaud P. Chem. Rev. 2014, 114, 2587–2693. [DOI] [PubMed] [Google Scholar]
- Although we were unable to locate any report of the BDE for (4-MePhS)2, the S-H BDE for 4-MePhSH (∼78–85 kcal mol–1) differs very little from that for PhSH (∼79–84 kcal mol–1) as noted by Luo.65
- Armstrong D. A.; Sun Q.; Schuler R. H. J. Phys. Chem. 1996, 100, 9892–9899. [Google Scholar]
- Ito O.; Matsuda M. J. Am. Chem. Soc. 1979, 101, 1815–1819. [Google Scholar]
- Ito O. Res. Chem. Intermed. 1995, 21, 69–93. [Google Scholar]
- Clarke J. L.; Kastrati I.; Johnston L. J.; Thatcher G. R. Can. J. Chem. 2006, 84, 709–719. [Google Scholar]
- Scott T. W.; Liu S. N. J. Phys. Chem. 1989, 93, 1393–1396. [Google Scholar]
- Thyrion F. C. J. Phys. Chem. 1973, 77, 1478–1482. [Google Scholar]
- Sattler W.; Ener M. E.; Blakemore J. D.; Rachford A. A.; LaBeaume P. J.; Thackeray J. W.; Cameron J. F.; Winkler J. R.; Gray H. B. J. Am. Chem. Soc. 2013, 135, 10614–10617. [DOI] [PubMed] [Google Scholar]
- Koelle U.; Infelta P. P.; Grätzel M. Inorg. Chem. 1988, 27, 879–883. [Google Scholar]
- Zheng S.; Berto T. C.; Dahl E. W.; Hoffman M. B.; Speelman A. L.; Lehnert N. J. Am. Chem. Soc. 2013, 135, 4902–4905. [DOI] [PubMed] [Google Scholar]
- Riyad Y. M.; Naumov S.; Hermann R.; Brede O. Phys. Chem. Chem. Phys. 2006, 8, 1697–1706. [DOI] [PubMed] [Google Scholar]
- PhS· decay at 445 nm is a combination of pseudo-first-order decay from reaction with Mes-Acr· and second-order decay from bimolecular radical–radical recombination. While more sophisticated models are required to truly describe the mixed order kinetics of PhS· disappearance (ref (75), (85−88)), we make the simplification that each decay mode is separate. See Supporting Information for details.
- Ito O.; Matsuda M. J. Am. Chem. Soc. 1979, 101, 5732–5735. [Google Scholar]
- Linschitz H.; Sarkanen K. J. Am. Chem. Soc. 1958, 80, 4826–4832. [Google Scholar]
- Zwicker E. F.; Grossweiner L. I. J. Phys. Chem. 1963, 67, 549–555. [Google Scholar]
- Closs G. L.; Rabinow B. E. J. Am. Chem. Soc. 1976, 98, 8190–8198. [Google Scholar]
- We also take this as evidence that CoCp2+ is inert to the redox activity of Mes-Acr· and PhS·, and therefore, not a significant perturbation to the system. As additional support to this point, the steady-state UV–vis absorption spectrum of Mes-Acr·/CoCp2+ was unchanged after subjection to >200 laser pulses during analysis by LFP.
- Anslyn E. V.; Dougherty D. A.. Modern Physical Organic Chemistry; University Science: Sausalito, CA, 2006. [Google Scholar]
- On the basis of E1/2red = +0.16 V vs SCE for PhS· reported by Larsen, et al. (ref (44)) and E1/2red = −0.55 V vs SCE for Mes-Acr+. ΔG = f(ΔE) = 23.061 kcal mol–1 eV–1 (−0.55–0.16 V) = −17 kcal mol–1 (f = Faraday Constant).
- Arnold D. R.; Chan M. S.; McManus K. A. Can. J. Chem. 1996, 74, 2143–2166. [Google Scholar]
- Bally T.; Sastry G. N. J. Phys. Chem. A 1997, 101, 7923–7925. [Google Scholar]
- Braïda B.; Hiberty P. C.; Savin A. J. Phys. Chem. A 1998, 102, 7872–7877. [Google Scholar]
- Sodupe M.; Bertran J.; Rodríguez-Santiago L.; Baerends E. J. J. Phys. Chem. A 1999, 103, 166–170. [Google Scholar]
- Herbertz T.; Roth H. D. J. Am. Chem. Soc. 1998, 120, 11904–11911. [Google Scholar]
- Zhang H.-Y.; Sun Y.-M.; Wang X.-L. J. Org. Chem. 2002, 67, 2709–2712. [DOI] [PubMed] [Google Scholar]
- Valley N. A.; Wiest O. J. Org. Chem. 2007, 72, 559–566. [DOI] [PubMed] [Google Scholar]
- Um J. M.; Gutierrez O.; Schoenebeck F.; Houk K. N.; MacMillan D. W. C. J. Am. Chem. Soc. 2010, 132, 6001–6005. [DOI] [PMC free article] [PubMed] [Google Scholar]
- Bagnol L.; Horner J. H.; Newcomb M. Org. Lett. 2003, 5, 5055–5058. [DOI] [PubMed] [Google Scholar]
- Even though B3LYP has been employed in previous computational studies of organic cation radicals (ref (31), (96−100)), our attempts to model transition structures for alkenol cation-radical cyclization and deprotonation (steps 2 and 3) with this popular functional resulted in erroneous geometries and frequencies. We could not discern whether these computations were mechanistically significant or the result of systematic methodological error.
- Computations were carried out using the Gaussian 09 software package (Frisch M. J.; et al. Gaussian 09, revision D.01; Gaussian, Inc.: Wallingford, CT, 2009). See Supporting Information for additional details and the full citation for Gaussian 09.
- Becke A. D. J. Chem. Phys. 1993, 98, 5648–5652. [Google Scholar]
- Lee C.; Yang W.; Parr R. G. Phys. Rev. B 1988, 37, 785–789. [DOI] [PubMed] [Google Scholar]
- Ditchfield R.; Hehre W. J.; Pople J. A. J. Chem. Phys. 1971, 54, 724–728. [Google Scholar]
- Hehre W. J.; Ditchfield R.; Pople J. A. J. Chem. Phys. 1972, 56, 2257–2261. [Google Scholar]
- Krishnan R.; Binkley J. S.; Seeger R.; Pople J. A. J. Chem. Phys. 1980, 72, 650–654. [Google Scholar]
- Franz J. A.; Suleman N. K.; Alnajjar M. S. J. Org. Chem. 1986, 51, 19–25. [Google Scholar]
- Franz J. A.; Bushaw B. A.; Alnajjar M. S. J. Am. Chem. Soc. 1989, 111, 268–275. [Google Scholar]
- Bunting J. W.; Chew V. S.; Abhyankar S. B.; Goda Y. Can. J. Chem. 1984, 62, 351–354. [Google Scholar]
- Ackmann A. J.; Fréchet J. M. J. Chem. Commun. 1996, 605–606. [Google Scholar]
- Zhou D.; Khatmullin R.; Walpita J.; Miller N. A.; Luk H. L.; Vyas S.; Hadad C. M.; Glusac K. D. J. Am. Chem. Soc. 2012, 134, 11301–11303. [DOI] [PubMed] [Google Scholar]
- Hagel M.; Liu J.; Muth O.; Estevez Rivera H. J.; Schwake E.; Sripanom L.; Henkel G.; Dyker G. Eur. J. Org. Chem. 2007, 3573–3582. [Google Scholar]
Associated Data
This section collects any data citations, data availability statements, or supplementary materials included in this article.