Advances in high-throughput fluorescence microscopy (HTFM) and image informatics have allowed heterogeneous single-cell phenotypes to be characterized and related to putative biological functions. However, it is underappreciated that accurate estimates of single-cell phenotypic variability depend on image correction. Further, the methods used throughout the HTFM literature do not generally take advantage of shared image properties, instead correcting each image independently. In this brief note, we first recall the basic mathematical framework underlying image correction. We then show how the true distributions of commonly measured single-cell features are altered in uncorrected images. Finally, we report an observation that allows the use of a simple method for accurate image correction in HTFM.
The intensity of a pixel, I, can be modeled by I = S(F + B), where: S is shading due to uneven illumination, F is the biologically relevant foreground fluorescence, and B is the background fluorescence1–3 (see Supplemental §1 for full model description). Image correction is a data preprocessing step whose goal is to obtain F. (Subsequent normalization steps, not discussed here, may be applied to deal with systematic experimental errors, such as row or column biases in microtiter plates4,5.)
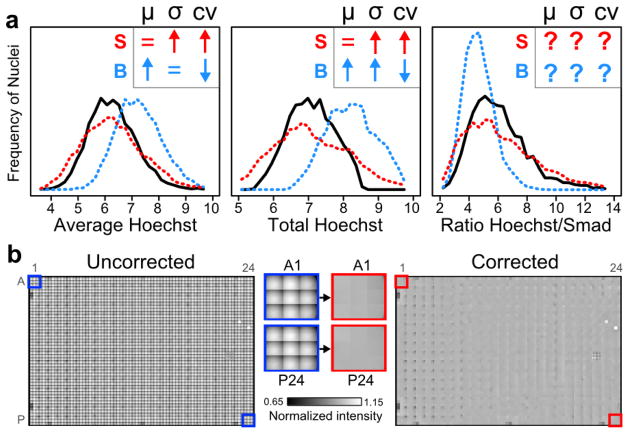
How is apparent cellular variability (e.g. standard deviation or coefficient of variation) affected when S or B are not removed from images? In Figure 1a and Supplemental §2, we analyze such effects for the distributions of commonly used single-cell features, namely: Average, Total or Ratiometric biomarker intensities. For these simple features, background and shading can alter apparent phenotypic variability in surprising ways. For example, the effects of either on the Ratio feature are generally unpredictable, while background increases Total feature variability due to underlying differences in cell size. Such changes to single-cell feature distributions can be particularly important in screening, where variation is commonly used to determine whether experimental conditions differ statistically from controls.
Figure 1.
a, Image background and shading can alter measured distributions of cellular phenotypes. The effects of image background (“B”, blue) or shading (“S”, red) on distributions of three measured cellular features were mathematically analyzed (assumptions in Supplemental Note §2). Insets show predicted directions of change (↑, ↓, =, or ?: increase, decrease, none, or indeterminate) of the mean (μ), standard deviation (σ), or coefficient of variation (cv= σ/μ). For Hoechst- and Smad-stained cells (n>3700), histograms illustrate these changes to single-cell feature distributions before (black) and after the addition of synthetic background (blue) or shading (red). x-axes are in arbitrary fluorescence units (left and middle) or are dimensionless (right). b, Shading in microtiter plates is defined by within-well position. Image grids from each well were normalized to the within-well median intensity and montaged across the entirety of a 384-well plate before (left and blue outlines) and after (right and red outlines) positional image correction (additional details in Supplemental Figure S2). Middle: zoomed in images of wells before or after image correction.
In practice, the challenge for correction is to estimate shading within an image, as subsequent background subtraction is relatively simple. How then should shading in large HTFM image datasets be estimated? In principle, every image from a microtiter plate could have its own unique shading pattern and background. Indeed, this is an (implicit) assumption of correction methods common to HTFM studies. However, we find that shading is not unique to every image, but is rather predictable based on image position within a well (Figures 1b, S1, S2). This observation suggests an image correction strategy for HTFM that only depends on within-well position. In short, images are corrected by within-well position using reference shading patterns estimated from the data (Figure 1b, Supplemental §3). This empirical approach using shared image properties across well positions is simpler than commonly used methods that estimate correction parameters for each individual image, yet more accurate than applying one set of correction parameters to all images. Accurate estimates of variability are important for large-scale studies of single-cell phenotypes, which are increasingly used to link functional significance to patterns of cellular heterogeneity.
Supplementary Material
Acknowledgments
We thank Dr. Jerry Shay for kindly providing HCECs. This work was supported by the National Institute of Health grants NCI R01CA133253 (SA), NIH R01 GM071794 (SA), NIH R01 GM081549 (LW), the Welch Foundation I-1619 (SA) and I-1644 (LW), NIH T32 GM008203 (AC), and HHMI MIG (AC).
Footnotes
Author Contributions Statement
AC performed the experiments, analyzed the data, and prepared the figures. CW and SR provided critical interpretations of the data and revisions of the manuscript. AC, LW, and SA wrote the manuscript. SR, LW, and SA prepared the general mathematical formulations. All authors reviewed the final manuscript.
Additional Information
The authors claim no financial conflicts of interest.
References
- 1.Schultz ML, Lipkin LE, Wade MJ, Lemkin PF, Carman GM. High resolution shading correction. The Journal of Histochemistry and Cytochemistry. 1974;22:751–754. doi: 10.1177/22.7.751. [DOI] [PubMed] [Google Scholar]
- 2.Likar B, Maintz JBA, Viergever MA, Perus F. Retrospective shading correction based on entropy minimization. Journal of Microscopy. 2000;197:285–295. doi: 10.1046/j.1365-2818.2000.00669.x. [DOI] [PubMed] [Google Scholar]
- 3.The Digital Signal Processing Handbook. CRC Press LLC; 1998. [Google Scholar]
- 4.Bray MA, Carpenter A. In: Assay Guidance Manual. Sittampalam GS, et al., editors. Eli Lilly & Company and the National Center for Advancing Translational Sciences; Bethesda (MD: 2013. [PubMed] [Google Scholar]
- 5.Dragiev P, Nadon R, Makarenkov V. Systematic error detection in experimental high-throughput screening. BMC Bioinformatics. 2011;12:25. doi: 10.1186/1471-2105-12-25. [DOI] [PMC free article] [PubMed] [Google Scholar]
Associated Data
This section collects any data citations, data availability statements, or supplementary materials included in this article.


