

Abstract
Background
Opioid use disorders are frequently associated with medical and psychiatric comorbidities (e.g., HIV infection and depression), as well as social problems (e.g. lack of health insurance). Comprehensive services addressing these conditions improve outcomes.
Objective
To compare the proportion of for-profit, nonprofit, and public opioid treatment programs offering comprehensive services, which are not mandated by government regulations.
Design, Setting, and Participants
Cross-sectional analysis of opioid treatment programs offering outpatient care in the United States (n=1 036).
Main Outcome Measure
Self-reported offering of communicable disease (HIV, sexually transmitted infections, and viral hepatitis) testing, psychiatric services (screening, assessment and diagnostic evaluation, and pharmacotherapy), and social services support (assistance in applying for programs such as Medicaid). Mixed-effects logistic regression models were developed to adjust for several county-level factors.
Results
Of opioid treatment programs, 58.0% were for profit, 33.5% were nonprofit, and 8.5% were public. Nonprofit programs were more likely than for-profit programs to offer testing for all communicable diseases (AOR: 1.7 [95% CI: 1.2, 2.5]), all psychiatric services (AOR: 8.0 [95% CI: 4.9, 13.1]), and social services support (AOR: 3.3 [95% CI: 2.3, 4.8]). Public programs were also more likely than for-profit programs to offer communicable disease testing (AOR: 6.4 [95% CI: 3.5, 11.7]), all psychiatric services (AOR: 25.8 [95% CI: 12.6, 52.5]), and social services support (AOR: 2.4 [95% CI: 1.4, 4.3]).
Conclusions
For-profit programs were significantly less likely than nonprofit and public programs to offer comprehensive services. Interventions to increase the offering of comprehensive services are needed, particularly among for-profit programs.
Keywords: drug abuse, mental health, social services, infectious disease, health care organization
Introduction
Over two million persons in the United States are dependent on prescription opioid analgesics, heroin, or both, and the number is increasing.1 Beyond addiction, persons with opioid use disorders have high medical, psychiatric, and social needs. In previous studies, approximately 10-30%are HIV-seropositive,2,3 60-96% have evidence of exposure to hepatitis C virus,2,4 and over 50% have a history of a sexually transmitted infection (STI).5 In addition, 3-33% meet criteria for major depression and 5-32% have anxiety disorders.6-8 Finally, 18-56% are uninsured9,10 and approximately half rely on public assistance or have minimal income.11-13
Government-regulated opioid treatment programs, which provide medication-assisted treatment for opioid use disorders with methadone or buprenorphine, currently enroll over 300 000 Americans.14 Provision of comprehensive services to identify and address medical, psychiatric, and social needs in the opioid treatment setting can improve outcomes specific to those conditions.15-20 More broadly, identification of undiagnosed communicable diseases such as HIV, viral hepatitis, and STIs, is essential to control these epidemics. Finally, provision of comprehensive services is associated with improved substance abuse treatment outcomes.15,21 Opioid treatment programs have a tremendous opportunity to provide these needed services, especially as many patients enrolled do not have another source of care.22,23
Given the potential benefits, provision of comprehensive services is recommended by the Substance Abuse and Mental Health Administration.24 However, funding streams for substance abuse treatment, medical services, and psychiatric services are largely separate. Opioid treatment programs can be operated as for-profit businesses, nonprofit organizations, or be owned and operated by the government (i.e., public). As comprehensive services are not mandated by federal regulations25 and may not be reimbursed in many cases, we hypothesized that for-profit programs would be less likely than nonprofit and public programs to offer these services.
Methods
Study Population and Exposure
Data on opioid treatment programs were taken from the National Survey of Substance Abuse Treatment Services (N-SSATS) in 2011.26 This survey is conducted yearly by the Substance Abuse and Mental Health Services Administration of the United States Department of Health and Human Services and collects data on a wide range of program characteristics. In 2011, the facility response rate was 94%.27 We included all opioid treatment programs that offered any outpatient substance abuse services and excluded programs with missing data on geography, ownership, or services offered.
The main exposure of interest was ownership of the opioid treatment program. Ownership was defined in the N-SSATS as private for-profit, private nonprofit, federal government, state government, tribal government, or local government. We collapsed all government-run facilities into a single “public” ownership category. The resulting three ownership categories were for-profit, nonprofit, and public.
Main Outcomes: Offering of Onsite Services
Testing for communicable diseases
The N-SSATS documents separately whether opioid treatment programs report offering onsite testing for HIV, STIs, hepatitis B viral infection, and hepatitis C viral infection. Whether programs test for gonorrhea, chlamydia, syphilis infection, or a combination, was not further specified. We collapsed testing for hepatitis B and C viral infections; only programs reporting testing for both hepatitis B and C viral infections were recorded as testing for viral hepatitis. We developed separate models examining whether opioid treatment programs offered testing for each communicable disease and whether they offered testing for all communicable diseases.
Psychiatric services
We focused on three separate components of onsite psychiatric services that the N-SSATS records: screening for mental health disorders (with referral for further diagnostic evaluation if necessary), assessment and diagnostic evaluation (e.g., thorough interview, psychiatric testing, or both), and offering of pharmacotherapy for mental health disorders.
Social services support
The N-SSATS queries opioid treatment programs about whether they offer patients onsite assistance with obtaining social services (e.g., Medicaid, Women Infants and Children benefits, and Supplemental Security Income). Opioid treatment programs were classified as providing social services support if they answered affirmatively to this question.
Other Variables: Local Factors
To adjust for differences in the communities served by different opioid treatment programs, we used measures of local epidemiologic need (e.g., rates of mental illness), local resource availability (e.g., availability of mental health professionals), and government policies affecting provision of services (e.g., income eligibility threshold for state Medicaid), a framework used in previous research (Table 1).28 We employed data at the county level when possible. If county-level data were not available, we used data at the smallest available geographic unit (e.g., Metropolitan Statistical Area).
Table 1.
Local factors evaluated for inclusion in models examining services offered by opioid treatment programs*
| Service (Dependent Variable) | Category | Local Factor (Independent Variables) | Data Source |
|---|---|---|---|
| Testing for communicable diseases (HIV, STIs, viral hepatitis) | Need | HIV cases, per 100 000 population | State Public Health Departments |
| Gonorrhea, chlamydia, and syphilis cases, per 100 000 population | |||
| Hepatitis C infection prevalence, per 100 000 population† | National Health Index41 | ||
| Treatment admissions for injection drug use, per 100 000 population | Treatment Episode Data Set42 | ||
| Resource Availability | Number of hospitals with specialty HIV/AIDS services, per 100 000 population | Area Resource File43 | |
| Government Policy | HIV/AIDS-related grant funding by the Center for Substance Abuse Treatment, per capita | Kaiser State Health Facts44 | |
| State regulatory requirement to test for syphilis on treatment intake | State Administrative Codes45 | ||
| Psychiatric services (screening, assessment, pharmacotherapy) | Need | Mean number of mentally unhealthy days in the past month | Behavioral Risk Factor Surveillance System46 |
| Adults reporting inadequate social/emotional support, % | |||
| Adults with serious mental illness, % | National Survey on Drug Use and Health47 | ||
| Resource Availability | Number of mental health professionals, per 100 000 population | Area Resource File43 | |
| Government Policy | Funding of State Mental Health Agency, per capita | Kaiser State Health Facts48,49 | |
| State Medicaid income eligibility threshold | |||
| State offers Medicaid to low-income, non-disabled adults without dependents | |||
| Social services support | Need | Persons with disabilities, % | American Community Survey50 |
| Veterans, % | |||
| Unemployed, % | |||
| High school graduates, % | |||
| Uninsured adults < 65 years old, % | |||
| Adults < 65 years old with public insurance, % | |||
| Adults under the poverty line, % | |||
| Receiving public assistance, %‡ | |||
| Receiving food assistance, %‡ | |||
| Resource Availability | Revenue of human services non-profit organizations, per capita | National Center for Charitable Statistics51 | |
| Government Policy | State Medicaid reimburses for methadone maintenance | National Conference of State Legislatures52 | |
| State Medicaid income eligibility threshold | Kaiser State Health Facts49 | ||
| State offers Medicaid to low-income, non-disabled adults without dependents | |||
| Income eligibility for State Temporary Assistance for Needy Families program | Welfare Rules Databook53 |
All variables were included in final models unless otherwise noted. STI= Sexually Transmitted Infections
Prevalence of hepatitis C infection per 100 000 population was not included in the final models as there was multicollinearity between this variable, HIV cases per 100 000 population, and gonorrhea, chlamydia, and syphilis cases per 100 000. As hepatitis C prevalence is estimated and not reported, it was removed from the final models, resolving the multicollinearity.
The percent receiving food assistance and percent receiving public assistance were not included in the final models as there was multicollinearity between these variables and the percent of persons under the poverty line.
Statistical Analysis
First, we compared the characteristics of and services offered by for-profit, nonprofit, and public opioid treatment programs using chi-square and Kruskal-Wallis tests for categorical and continuous variables, respectively.
Then, to determine the association of for-profit, nonprofit, or public ownership with comprehensive services offered, adjusting for local factors, we developed mixed-effects logistic regression models. In each model, the dependent variable was whether the service of interest was offered by the opioid treatment program. Ownership, the main independent variable, and all local factors were added as fixed effects. A county-level random intercept was used. Adjusted odds ratios (AOR) with 95% confidence intervals (95% CI) were constructed with for-profit opioid treatment programs as the referent group. Multicollinearity was assessed using SAS PROC REG to examine for a tolerance less than 0.40. A P-value ≤ .05 was considered statistically significant. All statistical analyses were conducted using SAS (version 9.3, SAS Institute, Cary, NC, USA).
Subgroup Analyses
To assess the robustness of our results, we performed three pre-specified subgroup analyses. First, we examined only freestanding programs. Compared to programs located in or operated by hospitals, these programs may have less institutional and administrative support, access to professional staff (e.g., psychologists), and laboratory services, which may account for differences in offering comprehensive services. Second, we compared for-profit and nonprofit opioid treatment programs that accept Medicaid as some state Medicaid plans may reimburse for comprehensive services. We did not include public programs in this analysis as nearly all public programs accept Medicaid or were completely free. Finally, we compared for-profit and nonprofit programs that received government grant funding; public programs were not included in this analysis as they are, by definition, government funded. Government grant funding may specifically fund comprehensive services, or may allow programs to provide comprehensive services while maintaining an acceptable profit margin.
Results
We identified 1 103 opioid treatment programs that offered outpatient services in the N-SSATS. Of these, complete facility- and local-level data were available for 94.8% (1 036/1 103). These 1 036 programs were located in 435 different counties, in 47 states and the District of Columbia. Facility characteristics of these opioid treatment programs and comparisons of characteristics by ownership are presented in Table 2.
Table 2.
Characteristics of for-profit, non-profit, and public opioid treatment programs offering any outpatient treatment in the United States, 2011
| Total (n=1036) | For-profit (n=601) | Nonprofit (n=347) | Public (n=88) | P value | |
|---|---|---|---|---|---|
| Patients Enrolled* | |||||
| Total | 292 476 | 167 457 | 106 905 | 18 114 | - |
| Mean patients per program (SD) | 282.3 (213.5) | 278.6 (214.2) | 308.1 (220.1) | 205.8 (155.8) | <0.0001 |
| Census Region, % | <0.0001 | ||||
| Northeast | 29.0 | 17.5 | 50.1 | 25.0 | |
| Midwest | 15.6 | 14.8 | 15.6 | 21.6 | |
| South | 33.2 | 43.3 | 18.2 | 25.0 | |
| West | 21.9 | 24.5 | 16.1 | 28.4 | |
| Type of Treatment Offered, % | <0.001 | ||||
| Detoxification | 2.4 | 2.0 | 2.9 | 3.4 | |
| Maintenance | 33.3 | 28.1 | 41.5 | 36.4 | |
| Both | 64.1 | 69.9 | 55.6 | 60.2 | |
| Opioid Replacement Offered, % | |||||
| Methadone only | 50.9 | 50.9 | 54.5 | 36.4 | |
| Buprenorphine only | 0.7 | 0.5 | 0.9 | 2.3 | |
| Both | 48.4 | 48.6 | 44.7 | 61.4 | |
| Freestanding, % | 87.0 | 98.5 | 77.5 | 45.5 | <0.0001 |
| Receive government grant funding, % | 40.6 | 20.0 | 76.4 | - | <0.0001 |
| Accept Medicaid insurance, %† | 62.9 | 46.3 | 92.7 | - | <0.0001 |
Patient counts were missing for 5% (53/1 036) of programs.
This variable was missing in three for-profit, three nonprofit, and two public programs. All but three public programs either accepted Medicaid or were completely free.
Of all opioid treatment programs, 58.0% were operated as for-profit businesses, 33.5% were nonprofit organizations, and 8.5% were public programs. For-profit, nonprofit, and public programs were significantly different in all characteristics we examined. In unadjusted analyses, nonprofit and public programs were more likely to offer testing for HIV, STIs, viral hepatitis, and all communicable diseases than for-profit programs (Figure 1; P < 0.001 for all comparisons). Nonprofit and public programs were also more likely to offer psychiatric screening, assessment, and pharmacotherapy than for-profit programs (P < 0.001 for all comparisons). Finally, nonprofit and public programs were more likely to offer social services support than for-profit programs (P < 0.001 for both comparisons).
Figure 1.
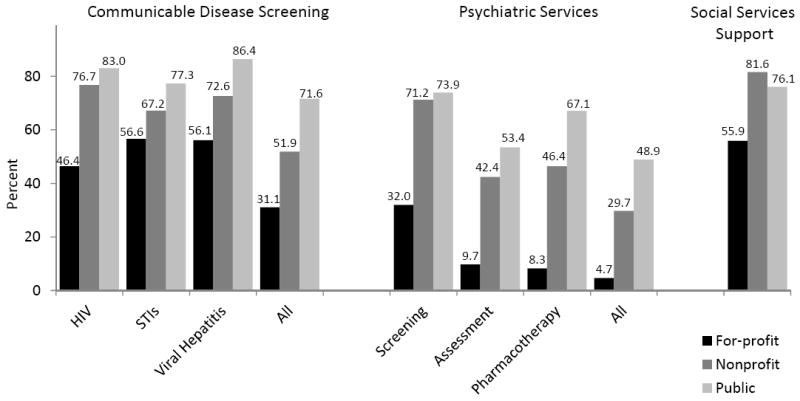
Percent of for-profit, nonprofit, and public opioid treatment programs offering comprehensive services
STI = Sexually Transmitted Infection
There were significant differences in the percent of for-profit, nonprofit, and public programs offering each service (P < 0.001 for all comparisons)
After adjustment for local factors, nonprofit and public programs were significantly more likely to offer testing for HIV, viral hepatitis, and all communicable diseases than for-profit programs (Figure 2). In addition, public programs were more likely than for-profit programs to offer STI testing. For psychiatric services, nonprofit and public programs were more likely than for-profit programs to offer psychiatric screening, assessment and diagnostic evaluation, pharmacotherapy, and all psychiatric services. Finally, nonprofit and public programs were more likely to offer social services support than for-profit programs.
Figure 2.
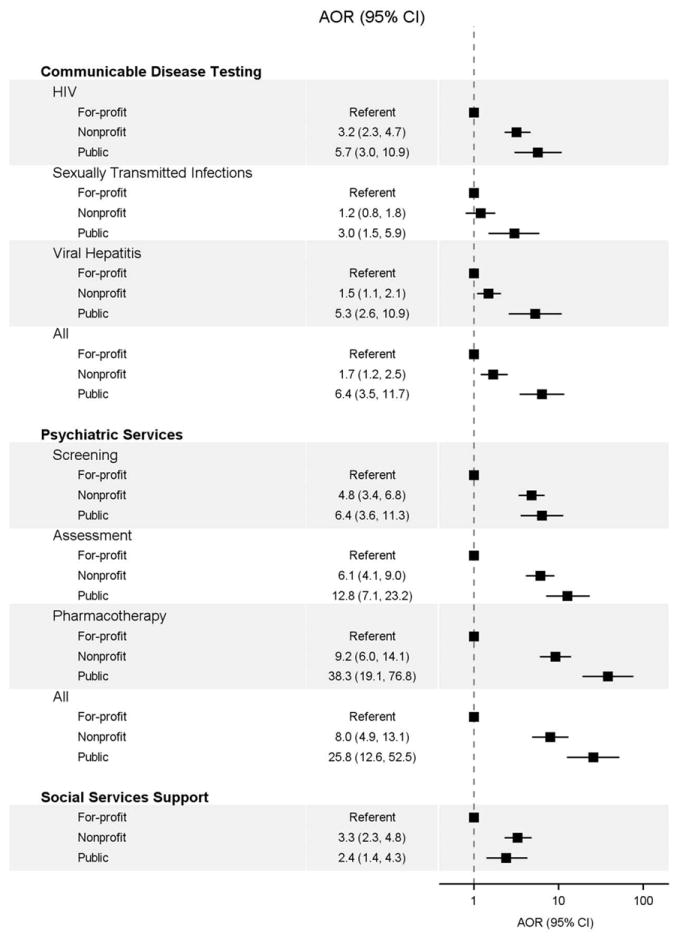
Offering of comprehensive services by ownership of opioid treatment program, after adjusting for local factors.
Subgroup Analyses
After adjustment for local factors, freestanding nonprofit and public programs remained significantly more likely than freestanding for-profit programs to offer most comprehensive services (see Figure 1, Supplemental Digital Content). Of programs accepting Medicaid, nonprofit programs remained significantly more likely than for-profit programs to offer all comprehensive services other than STI testing (see Figure 2, Supplemental Digital Content). Of programs receiving government grant funding, nonprofit programs remained significantly more likely than for-profit programs to offer HIV testing, all psychiatric services, and social services support (see Figure 3, Supplemental Digital Content).
Discussion
In analyses of nationwide data on opioid treatment programs, for-profit programs were significantly less likely than nonprofit and public programs to offer almost all comprehensive services examined. These differences persisted after adjusting for locality, including measures of local need, local resource availability, and government policies affecting the counties in which programs operate. In addition, for-profit programs remained less likely to offer most comprehensive services in pre-specified subgroup analyses. Together, our findings reveal a strong association between ownership and comprehensive services offered.
Previous smaller-scale research has found that patients enrolled in for-profit methadone treatment programs have decreased access to and utilization of comprehensive services such as general medical care, educational assistance, vocational assistance, assistance with finances, and smoking cessation services, compared to patients in nonprofit and public programs.29,30 Further analyses have shown that local factors (e.g., per capita income) are associated with specific services offered by drug treatment facilities.31 As for-profit, nonprofit, and public opioid treatment programs may serve different communities, these local factors may explain differences in services offered. However, even after accounting for local factors in the current study, we still found that for-profit programs were substantially less likely than nonprofit and public programs to offer most comprehensive services examined. In some cases, it also appeared that public programs were more likely to offer services than nonprofit programs, but this comparison was not explicitly tested and further investigation is required.
Failure to address the medical, psychiatric, and social needs of persons with opioid use disorders in treatment can have serious consequences. Delayed diagnosis of communicable diseases has high monetary costs32,33 and puts patients at risk for end-organ complications, disease progression, and continued transmission.34,35 Undiagnosed HIV infection is associated with substantial high-risk sexual, and injection-related behavior, which is reduced after diagnosis.36,37 For mental health, undiagnosed or untreated psychiatric disorders can significantly impair functioning and impede recovery.38,39 Finally, lack of insurance may lead to reduced access to care and higher out-of-pocket expenditures.9,40 By providing medication-assisted treatment, for-profit programs likely improve drug-related outcomes for many patients. However, as many patients do not have another source of care,22,23 our findings suggest that those enrolled in for-profit opioid treatment programs, and their communities, are at increased risk from unmet medical, psychiatric, and social needs.
The study had several limitations. First, offering of services was by self-report, and misreporting could bias our results in either direction. No measure of service quality is provided, and important quality differences between programs may exist. Second, patient-level data are not available and so it is impossible to determine patient use of services. Finally, we may not have included important or unmeasurable local factors in our regression models, thus leading to inaccurate estimates of the association between ownership and services offered. However, adjusted odds ratios were often 3.0 or greater, so any confounder not included or measured would need to be very strongly associated with both ownership and services offered to explain the association we observed.
In summary, for-profit opioid treatment programs in the United States are less likely to offer comprehensive medical, psychiatric, and social services, even after adjusting for differences in communities served. While not all patients may require all types of services, interventions to increase the offering of comprehensive services to those in need are essential. These interventions could include improving regulatory and financial support for comprehensive services, expansion of nonprofit and public opioid treatment programs, encouraging programs to seek medical home status which may increase care provided and reimbursements, or pairing programs with experienced community organizations to provide on-site services. Primary care providers, which already provide many important services, could also be incentivized to expand office-based opioid treatment. Continuing failure to provide these services may put patients at risk for poor medical outcomes, jeopardize substance abuse treatment outcomes, and threaten public health.
Supplementary Material
Offering of comprehensive services by ownership for freestanding opioid treatment programs, after adjusting for local factors.
Offering of comprehensive services by ownership of opioid treatment programs that accept Medicaid, after adjusting for local factors.
Offering of comprehensive services by ownership of opioid treatment programs receiving government grant funding, after adjusting for local factors.
Acknowledgments
This study was supported by NIH R34DA031066, R01DA032110, R25DA023021, and the Center for AIDS Research at the Albert Einstein College of Medicine and Montefiore Medical Center (NIH AI-51519).
References
- 1.Substance Abuse and Mental Health Services Administration. Results from the 2012 National Survey on Drug Use and Health: Summary of National Findings, NSDUH Series H-46, HHS Publication No (SMA) 13-4795. Rockville, MD: Substance Abuse and Mental Health Services Administration; 2013. [Google Scholar]
- 2.Dhingra L, Masson C, Perlman DC, et al. Epidemiology of pain among outpatients in methadone maintenance treatment programs. Drug Alcohol Depend. 2013;128(1-2):161–165. doi: 10.1016/j.drugalcdep.2012.08.003. [DOI] [PMC free article] [PubMed] [Google Scholar]
- 3.Gourevitch MN, Friedland GH. Interactions between methadone and medications used to treat HIV infection: a review. Mt Sinai J Med. 2000;67(5-6):429–436. [PubMed] [Google Scholar]
- 4.Novick DM, Kreek MJ. Critical issues in the treatment of hepatitis C virus infection in methadone maintenance patients. Addiction. 2008;103(6):905–918. doi: 10.1111/j.1360-0443.2008.02188.x. [DOI] [PMC free article] [PubMed] [Google Scholar]
- 5.Liebschutz JM, Finley EP, Braslins PG, et al. Screening for sexually transmitted infections in substance abuse treatment programs. Drug Alcohol Depend. 2003;70(1):93–99. doi: 10.1016/s0376-8716(02)00361-7. [DOI] [PMC free article] [PubMed] [Google Scholar]
- 6.Brooner RK, King VL, Kidorf M, et al. Psychiatric and substance use comorbidity among treatment-seeking opioid abusers. Arch Gen Psychiatry. 1997;54(1):71–80. doi: 10.1001/archpsyc.1997.01830130077015. [DOI] [PubMed] [Google Scholar]
- 7.Mason BJ, Kocsis JH, Melia D, et al. Psychiatric comorbidity in methadone maintained patients. J Addict Dis. 1998;17(3):75–89. doi: 10.1300/J069v17n03_07. [DOI] [PubMed] [Google Scholar]
- 8.Rosen D, Smith ML, Reynolds CF., III The prevalence of mental and physical health disorders among older methadone patients. Am J Geriatr Psychiatry. 2008;16(6):488–497. doi: 10.1097/JGP.0b013e31816ff35a. [DOI] [PubMed] [Google Scholar]
- 9.Shah NG, Celentano DD, Vlahov D, et al. Correlates of enrollment in methadone maintenance treatment programs differ by HIV-serostatus. AIDS. 2000;14(13):2035–2043. doi: 10.1097/00002030-200009080-00020. [DOI] [PubMed] [Google Scholar]
- 10.Wu E, El-Bassel N, Gilbert L, et al. Sociodemographic disparities in supplemental service utilization among male methadone patients. J Subst Abuse Treat. 2004;26(3):197–202. doi: 10.1016/S0740-5472(03)00246-0. [DOI] [PubMed] [Google Scholar]
- 11.McLellan AT, Ball JC, Rosen L, et al. Pretreatment source of income and response to methadone maintenance: a follow-up study. Am J Psychiatry. 1981;138(6):785–789. doi: 10.1176/ajp.138.6.785. [DOI] [PubMed] [Google Scholar]
- 12.Al-Tayyib AA, Koester S. Injection drug users’ experience with and attitudes toward methadone clinics in Denver, CO. J Subst Abuse Treat. 2011;41(1):30–36. doi: 10.1016/j.jsat.2011.01.009. [DOI] [PubMed] [Google Scholar]
- 13.Banta-Green CJ, Maynard C, Koepsell TD, et al. Retention in methadone maintenance drug treatment for prescription-type opioid primary users compared to heroin users. Addiction. 2009;104(5):775–783. doi: 10.1111/j.1360-0443.2009.02538.x. [DOI] [PubMed] [Google Scholar]
- 14.Substance Abuse and Mental Health Services Administration, Center for Behavioral Health Statistics and Quality. The N-SSATS Report: Trends in the Use of Methadone and Buprenorphine at Substance Abuse Treatment Facilities: 2003 to 2011. Rockville, MD: Apr 23, 2013. [PubMed] [Google Scholar]
- 15.McLellan AT, Arndt IO, Metzger DS, et al. The effects of psychosocial services in substance abuse treatment. JAMA. 1993;269(15):1953–1959. [PubMed] [Google Scholar]
- 16.Woody GE, McLellan AT, Luborsky L, et al. Psychotherapy in community methadone programs: a validation study. Am J Psychiatry. 1995;152(9):1302–1308. doi: 10.1176/ajp.152.9.1302. [DOI] [PubMed] [Google Scholar]
- 17.Umbricht-Schneiter A, Ginn DH, Pabst KM, et al. Providing medical care to methadone clinic patients: referral vs on-site care. Am J Public Health. 1994;84(2):207–210. doi: 10.2105/ajph.84.2.207. [DOI] [PMC free article] [PubMed] [Google Scholar]
- 18.Muga R, Langohr K, Tor J, et al. Survival of HIV-infected injection drug users (IDUs) in the highly active antiretroviral therapy era, relative to sex- and age-specific survival of HIV-uninfected IDUs. Clin Infect Dis. 2007;45(3):370–376. doi: 10.1086/519385. [DOI] [PubMed] [Google Scholar]
- 19.Stein MR, Soloway IJ, Jefferson KS, et al. Concurrent group treatment for hepatitis C: implementation and outcomes in a methadone maintenance treatment program. J Subst Abuse Treat. 2012;43(4):424–432. doi: 10.1016/j.jsat.2012.08.007. [DOI] [PMC free article] [PubMed] [Google Scholar]
- 20.Brooner RK, Kidorf MS, King VL, et al. Managing psychiatric comorbidity within versus outside of methadone treatment settings: a randomized and controlled evaluation. Addiction. 2013;108(11):1942–1951. doi: 10.1111/add.12269. [DOI] [PMC free article] [PubMed] [Google Scholar]
- 21.Amato L, Minozzi S, Davoli M, et al. Psychosocial combined with agonist maintenance treatments versus agonist maintenance treatments alone for treatment of opioid dependence. Cochrane Database Syst Rev. 2004;4 doi: 10.1002/14651858.CD004147.pub2. CD004147. [DOI] [PubMed] [Google Scholar]
- 22.Federman AD, Arnsten JH. Primary care affiliations of adults in a methadone program with onsite care. J Addict Dis. 2007;26(1):27–34. doi: 10.1300/J069v26n01_04. [DOI] [PubMed] [Google Scholar]
- 23.Stein MD, Friedmann P. Need for medical and psychosocial services among injection drug users: a comparative study of needle exchange and methadone maintenance. Am J Addict. 2002;11(4):262–270. doi: 10.1080/10550490290088063. [DOI] [PubMed] [Google Scholar]
- 24.Center for Substance Abuse Treatment. Treatment Improvement Protocol (TIP) Series 43. HHS Publication No (SMA) 12-4214. Rockville, MD: Substance Abuse and Mental Health Services Administration; 2005. Medication-Assisted Treatment for Opioid Addiction in Opioid Treatment Programs. [PubMed] [Google Scholar]
- 25.Certification of Opioid Treatment Programs. 42 Code of Federal Regulations, Part 8. 2007 Oct 1; [Google Scholar]
- 26.United States Department of Health and Human Services.Substance Abuse and Mental Health Services Administration.Center for Behavioral Health Statistics and Quality. Inter-university Consortium for Political and Social Research (ICPSR) [distributor] 2013. National Survey of Substance Abuse Treatment Services (N-SSATS), 2011. [Google Scholar]
- 27.Substance Abuse and Mental Health Services Administration. Data on Substance Abuse Treatment Facilities, BHSIS Series: S-64, HHS Publication No (SMA) 12-4730. Rockville, MD: Substance Abuse and Mental Health Services Administration; 2012. National Survey of Substance Abuse Treatment Services (N-SSATS): 2011. [Google Scholar]
- 28.Tempalski B, Flom PL, Friedman SR, et al. Social and political factors predicting the presence of syringe exchange programs in 96 US metropolitan areas. Am J Public Health. 2007;97(3):437–447. doi: 10.2105/AJPH.2005.065961. [DOI] [PMC free article] [PubMed] [Google Scholar]
- 29.Berkman ND, Wechsberg WM. Access to treatment-related and support services in methadone treatment programs. J Subst Abuse Treat. 2007;32(1):97–104. doi: 10.1016/j.jsat.2006.07.004. [DOI] [PubMed] [Google Scholar]
- 30.Richter KP, Choi WS, McCool RM, et al. Smoking cessation services in U.S. methadone maintenance facilities. Psychiatr Serv. 2004;55(11):1258–1264. doi: 10.1176/appi.ps.55.11.1258. [DOI] [PubMed] [Google Scholar]
- 31.Wells R, Lemak CH, D’Aunno TA. Insights from a national survey into why substance abuse treatment units add prevention and outreach services. Subst Abuse Treat Prev Policy. 2006;1:21, 21. doi: 10.1186/1747-597X-1-21. [DOI] [PMC free article] [PubMed] [Google Scholar]
- 32.Fleishman JA, Yehia BR, Moore RD, et al. The economic burden of late entry into medical care for patients with HIV infection. Med Care. 2010;48(12):1071–1079. doi: 10.1097/MLR.0b013e3181f81c4a. [DOI] [PMC free article] [PubMed] [Google Scholar]
- 33.Tuite AR, Jayaraman GC, Allen VG, et al. Estimation of the burden of disease and costs of genital Chlamydia trachomatis infection in Canada. Sex Transm Dis. 2012;39(4):260–267. doi: 10.1097/OLQ.0b013e31824717ae. [DOI] [PubMed] [Google Scholar]
- 34.Chadborn TR, Delpech VC, Sabin CA, et al. The late diagnosis and consequent short-term mortality of HIV-infected heterosexuals (England and Wales, 2000-2004) AIDS. 2006;20(18):2371–2379. doi: 10.1097/QAD.0b013e32801138f7. [DOI] [PubMed] [Google Scholar]
- 35.Rein DB, Wittenborn JS, Weinbaum CM, et al. Forecasting the morbidity and mortality associated with prevalent cases of pre-cirrhotic chronic hepatitis C in the United States. Dig Liver Dis. 2011;43(1):66–72. doi: 10.1016/j.dld.2010.05.006. [DOI] [PubMed] [Google Scholar]
- 36.Marks G, Crepaz N, Senterfitt JW, et al. Meta-analysis of high-risk sexual behavior in persons aware and unaware they are infected with HIV in the United States: implications for HIV prevention programs. J Acquir Immune Defic Syndr. 2005;39(4):446–453. doi: 10.1097/01.qai.0000151079.33935.79. [DOI] [PubMed] [Google Scholar]
- 37.Higgins DL, Galavotti C, O’Reilly KR, et al. Evidence for the effects of HIV antibody counseling and testing on risk behaviors. JAMA. 1991;266(17):2419–2429. [PubMed] [Google Scholar]
- 38.Schonfeld WH, Verboncoeur CJ, Fifer SK, et al. The functioning and well-being of patients with unrecognized anxiety disorders and major depressive disorder. J Affect Disord. 1997;43(2):105–119. doi: 10.1016/s0165-0327(96)01416-4. [DOI] [PubMed] [Google Scholar]
- 39.Cacciola JS, Alterman AI, Rutherford MJ, et al. The relationship of psychiatric comorbidity to treatment outcomes in methadone maintained patients. Drug Alcohol Depend. 2001;61(3):271–280. doi: 10.1016/s0376-8716(00)00148-4. [DOI] [PubMed] [Google Scholar]
- 40.Ayanian JZ, Weissman JS, Schneider EC, et al. Unmet health needs of uninsured adults in the United States. JAMA. 2000;284(16):2061–2069. doi: 10.1001/jama.284.16.2061. [DOI] [PubMed] [Google Scholar]
- 41.National Health Index. Hepatitis C Index: The Surveillance Monitor for Hepatitis C. National Minority Quality Forum 2011 [Google Scholar]
- 42.United States Department of Health and Human Services.Substance Abuse and Mental Health Services Administration.Center for Behavioral Health Statistics and Quality. Treatment Episode Data Set -- Admissions (TEDS-A), 2010. Inter-university Consortium for Political and Social Research (ICPSR) [distributor] 2012 Jul 17; [Google Scholar]
- 43.Area Resource File (AHRF). 2011-2012. US Department of Health and Human Services, Health Resources and Services Administration, Bureau of Health Professions; Rockville, MD: 2012. [Google Scholar]
- 44.The Kaiser Family Foundation’s State Health Facts. Data Source: National Alliance of State and Territorial AIDS Directors (NASTAD), Special Data Request, 2013. 2013 [Google Scholar]
- 45.LexisNexis Academic. State Regulations and Administrative Codes. Dayton, OH: 2012. [Google Scholar]
- 46.University of Wisconsin Population Health Institute. County health rankings and roadmaps. Madison, WI: University of Wisconsin; 2012. [Google Scholar]
- 47.Substance Abuse and Mental Health Services Administration, Center for Behavioral Health Statistics and Quality. The NSDUH Report: Substance Use Disorders in Substate Regions: 2008 to 2010. Rockville, MD: Sep 18, 2012. [Google Scholar]
- 48.The Kaiser Family Foundation’s State Health Facts. Data Source: National Association of State Mental Health Program Directors Research Institute, Inc (NRI) The Henry J. Kaiser Family Foundation; [11/20/2012]. 2012. http://www.nriinc.org/projects/Profiles/Prior_RE.cfm. [Google Scholar]
- 49.Kaiser Commission on Medicaid and the Uninsured. Holding steady, looking ahead: Annual findings of a 50-state survey of eligibility rules, enrollment and renewal procedures, and cost sharing practices in Medicaid and CHIP, 2010-2011. The Henry J. Kaiser Family Foundation; 2011. [Google Scholar]
- 50.U.S.Census Bureau. 2008-2010 American Community Survey 3-year estimates. 2011 [Google Scholar]
- 51.The Urban Institute. GuideStar-NCCS National Nonprofit Research Database (2010) 2012 [Google Scholar]
- 52.Rinaldo D. 50-State Table: Medicaid Financing of Medication-Assisted Treatment for Opiate Addiction. National Conference of State Legislatures; Apr 1, 2008. [Google Scholar]
- 53.Rowe G, Murphy M, Mon EY. Welfare Rules Databook: State TANF Policies as of July 2009. The Urban Institute; 2010. [Google Scholar]
Associated Data
This section collects any data citations, data availability statements, or supplementary materials included in this article.
Supplementary Materials
Offering of comprehensive services by ownership for freestanding opioid treatment programs, after adjusting for local factors.
Offering of comprehensive services by ownership of opioid treatment programs that accept Medicaid, after adjusting for local factors.
Offering of comprehensive services by ownership of opioid treatment programs receiving government grant funding, after adjusting for local factors.