Summary
Given the success in engineering synthetic phenotypes in microbes and mammalian cells, constructing non-native pathways in mammals has become increasingly attractive for understanding and identifying potential targets for treating metabolic disorders. Here we introduced the glyoxylate shunt into mouse liver to investigate mammalian fatty acid metabolism. Mice expressing the shunt showed resistance to diet-induced obesity on a high fat diet despite similar food consumption. This was accompanied by a decrease in total fat mass, circulating leptin levels, plasma triglyceride concentration, and a signaling metabolite in liver, malonyl-CoA, that inhibits fatty acid degradation. Contrary to plants and bacteria, in which the glyoxylate shunt prevents the complete oxidation of fatty acids, this pathway when introduced in mice increases fatty acid oxidation such that resistance to diet-induced obesity develops. This work suggests that using non-native pathways in higher organisms to explore and modulate metabolism may be a useful approach.
Introduction
The obesity epidemic is widespread in developed countries and is associated with the constellation of clinical problems known as the metabolic syndrome: insulin resistance, diabetes, cardiovascular disease, dyslipidemia, and fatty liver (Kahn et al., 2006; Van Gaal et al., 2006). Elevated levels of plasma free fatty acids are a risk factor for the development of type 2 diabetes (Paolisso et al., 1995) and are a biochemical hallmark of obesity. Fatty acids are used as an energy source in skeletal muscle and liver, and their use is tightly controlled by several factors including availability in the diet, de novo biosynthesis, glucose levels, and gluconeogenesis. Fatty acid and triglyceride biosynthesis is associated with high glucose concentrations and glycolytic rates while fatty acid degradation generally occurs during periods of glucose starvation. Regulation of fatty acid biosynthesis and degradation ensures that glucose is oxidized preferentially before fatty acids in hepatocytes.
Under normal circumstances the liver stores very little lipid because hepatic lipogenesis is balanced with fatty acid degradation. Fatty acid biosynthesis begins with transport of citrate from the mitochondria to the cytosol where it is converted to oxaloacetate (OAA) and acetyl-CoA by citrate lyase (ACLY). The carboxylation of acetyl-CoA to malonyl-CoA by acetyl-CoA carboxylase (ACC) represents the first committed step in fatty acid biosynthesis. Hepatic fatty acids have two fates. They may be incorporated into triglycerides, which are packaged into very low density lipoproteins and secreted into the blood to deliver lipids to other tissues. Alternatively, fatty acids are degraded via beta-oxidation to generate reducing power and energy. Hepatic fatty acid degradation is regulated by the cytosolic metabolites citrate and malonyl-CoA. The former is an allosteric activator of ACC (Saha et al., 1999) and the latter is a potent inhibitor of carnitine palmitoyltransferse-1a (CPT1A) (McGarry and Brown, 1997), which mediates the transport of fatty acids into mitochondria for beta-oxidation. High rates of fatty acid beta-oxidation are linked to a decrease in malonyl-CoA levels and an increase in AMP-activated protein kinase (AMPK) mediated ACC covalent inactivation (Kudo et al., 1995). The product of beta-oxidation, acetyl-CoA, enters the TCA cycle.
Whereas adipose tissue is specialized to store lipids, excess triglyceride storage in the liver is a pathologic condition. In obesity, for example, the delivery of fatty acids liberated from adipocytes to the liver may outpace the capacity of hepatocytes for fatty acid oxidation, leading to triglyceride accumulation. This, in turn, promotes the development of non-alcoholic fatty liver disease, which is the most common cause of liver disease and occurs in 20–40% of obese subjects (Browning and Horton, 2004; Farrell and Larter, 2006; Torres and Harrison, 2008; Youssef and McCullough, 2002). This suggests that increased hepatic fatty acid oxidation may have a favorable effect on co-morbidities associated with obesity.
In this study, we exploit a metabolic pathway that is present in plants and bacteria, but not normally found in mammals, to perturb the balance of energy homeostasis and attempt to gain further insight into fatty acid oxidation in the liver. Since mammals do not have this shunt, its effect on liver metabolism cannot be predicted. In fact, opposite possibilities exist depending on the local context and cellular regulation. Remarkably, we found that human hepatocytes expressing the glyoxylate shunt have increased fatty acid oxidation, and mice expressing this shunt in the liver were resistant to diet-induced obesity. These effects were attributed to the decreased malonyl CoA level and an additional oxidation pathway formed through the shunt and cytosolic malic enzyme (ME1) and phosphoenolpyruvate carboxykinase (PEPCK). Therefore, we demonstrate the potential benefit of using a non-native pathway to deliver a synthetic phenotype and identify potential targets for therapy.
Results
Possible Outcomes of Hepatic Glyoxylate Shunt Expression
The glyoxylate shunt, isocitrate lyase (aceA) and malate synthase (aceB), is a two-enzyme pathway that allows the cell to conserve carbon by bypassing the oxidative CO2 producing reactions of the TCA cycle. This carbon conservation allows bacteria and plants to use fatty acids as a gluconeogenic substrate and avoid the complete oxidation of fatty acids to CO2. Regulation in plants and bacteria ensures that glyoxylate shunt expression is repressed in the presence of glucose and activated during growth on fatty acids.
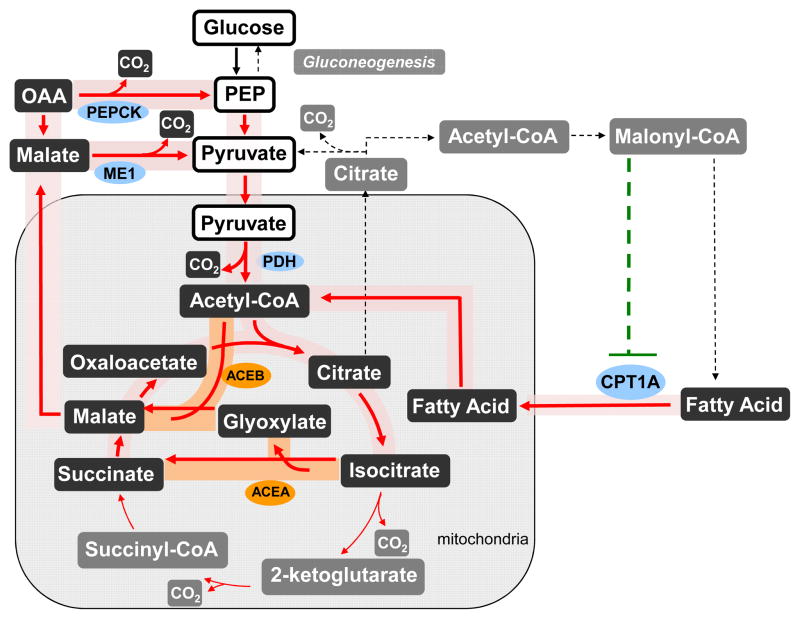
Since mammals do not have the glyoxylate shunt, the result of its activity on mammalian energy metabolism is unknown. We hypothesized at least three possible net outcomes of the conservation of carbon metabolites that would occur by activating this pathway (Fig. 1): i) four-carbon gluconeogenic substrates would be generated and used for gluconeogenesis, similar to plants and bacteria; ii) the four-carbon TCA cycle intermediated would be converted to citrate which would be exported from mitochondria and converted into malonyl-CoA, which reduces fatty acid degradation; or iii) the conserved carbon metabolite would be oxidized through either cytosolic malic enzyme (ME1) or phosphoenolpyruvate carboxykinase (PEPCK) and pyruvate dehydrogenase (PDH) complex (Additional Details in Supplementary Methods). The first two possibilities are direct consequences of carbon saving due to bypassing the decarboxylation part of the TCA cycle. Thus, these two possibilities lead to either no change or decreased fatty acid oxidation and a possible increase in cell mass. On the other hand, the third possibility essentially provides an additional pathway for complete fatty acid oxidation to CO2. This route avoids malonyl CoA build-up and provides a favorable regulatory state for fatty acid oxidation. Among these possibilities, the cellular regulation in mammals will ultimately determine the outcome of this non-natural perturbation.
Figure 1. Hepatic Glyoxyate Shunt Expression Yields Multiple Possibilities With Distinct Phenotypes.
Red lines represent the metabolic cycle for complete acetyl-CoA oxidation including the glyoxylate shunt enzymes, which are shaded orange. This pathway is expected to increase fatty acid degradation by decreasing malonyl-CoA levels. The gray dashed lines represent alternative pathways, which include acetyl-CoA incorporation into oxaloacetate for gluconeogenesis and malonyl-CoA for lipid biosynthesis, as well as the part of TCA cycle that is bypassed. The dashed green line represents allosteric inhibition. Abbreviations: PDH: pyruvate dehydrogenase, CPT1a: carnitine palmitoyltransferse-1a, PEPCK: phosphoenolpyruvate carboxykinase, ME1: cytosolic malic enzyme.
HepG2 Hepatocytes Expressing the Glyoxyate Shunt have Increased Fatty Acid Degradation
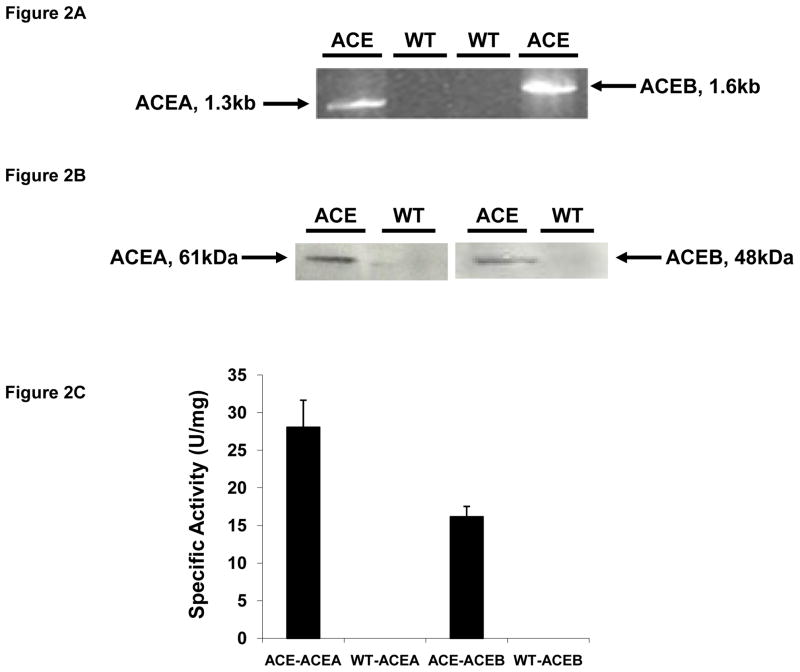
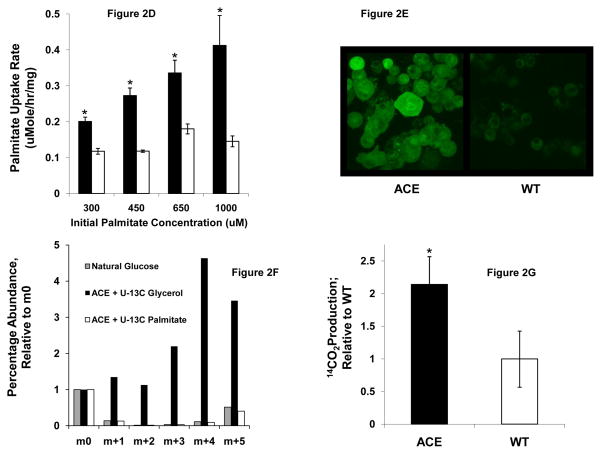
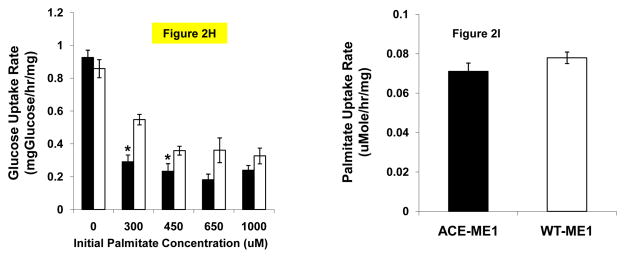
To investigate these possibilities, we first constructed a stably transfected human HepG2 hepatocyte cell line constitutively expressing the glyoxylate shunt genes, aceA and aceB, from E. coli (designated ACE) (Figs 2A,B,C). We found that ACE cells exhibited higher palmitate uptake rates than WT cells, and this phenotype persisted across a broad range of physiological fatty acid levels up to 1 mM palmitate (Fig. 2D). Here WT refers to the HepG2 cell line stably transfected with an empty vector pBudCE4.1. A stable cell line expressing lacZ was also generated and found to have the same palmitate uptake rate as the WT cell line (data not shown). This phenotype was also demonstrated using a fluorescence-based uptake assay (Liao et al., 2005) employing fluorescently labeled dodecanoic acid bound to bovine plasma albumin (Fig 2E). Interestingly, palmitate taken up by ACE cells is not used for gluconeogensis, as evidenced by the lack of 13C-labeled glucose generated from [U-13C] palmitate (Fig 2F), even though gluconeogenesis was functional in ACE cells (Fig 2F,S1). Rather, ACE cells were found to oxidize more than twice as much [U-14C] palmitate to 14CO2 than WT (Fig 2G). Taken together, these results demonstrate that ACE cells have increased overall fatty acid oxidation compared to WT cells. In addition, we found that ACE cells consumed less glucose (Fig 2H) and produced less lactate (Fig S2) than WT cells over a range of palmitate concentrations. In the absence of palmitate ACE and WT cells consumed identical amounts of glucose (Fig 2H).
Figure 2. Human HepG2 Hepatocytes Expressing the Glyoxyate Shunt Have Increased Fatty Acid Degradation.
(A) Reverse transcriptase PCR products from ACE cells (lanes 1 and 4) and WT cell lines (lanes 2 and 3) were run on a 1% agarose gel. The sizes of the ACEA (1.3 kb) and ACEB (1.6kb) mRNA are shown (lanes 1 and 4 respectively).
(B) Western blot analysis of protein extracts from ACE (lanes 1 and 3) and WT (lanes 2 and 4) cells indicating the 61 kDa ACEA and the 48 kDa ACEB proteins.
(C) Enzyme assay shows that the glyoxylate shunt was active in ACE cells.
(D) Fatty acid uptake rate over a range of palmitate concentrations for both ACE (closed squares ■) and WT (open squares □). *p < 0.05 compared to corresponding WT control; Mean ± SEM; n = 3–6
(E) Fatty acid uptake assay using fluorescently labeled dodecanoic acid confirms that the ACE cells take up fatty acids more rapidly than WT. Image is representative of two experiments.
(F) Gluconeogenesis was assessed by measuring [U-13C] glycerol and [U-13C] palmitate incorporation into glucose. The glucose pentacetate derivative containing glucose carbons 2–6 was analyzed with GC-MS. ACE cells incorporate [U-13C] glycerol into glucose, as evidenced by the increased 13C enrichment in glucose.
(G) [U-14C] palmitate was used to measure palmitate oxidation to CO2. WT was used a normalization basis. *p < 0.05 compared to corresponding WT control; Mean ± SEM; n = 3
(H) Glucose uptake over a range of palmitate concentrations for both ACE (closed squares ■) and WT (open squares □). ACE cells consume less glucose than WT cells. *p < 0.05 compared to corresponding WT control. Mean ± SEM; n = 3–6
(I) Palmitate uptake for ACE ME1 knockdown (ACE-ME1-KD) and WT ME1 knockdown (WT-ME1-KD). ME1 KD results in ACE and WT cells consuming identical amounts of palmitate. Mean ± SEM; n = 6
ME1 Expression is Necessary for ACE Phenotype
The glyoxylate shunt may create an additional cycle for oxidizing acetyl-CoA (Fig 1) through either ME1 (Liao et al., 1996) or PEPCK and our results suggest that cells may use the shunt in this manner to increase fatty acid degradation in the presence of glucose. Since the cell culture metabolic studies were performed in high glucose media we expect ME1, a lipogenic enzyme (Stefos et al., 2009), to be the predominant pathway for recycling TCA intermediates to pyruvate and allowing for complete oxidation of fatty acids. According to this hypothesis, the flux through ME1 is necessary for the increased fatty acid degradation in ACE cells. To test this hypothesis, we used siRNA to knockdown ME1 in both ACE and WT cells. Knockdown of ME1 resulted in ACE and WT cells consuming identical amounts of palmitate (Fig 2I, Fig S3), abolishing the increased fatty acid degradation observed in ACE cells and supporting our conclusion that ME1 and the glyoxylate shunt created an additional pathway for acetyl-CoA oxidation.
ACE Cells Exhibit Post-translational and Transcriptional Changes Consistent with Metabolic Phenotype
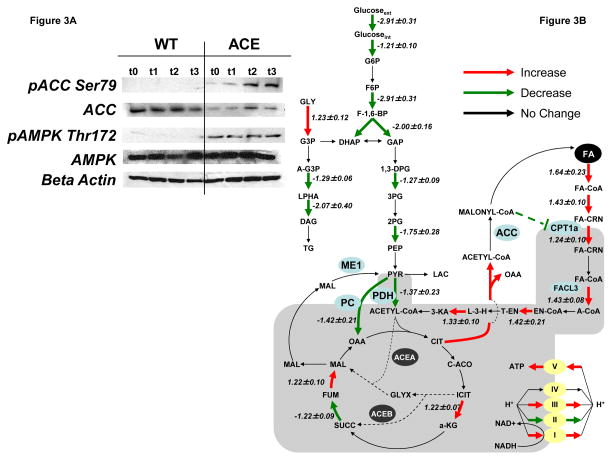
We also investigated the effect of the glyoxylate shunt on signal transduction pathways. In particular, phosphorylated AMPK, designated pAMPK Thr172, was significantly increased in ACE cells compared to WT (Fig. 3A), despite similar AMPK protein (Fig. 3A) and mRNA levels. Activated phosphorylated AMPK can inactivate ACC by phosphorylation on serine 79 (Park et al., 2002), leading to decreased malonyl-CoA production and decreased CPT1A inhibition. Examination of the levels of active and inactive (designated pACC Ser79) forms of ACC revealed that the active form was lower in ACE than in WT cells and the inactive form was higher in ACE cells (Fig. 3A). These results suggest that the association between the phosphorylated levels of AMPK and ACC play a role in allowing ACE cells to metabolize fatty acid at a higher rate than WT. Taken together, these signal transduction responses are consistent with the observed ACE metabolic phenotype.
Figure 3. Post-translational and Gene Expression Changes in ACE Cells are Consistent With Increased Fatty Acid Degradation.
(A) Western blot analysis of WT (left panel) and ACE (right panel) cell lines. ACE and WT cells were given DMEM supplemented with 300uM palmitate and protein was harvested at various time points over 24 hours. Blots are representative of two experiments.
(B) Metabolic networks related to glucose and fatty acid metabolism. Microarray analysis showing relative (fold change) gene expression levels in the genes involved in glycolysis, fatty acid beta-oxidation, and triglyceride synthesis from ACE and WT cell lines. Positive numbers indicated that the ACE cell line had higher expression levels than WT and are indicated by red arrows. Negative numbers indicate that the ACE cell line had lower expression levels and are indicated by green arrows. Data are represented as Mean ± SEM, n = 2. Dashed green line represents allosteric regulation: malonyl-CoA inhibits CPT1a. Abbreviations are listed in Table S1. Key enzymes are shown in blue circles: malic enzyme (ME1), pyruvate dehydrogenase (PDH), pyruvate carboxylase (PC), acetyl-CoA carboxylase (ACC), and carnitine palmitoyltransferse-1a (CPT1A).
In addition to signal transduction and metabolic adaptations, microarray analysis showed that ACE cells had a gene expression profile that was consistent with the observed metabolic phenotype (Fig. 3B, Tables S1–5). In particular, CTP1A, which facilitates the transport of fatty acids from the cytoplasm to the mitochondria, and fatty acid-CoA ligase (FACL3), an enzyme involved in beta-oxidation, were found to have a higher expression level in ACE cells compared to WT. In addition, genes involved in TG production were found to have markedly lower expression levels in ACE cells compared to WT. Consistent with the decreased glucose consumption observed, ACE cells showed lower expression of genes from glycolysis. Furthermore, micorarray analysis showed that uncoupling protein 2 (UCP2) mRNA levels were higher in ACE cells than WT (2.38±0.52) (Tables S1–5).
Mice Expressing the Glyoxylate Shunt Resist Diet-Induced Obesity
To determine the effect of liver specific glyoxylate shunt expression on whole-animal metabolism we injected male and female C57BL/6 mice into the tail vein with vectors containing either aceA and aceB (designated ACE) or lacZ under control of a liver specific promoter and monitored them for 6 weeks (Experiment 1, Fig S4). Male and female mice were injected at 20 grams (6 to 7 weeks of age) and placed on a standard chow diet (LFD, 13.2% calories from fat, 4.07kcal/g) or a high fat diet (HFD, 60% calories from fat, 5.24kcal/g) for 6 weeks. Plasma alanine aminotransferse (ALT) levels, a marker for hepatocellular damage, were normal for both male and female ACE and lacZ injected mice (Fig S5). Body weight was measured weekly for 6 weeks. Four weeks post-injection mice were fasted overnight and blood was drawn retro-orbitally. Six weeks post injection body composition was analyzed by nuclear magnetic resonance (NMR), after which mice were sacrificed and tissues were collected.
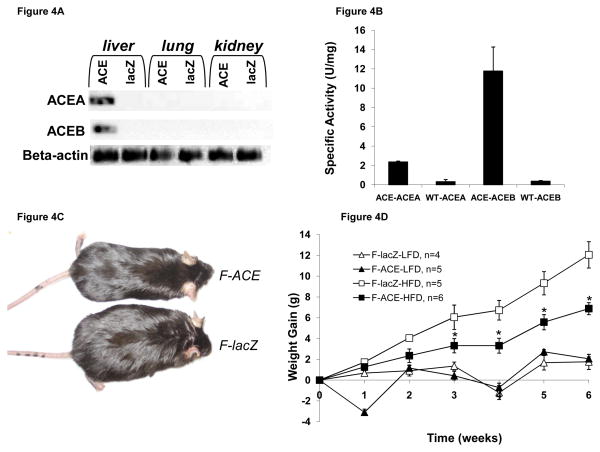
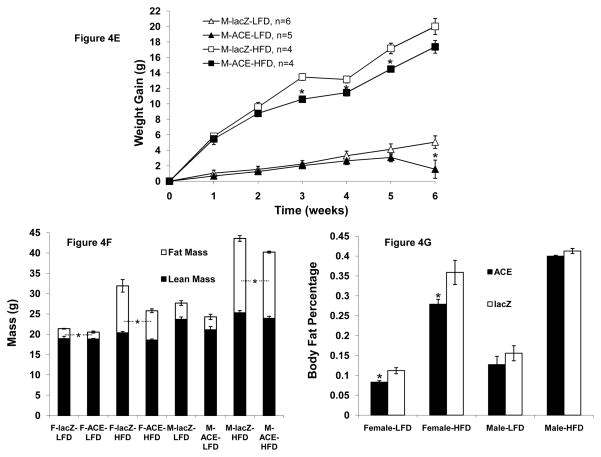
Reverse-transcriptase PCR from liver, lung, and kidney shows that glyoxylate shunt expression was specific to liver (Fig 4A), active as determined by enzyme assay (Fig 4B), and maintained for the duration of diet experiments. We found that both male and female ACE mice gained less weight on a HFD than mice injected with lacZ (Figs 4C,D,E) and this resistance to diet-induced obesity was significant after 3 weeks. We found that female ACE mice weighed 5.2g less than lacZ-injected mice after six weeks on a HFD (Figs. 4C,D), and male ACE mice weighed 2.6g less than the lacZ-injected mice (Fig. 4E). Conversely, the glyoxylate shunt has little effect on mice fed a LFD. Female (Fig. 4D) and male (Fig. 4E) ACE mice were found to gain similar or slightly less weight over the course of 6 weeks on a LFD compared to the lacZ injected mice.
Figure 4. Mice Expressing the Glyoxyate Shunt in the Liver Resist Diet-Induced Obesity and Accumulate Less Fat Mass on a High Fat Diet.
(A) aceA and aceB were present exclusively in liver tissue as determined by reverse-transcriptase PCR at the end of diet experiments.
(B) The glyoxylate shunt was functional in ACE mice, as determined by enzyme assay.
(C) Female ACE and lacZ injected mice after 6 weeks on HFD. Female ACE mice gain less weight than lacZ injected mice.
(D) Weight gain over six weeks for LFD and HFD for female mice. *p < 0.05 compared to corresponding lacZ injected mouse on same diet; Mean ± SEM; n = 4–6
(E) Weight gain over six weeks for LFD and HFD for male mice. *p < 0.05 compared to corresponding lacZ injected mouse on same diet; Mean ± SEM; n = 4–6
(F) Body composition as assessed at the conclusion of diet experiments using NMR. Female ACE mice have decreased total fat mass after 6 weeks on both LFD and HFD. *p < 0.05 for ACE fat mass compared to lacZ injected mouse fat mass. Mean ± SEM; n = 4–6
(G) Body fat percentage for ACE and lacZ injected mice. Female ACE mice have decreased body fat percentage. *p < 0.05 compared to corresponding lacZ injected mouse on same diet; Mean ± SEM; n = 4–6
ACE Mice Have Decreased Total Body Fat
We also found that glyoxylate shunt expression led to significant changes in body composition in female mice. Female ACE mice were found to have 28% body fat and lacZ injected mice 36% after 6 weeks on HFD (Figs 4F,G). In addition, fat mass was reduced in female ACE mice by more than 4g, accounting for over 80% of the weight difference between ACE and lacZ injected mice (Fig 4F). On LFD, female ACE mice were found to have 8% body fat and lacZ injected mice 11% (Fig 4F,G) even though there was not a significant difference in body weight. Although male ACE mice gained less weight on both HFD and LFD than lacZ injected mice, there was not a significant difference in body fat percentage (Fig 4G). However, male ACE mice on HFD gained significantly less fat mass than lacZ injected mice (Fig 4F).
Female ACE Mice Accumulate Less Visceral Fat and Have Decreased Circulating Leptin Levels
Our results indicate that the glyoxylate shunt exerts a greater effect on female mice than male mice even though female and male mice displayed similar levels of aceA and aceB gene expression (Fig S6). This is may be related to the inherent sexually dimorphic properties of fatty acid metabolism (Jalouli et al., 2003; Luxon and Weisiger, 1993; Sheorain et al., 1979) and may be partially attributed to hormonal differences. Because of the more dramatic phenotype seen in female mice on HFD we chose to study this group in more detail. Female mice were injected at 7 weeks of age as described above and then placed on a HFD. Two weeks post-injection mice were analyzed in metabolic cages to assess the effects of glyoxylate shunt expression on energy expenditure, respiratory exchange ratio, and activity. Six weeks after injection, blood and tissues were collected for analysis (Experiment 2, Fig S7).
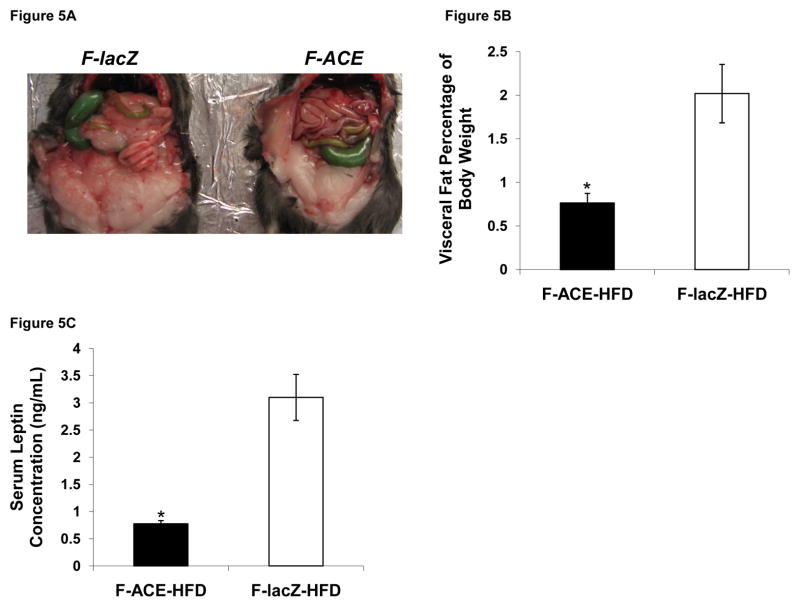
Visceral fat, adipose tissue stored in the intra-abdominal area, is associated with type 2 diabetes and atherosclerosis (Tran et al., 2008). After dissection of the animals we found significantly smaller visceral fat pads in female ACE mice (Fig 5A). We also found that a smaller percentage of body weight is attributed to visceral fat in female ACE mice compared to lacZ injected mice (Fig 5B). Consistent with this result, female ACE mice had decreased circulating levels of the adipokine leptin (Fig 5C).
Figure 5. Female ACE Mice Have Smaller Visceral Fat Pads and Decreased Circulating Leptin.
(A) Female ACE mice accumulated less intra-abdominal fat pads compared to lacZ injected mice.
(B) Visceral fat mass expressed as percent body weight for female mice on HFD. *p < 0.05; Mean ± SEM; n = 4
(C) Female ACE mice showed lower circulating plasma leptin concentrations as determined by ELISA. *p < 0.05; Mean ± SEM; n = 3–4
Female ACE Mice Have Decreased Liver Malonyl-CoA and ATP Levels
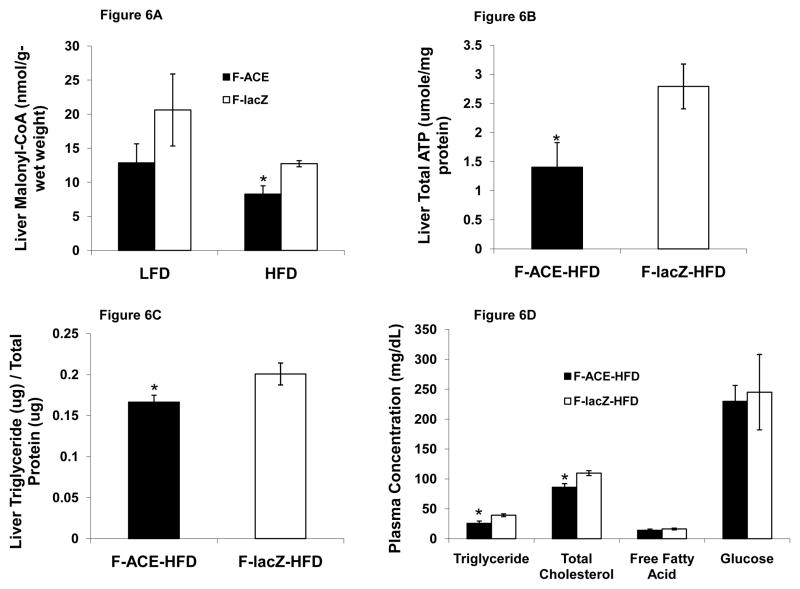
As demonstrated, the glyoxylate shunt may create an alternate cycle for acetyl-CoA oxidation (Fig 1). The key feature of this pathway is that it avoids malonyl-CoA production and is expected to increase fatty acid degradation. We found that female ACE mice had decreased liver malonyl-CoA levels compared to lacZ injected mice on HFD (Fig 6A). This indicates that female ACE mice may resist diet-induced obesity in part due to decreased liver malonyl-CoA and therefore decreased CPT1a inhibition. On LFD, female ACE mice were found to have decreased liver malonyl-CoA, although the difference was not significant. The glyoxylate shunt bypasses isocitrate dehydrogenase, 2-oxoglutarate dehydrogenase, and succinyl-CoA ligase, enzymes producing reducing equivalents and ATP. We found decreased liver ATP levels (Fig 6B) in female ACE mice compared to lacZ injected mice, indicating that the glyoxylate shunt functions to bypass the oxidative portion of the TCA cycle. This result may also explain the observed AMPK activation (Fig 3A) in our hepatocyte culture model.
Figure 6. The Glyoxylate Shunt Decreases Liver Malonyl-CoA and Triglyceride Levels.
(A) Female ACE mice on HFD had lower liver malonyl-CoA levels on HFD. ACE mice may resist diet-induced obesity in part due to decreased liver malonyl-CoA and therefore decreased CPT1a inhibition. *P < 0.05 compared to corresponding lacZ injected mouse on same diet; Mean ± SEM; n = 3–4
(B) Glyoxyate shunt expression led to decreased total ATP levels in the liver, presumably due to bypassing the oxidative portion of the TCA cycle. *p < 0.05; Mean ± SEM; n = 4
(C) Female ACE mice had decreased liver TG content. *P < 0.05; Mean ± SEM; n = 4
(D) Plasma analysis of metabolites for female ACE and lacZ injected mice on HFD. Mice were fasted overnight before blood was collected. ACE mice had decreased triglyceride and total cholesterol levels. Fasting glucose levels were identical, suggesting that the glyoxyate shunt does not serve a gluconeogenic function in the liver. *p < 0.05; Mean ± SEM; n = 4–6
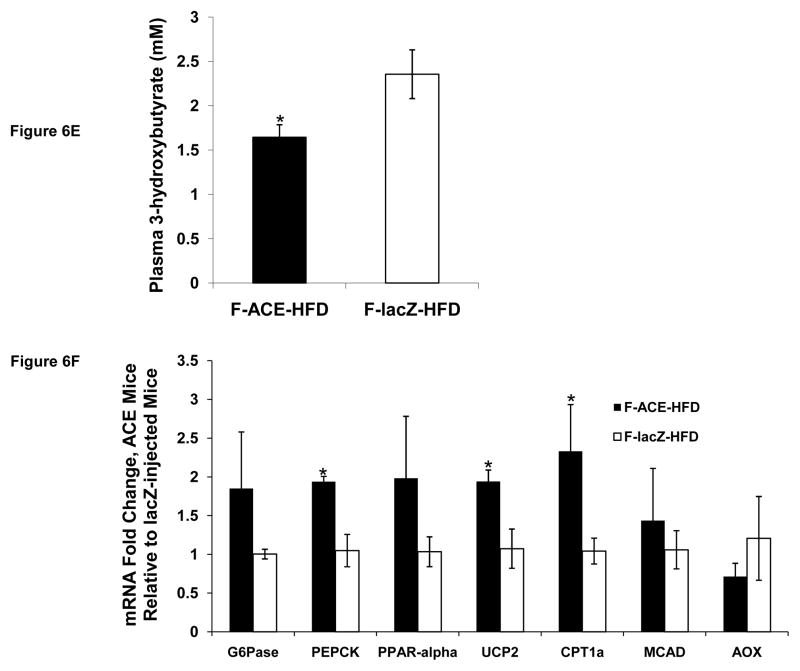
(E) Plasma concentrations of ketone body 3-hydroxybutyrate in female ACE and lacZ injected mice on HFD after overnight fast. *p < 0.05; Mean ± SEM; n = 3.
(F) Quantitative RT-PCR analysis of female ACE and lacZ injected mice on HFD. Mice were fasted overnight and tissues were collected. ACE mice have increased mRNA levels of UCP2 and CPT1a, indicative of increased fatty acid oxidation. Additionally, ACE mice had increased PEPCK expression, suggesting that the glyoxylate shunt and PEPCK form a cycle for acetyl-CoA oxidation in vivo. *p < 0.05; Mean ± SEM; n = 3–4.
Abbreviations: G6Pase: glucose-6-phosphatase, PEPCK: phosphoenolpyruvate carboxykinase, PPAR-alpha: peroxisome proliferator-activated receptor alpha, UCP2: mitochondrial uncoupling protein 2, CPT1a: carnitine palmitoyltransferse-1a, MCAD: medium-chain acyl-CoA dehydrogenase, AOX: acyl-CoA oxidase.
Female ACE Mice Have Decreased Liver and Plasma Trigylceride Levels
Hepatic TG accumulation, often associated with insulin resistance (Yki-Jarvinen, 2005), was found to be slightly lower in female ACE mice as determined by liver TG content (Fig 6C). Analysis of plasma revealed that female mice expressing the glyoxylate shunt have different metabolite profiles than those expressing lacZ (Fig 6D). Female ACE mice were found to have lower triglyceride plasma concentrations than lacZ injected mice after 4 weeks on a HFD (Fig 6D). Female ACE mice on a HFD were also found to have decreased plasma total cholesterol concentrations than lacZ injected mice (Fig 6D). Since acetyl-CoA is the precursor for hepatic cholesterol biosynthesis, the glyoxylate shunt may lower cholesterol levels by providing an alternate acetyl-CoA consuming pathway. We did not find a difference in free fatty acid or glucose levels (Fig 6D). Female ACE mice were found to have lower plasma concentrations of the ketone body 3-hydroxybutyrate (Fig 6E). Ketogenesis is typically proportional to fatty acid oxidation rates (Beylot, 1996) and mitochondrial acetyl-CoA levels. ACE mice may have lower circulating ketone body levels despite increased hepatic fatty acid oxidation due to glyoxylate shunt consumption of acetyl-CoA, the ketone body precursor substrate. We found no difference in plasma insulin levels (Fig S8).
Female ACE Mice Have Increased CPT1a and PEPCK Gene Expression
We next examined the effect of glyoxylate shunt expression on mRNA levels of enzymes from the fatty acid degradation and gluconeogenic pathways. Female ACE mice were found to have increased expression of UCP2 and CPT1a (Fig 6F), congruous with our cell culture microarray analysis. While these results indicate increased hepatic fatty acid oxidation in ACE mice, we found no difference in the mRNA levels of glucose-6-phosphatase (Fig 6F), an enzyme catalyzing the final step in gluconeogensis. This result coupled with the finding that ACE and lacZ injected mice have identical fasting plasma glucose concentrations (Fig 6D) further supports our conclusion that the glyoxylate shunt does not function as a gluconeogenic pathway in hepatocytes.
Female ACE mice were also found to have increased PEPCK mRNA levels (Fig 6F). This suggests that a cycle through PEPCK and the glyoxylate shunt for complete acetyl-CoA oxidation to CO2 is functional in vivo (Fig 1). This is in contrast to our cell culture model, where ME1 was implicated in a similar cycle (Fig 2I). A possible explanation for this difference is that mice were subjected to an overnight fast before tissue collection, a state that has been shown to increase PEPCK expression (Granner and Pilkis, 1990; Patsouris et al., 2004).
Glyoxyate Shunt Expression Does Not Affect Food Intake
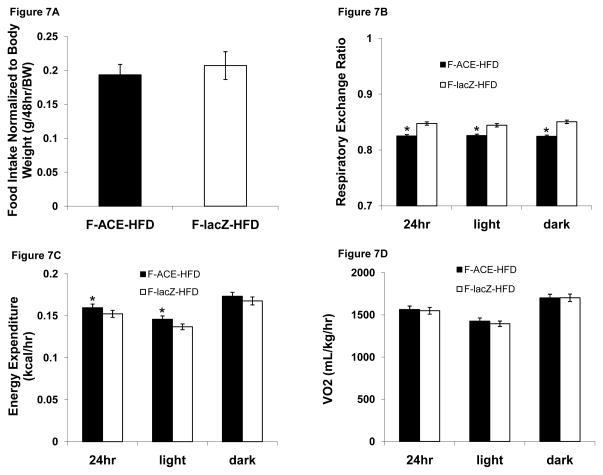
Metabolic cages were used to assess the effect of the glyoxylate shunt on basal oxygen consumption, feeding, and activity. Female ACE and lacZ mice two-week post injection on a HFD displayed similar total food intake normalized for body weight (Fig 7A), demonstrating that the lower body weight of ACE mice is not due to decreased food consumption.
Figure 7. ACE Mice Have Decreased RER and Increased Energy Expenditure.
(A) ACE and lacZ injected mice consumed the same amount of food normalized to body weight. n=7–8
(B) ACE mice had decreased RER during light, dark and total 24-hour period, suggesting increased fat oxidation. *p < 0.05 compared to corresponding lacZ injected mouse during same period; Mean ± SEM; n = 7–8.
(C) ACE mice demonstrated increased energy expenditure, which may partially explain decreased weight gain observed in ACE mice. *p < 0.05 compared to corresponding lacZ injected mouse during same period; Mean ± SEM; n = 7–8.
(D) ACE and lacZ injected mice had similar oxygen consumption levels. Mean ± SEM; n = 7–8.
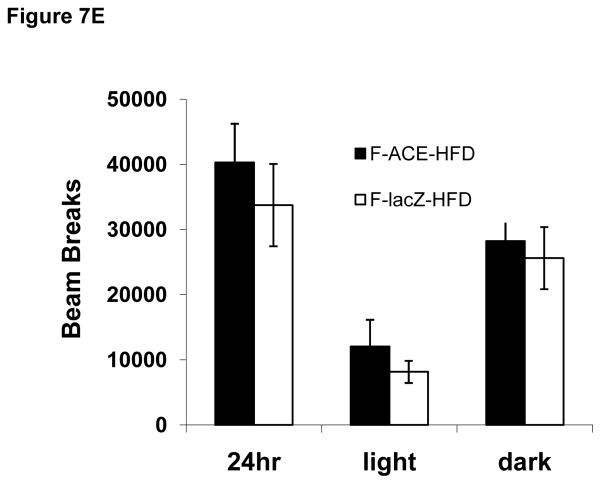
(E) ACE and lacZ injected mice had similar levels of activity. Mean ± SEM; n = 7–8.
Female ACE Mice Have Decreased Respiratory Exchange Ratio
Respiratory exchange ratio (RER), a ratio of carbon dioxide production to oxygen consumption and an indicator of relative total body carbohydrate and fatty acid oxidation, was slightly lower in ACE mice during both the dark and light cycles as well as over the entire 24 hour period (Fig 7B) of analysis. An RER of 1.00 corresponds to “pure” carbohydrate oxidation (100% of total O2 consumed by metabolism of carbohydrate, 0% from fat), while an RER of 0.70 represents “pure” fatty acid oxidation (100% of total O2 consumed by metabolism of fat, 0% from carbohydrate). Thus, the decreased RER in ACE mice is indicative of increased total body fatty acid oxidation. This result may partially explain the decreased fat and hepatic TG accumulation in ACE mice (Figs 4E,F, 6C). Female ACE mice also had a small increase in energy expenditure during the light cycle and over the entire 24 hour period (Fig 7C). ACE and lacZ injected mice displayed similar oxygen consumption (Fig 7D) and ambulatory activity (Fig 7E).
Discussion
Non-native pathways have been used to engineer novel biological functions and complex dynamics in both microbial (Atsumi et al., 2008; Elowitz and Leibler, 2000; Fung et al., 2005; Gardner et al., 2000; Kobayashi et al., 2004) and mammalian (Deans et al., 2007; Kramer et al., 2004; Tigges et al., 2009; Weber et al., 2006) systems. This strategy offers new opportunities for studying metabolic networks and, when applied to mammals, whole body metabolism. To investigate fatty acid metabolism and identify potential targets for treating obesity we introduced a non-native pathway, the glyoxylate shunt from E. coli, into mouse liver. Here we report that expression of this pathway ameliorates many of the metabolic parameters associated with obesity by increasing fatty acid degradation and decreasing total fat mass accumulation.
Since mammals do not normally have the glyoxylate shunt its affect on lipid metabolism was unknown. We hypothesized that expression could lead to increased or decreased fatty acid degradation based on how the cell adapted to these enzymes. In addition, hepatocytes could also use the pathway for gluconeogenesis, similar to how plants and bacteria use the shunt. We first tested the effect of glyoxylate shunt expression in HepG2 hepatocytes and found that expression led to increased fatty acid degradation compared to WT cells (Figs 2D,E,G). Furthermore, knocking down ME1 abolished the increased fatty acid uptake observed in ACE cells (Fig 2I). These results suggest that hepatocytes adapted to the non-native pathway by creating an alternate cycle through aceA, aceB, and ME1 for complete acetyl-CoA oxidation to CO2 and that the glyoxylate shunt functions differently in hepatocytes than plants and bacteria, where it is used to conserve carbon.
We next investigated the effect of the glyoxylate shunt on whole body metabolism by tail vein injecting vectors containing aceA and aceB into mice. ACE mice gained less weight after 6 weeks on a HFD than lacZ injected mice (Figs 4C–E), and this was accompanied with a decrease in fat mass accumulation (Figs 4F–G). We also found that the majority of the weight difference between ACE and lacZ injected female mice was due to fat mass (Fig 4F). Female ACE mice accumulated less visceral fat than lacZ injected mice (Figs 5A–B) and this resulted in decreased circulating leptin levels (Fig 5C). These results demonstrate that the glyoxylate shunt effectively alters whole body lipid metabolism.
Since the glyoxylate shunt exerted such a significant effect on lipid homeostasis, we investigated the intracellular levels of key metabolites to further understand the underlying mechanism of decreased fat storage in ACE mice. We found that ACE mice had decreased levels of plasma triglycerides (Fig 6D), likely a consequence of increased fatty acid oxidation and decreased adipose accumulation. Additionally, ACE mice were found to have decreased plasma cholesterol levels (Fig 6D). Since acetyl-CoA is a precursor for cholesterol biosynthesis, the glyoxylate shunt may decrease cholesterol levels by providing an additional acetyl-CoA consuming pathway. Alternatively, the glyoxylate shunt may decrease the available TG for VLDL and lead to apoB destabilization, negatively affecting cholesterol plasma concentrations. Although glyoxylate shunt activity relative to other pathways was not assessed, we found that the enzyme activity generated by tail vein injection was sufficient to perturb whole body adipose accumulation and plasma lipid concentrations.
Consistent with our hypothesis that the glyoxylate shunt creates an alternate cycle for acetyl-CoA oxidation through the shunt and either PEPCK or ME1 and diverts citrate transport out of the mitochondria, we found that female ACE mice had lower malonyl-CoA levels, a fatty acid beta-oxidation inhibitor, on a HFD than lacZ injected mice (Fig 6A). Individual metabolites have previously been found to regulate whole-body metabolic profiles (An et al., 2004). Decreasing hepatic malonyl-CoA levels by overexpressing malonyl-CoA decarboxylase, a cytosolic enzyme catalyzing the conversion of malonyl-CoA to acetyl-CoA, reverses insulin resistance (An et al., 2004). Here we find that decreasing malonyl-CoA levels via the glyoxyate shunt reduces whole body adiposity. Total liver ATP levels were also markedly lower in ACE mice (Fig 6B). This may be attributed to the shunt bypassing the oxidative portion of the TCA cycle and the possibility that the NADH produced by cytosolic malate dehydrogenase (Fig 1) was oxidized in producing lactate rather than shuttling back into mitochondria. However, other unknown mechanisms may exist for decreasing the cell’s capacity for oxidative phosphorylation. This decrease in ATP may explain the observed AMPK activation in ACE cells (Fig 3A). Activated AMPK responds to low energy states by activating ATP producing pathways and inhibiting energy consuming pathways such as fatty acid biosynthesis (Long and Zierath, 2006). This suggests that despite increased fatty acid oxidation, ACE cells generate less energy per fatty acid oxidized than WT. This energy dissipation is similar to the mechanism by which uncoupling proteins regulate the whole body energy balance. Uncoupling proteins decrease metabolic efficiency by dissipating the proton gradient in the mitochondria, causing energy created from metabolism to be released as heat. Mice overexpressing UCP in skeletal tissue resist diet-induced obesity (Li et al., 2000) and have improved insulin sensitivity. Moreover, liver specific UCP1 expression leads to increased energy expenditure and decreased liver triglyceride content (Ishigaki et al., 2005). So, similar to uncoupling proteins, the glyoxylate shunt may alter the energy state of the cell in part by decreasing the energy produced from fatty acid oxidation.
To further characterize the female ACE phenotype we assessed energy expenditure and whole body substrate oxidation using metabolic cages. Although ACE mice gained less weight over the course of 6 weeks on a HFD, we found no difference in food intake between ACE and lacZ injected mice (Fig 7A). Instead, we found ACE mice had a decreased RER compared to lacZ injected mice (Fig 7B), indicative of increased fatty acid oxidation. This shows that ACE mice gain less weight on a HFD because of increased fat oxidation and not because of energy intake. This also demonstrates that the glyoxyate exerts its effect on whole body metabolism peripherally and not through modulation of satiety sensations. ACE mice had increased energy expenditure during the total 24 hour and light period (Fig 7C) of analysis, indicating that ACE mice weigh less than lacZ injected mice, despite similar food intake, in part because of increased energy expenditure.
Multiple mouse models exhibiting resistance to diet-induced obesity have been documented(Abu-Elheiga et al., 2003; Elchebly et al., 1999; Li et al., 2000; Phan et al., 2004; Vergnes et al., 2006; Zigman et al., 2005; Ziouzenkova et al., 2007). Here we demonstrate such a model generated by expression of the glyoxylate shunt from E. coli. Mice expressing this pathway had decreased liver malonyl-CoA and ATP levels and a significant decrease in percentage body fat. Bacteria and plants use the glyoxyate shunt to conserve carbon by bypassing the decarboxylation steps of the TCA cycle, allowing glucose production from fatty acids. In contrast, we found the shunt functioned differently in mammals by increasing fatty acid oxidation. This work suggests that using non-native metabolic pathways to understand and explore mammalian metabolism may be a useful approach. Finally, since ACE mice only partially resist diet-induced obesity our model may have advantages for studying non-severe forms of obesity.
Experimental Procedures
Additional method details can be found in supplementary material.
Plasmid Construction
Isocitrate lyase (aceA) and malate synthase (aceB) were cloned from E. coli genomic DNA and fused with a mitochondria leader sequence. Genes were cloned into pBudCE4.1 (Invitrogen) (designated pBudaceAB) and stably transfected into human hepatoma cell line HepG2. Genes aceA and aceB were cloned separately from pBudaceAB into pLIVE vector (Mirus Bio, Madison, WI).
Cell Culture
Human hepatoma cell line, HepG2 (American Type Culture Collection) was maintained in DMEM supplemented with 10% heat-inactivated FBS and 50ug/mL penicillin, 50ug/mL streptomycin, and 100ug/mL neomycin at 37°C in a humidified atmosphere containing 5% CO2. Cells were transfected in 60mm plates with pBudaceAB or pBudCE4.1 with Lipofectamine 2000 (Invitrogen, Carlsbard, CA) according to manufacturer’s protocols. Colonies were selected with DMEM supplemented with 320ug/mL Zeocin (Invitrogen, Carlsbard, CA). Enzyme assays were performed as described elsewhere (Chell et al., 1978; Sundaram et al., 1980).
Metabolite Analysis
Metabolites were quantified using high performance liquid chromatography (HPLC) on an Agilent 1100 model (Agilent Technologies, Palo Alto, CA) consisting of a binary pump, autosampler, and degasser connected to an organic acid Aminex HPX-87H column (300x7.8mm, Bio-Rad). Glucose was converted to pentacetate derivative for GC-MS analysis (Tserng and Kalhan, 1983). Fatty acid uptake assays were performed as previously documented (Liao et al., 2005). Production of 14CO2 was measured as previously described (Harwood et al., 2003) using [U-14C] palmitate. Plasma metabolite concentrations were determined as described elsewhere (Castellani et al., 2008). Liver TG content was measured using a triglyceride determination kit (Wako Diagnostics, Richmond, VA). Malonyl-CoA was measured using [1-14C] acetyl CoA and purified fatty acid synthase according to the method of McGarry (McGarry et al., 1978). ATP measurement using a bioluminescence based assay has been described elsewhere (Evans et al., 2008). 3-hydroxybutyrate was measured using an Autokit 3-HB (Wako Diagnostics, Richmond, VA).
siRNA ME1 Knockdown
Malic enzyme 1 (ME1) knockdown was performed using a RNAi Human Starter Kit (Qiagen, Valencia, CA) by transfecting the following siRNA duplex: r(GAA CAA AUU CUC AAA GAU A)d(TT). Quantitative RT-PCR was performed using SYBR Green chemistry and Smart Cycler (Cephied, Sunnyvale, CA) and fold changes were calculated using ΔΔCt method (Livak and Schmittgen, 2001) with beta-actin as an endogenous control. Transfection of a non-silencing fluorescent siRNA had no effect on phenotype.
Microarray Analysis
Our data was submitted to the NCBI Gene Expression Omnibus in MIAME format with access number GSE5903. The data can be accessed at: http://www.ncbi.nlm.nih.gov/geo/query/acc.cgi?token=tzqrpeciomgaqzy&acc=GSE5903 Isolated total RNA samples were processed using HGU-133A_2 arrays as recommended by Affymetrix, Inc. (Affymetrix GeneChip® Expression Analysis Technical Manual, Affymetrix, Inc., Santa Clara, CA). The results were quantified and analyzed using GCOS 1.2 software (Affymetrix, Inc.) using default values. Expression fold changes were calculated using dChip software (Zhong et al., 2003) and results were filtered using a 90% confidence bound of fold change. Expression changes were verified using RT-PCR (Table S5).
Western Blot
Western blot was performed using standard techniques. For time course experiments, ACE and WT cells were given DMEM supplemented with 300uM palmitate and protein was harvested at various time points over 24 hours. Primary antibody incubation was overnight at 1:1000 dilution at 4°C and secondary antibody incubation was at 1:10000 dilution for 1hour at room temperature. Antibodies were from Invitrogen and Cell Signaling (Danvers, MA).
Animal Experiments
All animal procedures and care were per an institutional ARC approved protocol. Male and female C57BL/6 mice (Taconic, Hudson, NY) were housed in cages of 1–4 at 22–24°C with a 12 hour light/dark cycle with food and water provided ad libitum. Genes aceA and aceB were cloned separately from pBudaceAB into pLIVE vector (Mirus Bio, Madison, WI) and tail vein injected (Alino et al., 2003; Bates et al., 2006; Huang et al., 2006) when mice were 6/7 weeks of age. At six-seven weeks of age mice were injected with either ACEAB or LACZ and placed on a low fat chow or high fat diet.
Quantitative RT-PCR
Total RNA was isolated female ACE and lacZ mouse liver after over night fast using RNeasy-plus columns (Qiagen, Valencia, CA). First strand cDNA was synthesized using Superscript III Reverse Transcriptase (Invitrogen, Carlsbad, CA). Quantitative RT-PCR was performed using SYBR Green chemistry, Quantitect Primer Assays (Qiagen, Valencia, CA), and Smart Cycler (Cephied, Sunnyvale, CA) and fold changes were calculated using ΔΔCt method (Livak and Schmittgen, 2001) with beta-actin as an endogenous control.
Fat Pad and Leptin Analysis
Visceral fat pads from female ACE and lacZ mice were removed and weighed after 6 weeks on a HFD. Blood was drawn after an overnight fast and leptin was measured using ELISA (Crystal Chem, Downers Grove, IL).
Metabolic Cages
Animals were housed individually in a series of eight, airtight chambers designed to assess the metabolic activity of mice over three 12 hr light/12 hr dark cycles (Oxymax, Columbus Instruments, OH). Animals were acclimated to the chambers over the first 48 hours and data was collected over the subsequent 24 hours. The mice had free access to water and powdered food presented from a food hopper attached to a scale. The rate of oxygen consumption (VO2) and carbon dioxide production (VCO2) were calculated and averaged over the entire final 24 hour period as well as for the light and dark cycle for each mouse. Energy Expenditure (EE) was calculated as previously described (Bohlooly et al., 2005) using the equation where VO2 is the volume of oxygen consumed per hour normalized to body weight and RER represents VCO2/VO2.
Supplementary Material
Footnotes
Publisher's Disclaimer: This is a PDF file of an unedited manuscript that has been accepted for publication. As a service to our customers we are providing this early version of the manuscript. The manuscript will undergo copyediting, typesetting, and review of the resulting proof before it is published in its final citable form. Please note that during the production process errors may be discovered which could affect the content, and all legal disclaimers that apply to the journal pertain.
References
- Abu-Elheiga L, Oh W, Kordari P, Wakil SJ. Acetyl-CoA carboxylase 2 mutant mice are protected against obesity and diabetes induced by high-fat/high-carbohydrate diets. Proc Natl Acad Sci U S A. 2003;100:10207–10212. doi: 10.1073/pnas.1733877100. [DOI] [PMC free article] [PubMed] [Google Scholar]
- Alino SF, Crespo A, Dasi F. Long-term therapeutic levels of human alpha-1 antitrypsin in plasma after hydrodynamic injection of nonviral DNA. Gene Ther. 2003;10:1672–1679. doi: 10.1038/sj.gt.3302065. [DOI] [PubMed] [Google Scholar]
- An J, Muoio DM, Shiota M, Fujimoto Y, Cline GW, Shulman GI, Koves TR, Stevens R, Millington D, Newgard CB. Hepatic expression of malonyl-CoA decarboxylase reverses muscle, liver and whole-animal insulin resistance. Nat Med. 2004;10:268–274. doi: 10.1038/nm995. [DOI] [PubMed] [Google Scholar]
- Atsumi S, Hanai T, Liao JC. Non-fermentative pathways for synthesis of branched-chain higher alcohols as biofuels. Nature. 2008;451:86–89. doi: 10.1038/nature06450. [DOI] [PubMed] [Google Scholar]
- Bates MK, Zhang G, Sebestyen MG, Neal ZC, Wolff JA, Herweijer H. Genetic immunization for antibody generation in research animals by intravenous delivery of plasmid DNA. Biotechniques. 2006;40:199–208. doi: 10.2144/000112088. [DOI] [PubMed] [Google Scholar]
- Beylot M. Regulation of in vivo ketogenesis: role of free fatty acids and control by epinephrine, thyroid hormones, insulin and glucagon. Diabetes Metab. 1996;22:299–304. [PubMed] [Google Scholar]
- Bohlooly YM, Olsson B, Bruder CE, Linden D, Sjogren K, Bjursell M, Egecioglu E, Svensson L, Brodin P, Waterton JC, et al. Growth hormone overexpression in the central nervous system results in hyperphagia-induced obesity associated with insulin resistance and dyslipidemia. Diabetes. 2005;54:51–62. doi: 10.2337/diabetes.54.1.51. [DOI] [PubMed] [Google Scholar]
- Browning JD, Horton JD. Molecular mediators of hepatic steatosis and liver injury. J Clin Invest. 2004;114:147–152. doi: 10.1172/JCI22422. [DOI] [PMC free article] [PubMed] [Google Scholar]
- Castellani LW, Nguyen CN, Charugundla S, Weinstein MM, Doan CX, Blaner WS, Wongsiriroj N, Lusis AJ. Apolipoprotein AII is a regulator of very low density lipoprotein metabolism and insulin resistance. J Biol Chem. 2008;283:11633–11644. doi: 10.1074/jbc.M708995200. [DOI] [PMC free article] [PubMed] [Google Scholar]
- Chell RM, Sundaram TK, Wilkinson AE. Isolation and characterization of isocitrate lyase from a thermophilic Bacillus sp. The Biochemical journal. 1978;173:165–177. doi: 10.1042/bj1730165. [DOI] [PMC free article] [PubMed] [Google Scholar]
- Deans TL, Cantor CR, Collins JJ. A tunable genetic switch based on RNAi and repressor proteins for regulating gene expression in mammalian cells. Cell. 2007;130:363–372. doi: 10.1016/j.cell.2007.05.045. [DOI] [PubMed] [Google Scholar]
- Elchebly M, Payette P, Michaliszyn E, Cromlish W, Collins S, Loy AL, Normandin D, Cheng A, Himms-Hagen J, Chan CC, et al. Increased insulin sensitivity and obesity resistance in mice lacking the protein tyrosine phosphatase-1B gene. Science. 1999;283:1544–1548. doi: 10.1126/science.283.5407.1544. [DOI] [PubMed] [Google Scholar]
- Elowitz MB, Leibler S. A synthetic oscillatory network of transcriptional regulators. Nature. 2000;403:335–338. doi: 10.1038/35002125. [DOI] [PubMed] [Google Scholar]
- Evans ZP, Ellett JD, Schmidt MG, Schnellmann RG, Chavin KD. Mitochondrial uncoupling protein-2 mediates steatotic liver injury following ischemia/reperfusion. J Biol Chem. 2008;283:8573–8579. doi: 10.1074/jbc.M706784200. [DOI] [PMC free article] [PubMed] [Google Scholar]
- Farrell GC, Larter CZ. Nonalcoholic fatty liver disease: from steatosis to cirrhosis. Hepatology. 2006;43:S99–S112. doi: 10.1002/hep.20973. [DOI] [PubMed] [Google Scholar]
- Fung E, Wong WW, Suen JK, Bulter T, Lee SG, Liao JC. A synthetic gene-metabolic oscillator. Nature. 2005;435:118–122. doi: 10.1038/nature03508. [DOI] [PubMed] [Google Scholar]
- Gardner TS, Cantor CR, Collins JJ. Construction of a genetic toggle switch in Escherichia coli. Nature. 2000;403:339–342. doi: 10.1038/35002131. [DOI] [PubMed] [Google Scholar]
- Granner D, Pilkis S. The genes of hepatic glucose metabolism. J Biol Chem. 1990;265:10173–10176. [PubMed] [Google Scholar]
- Harwood HJ, Jr, Petras SF, Shelly LD, Zaccaro LM, Perry DA, Makowski MR, Hargrove DM, Martin KA, Tracey WR, Chapman JG, et al. Isozyme-nonselective N-substituted bipiperidylcarboxamide acetyl-CoA carboxylase inhibitors reduce tissue malonyl-CoA concentrations, inhibit fatty acid synthesis, and increase fatty acid oxidation in cultured cells and in experimental animals. J Biol Chem. 2003;278:37099–37111. doi: 10.1074/jbc.M304481200. [DOI] [PubMed] [Google Scholar]
- Huang LR, Wu HL, Chen PJ, Chen DS. An immunocompetent mouse model for the tolerance of human chronic hepatitis B virus infection. Proc Natl Acad Sci U S A. 2006;103:17862–17867. doi: 10.1073/pnas.0608578103. [DOI] [PMC free article] [PubMed] [Google Scholar]
- Ishigaki Y, Katagiri H, Yamada T, Ogihara T, Imai J, Uno K, Hasegawa Y, Gao J, Ishihara H, Shimosegawa T, et al. Dissipating excess energy stored in the liver is a potential treatment strategy for diabetes associated with obesity. Diabetes. 2005;54:322–332. doi: 10.2337/diabetes.54.2.322. [DOI] [PubMed] [Google Scholar]
- Jalouli M, Carlsson L, Ameen C, Linden D, Ljungberg A, Michalik L, Eden S, Wahli W, Oscarsson J. Sex difference in hepatic peroxisome proliferator-activated receptor alpha expression: influence of pituitary and gonadal hormones. Endocrinology. 2003;144:101–109. doi: 10.1210/en.2002-220630. [DOI] [PubMed] [Google Scholar]
- Kahn SE, Hull RL, Utzschneider KM. Mechanisms linking obesity to insulin resistance and type 2 diabetes. Nature. 2006;444:840–846. doi: 10.1038/nature05482. [DOI] [PubMed] [Google Scholar]
- Kobayashi H, Kaern M, Araki M, Chung K, Gardner TS, Cantor CR, Collins JJ. Programmable cells: interfacing natural and engineered gene networks. Proc Natl Acad Sci U S A. 2004;101:8414–8419. doi: 10.1073/pnas.0402940101. [DOI] [PMC free article] [PubMed] [Google Scholar]
- Kramer BP, Viretta AU, Daoud-El-Baba M, Aubel D, Weber W, Fussenegger M. An engineered epigenetic transgene switch in mammalian cells. Nat Biotechnol. 2004;22:867–870. doi: 10.1038/nbt980. [DOI] [PubMed] [Google Scholar]
- Kudo N, Barr AJ, Barr RL, Desai S, Lopaschuk GD. High rates of fatty acid oxidation during reperfusion of ischemic hearts are associated with a decrease in malonyl-CoA levels due to an increase in 5′-AMP-activated protein kinase inhibition of acetyl-CoA carboxylase. J Biol Chem. 1995;270:17513–17520. doi: 10.1074/jbc.270.29.17513. [DOI] [PubMed] [Google Scholar]
- Li B, Nolte LA, Ju JS, Han DH, Coleman T, Holloszy JO, Semenkovich CF. Skeletal muscle respiratory uncoupling prevents diet-induced obesity and insulin resistance in mice. Nat Med. 2000;6:1115–1120. doi: 10.1038/80450. [DOI] [PubMed] [Google Scholar]
- Liao J, Sportsman R, Harris J, Stahl A. Real-time quantification of fatty acid uptake using a novel fluorescence assay. J Lipid Res. 2005;46:597–602. doi: 10.1194/jlr.D400023-JLR200. [DOI] [PubMed] [Google Scholar]
- Liao JC, Hou SY, Chao Y. Pathway Analysis, Engineering, and Physiological Considerations for Redirecting Central Metabolism. Biotechnology and Bioengineering. 1996;52:129–140. doi: 10.1002/(SICI)1097-0290(19961005)52:1<129::AID-BIT13>3.0.CO;2-J. [DOI] [PubMed] [Google Scholar]
- Livak KJ, Schmittgen TD. Analysis of relative gene expression data using real-time quantitative PCR and the 2(−Delta Delta C(T)) Method. Methods (San Diego, Calif) 2001;25:402–408. doi: 10.1006/meth.2001.1262. [DOI] [PubMed] [Google Scholar]
- Long YC, Zierath JR. AMP-activated protein kinase signaling in metabolic regulation. J Clin Invest. 2006;116:1776–1783. doi: 10.1172/JCI29044. [DOI] [PMC free article] [PubMed] [Google Scholar]
- Luxon BA, Weisiger RA. Sex differences in intracellular fatty acid transport: role of cytoplasmic binding proteins. Am J Physiol. 1993;265:G831–841. doi: 10.1152/ajpgi.1993.265.5.G831. [DOI] [PubMed] [Google Scholar]
- McGarry JD, Brown NF. The mitochondrial carnitine palmitoyltransferase system. From concept to molecular analysis. Eur J Biochem. 1997;244:1–14. doi: 10.1111/j.1432-1033.1997.00001.x. [DOI] [PubMed] [Google Scholar]
- McGarry JD, Stark MJ, Foster DW. Hepatic malonyl-CoA levels of fed, fasted and diabetic rats as measured using a simple radioisotopic assay. J Biol Chem. 1978;253:8291–8293. [PubMed] [Google Scholar]
- Paolisso G, Tataranni PA, Foley JE, Bogardus C, Howard BV, Ravussin E. A high concentration of fasting plasma non-esterified fatty acids is a risk factor for the development of NIDDM. Diabetologia. 1995;38:1213–1217. doi: 10.1007/BF00422371. [DOI] [PubMed] [Google Scholar]
- Park SH, Gammon SR, Knippers JD, Paulsen SR, Rubink DS, Winder WW. Phosphorylation-activity relationships of AMPK and acetyl-CoA carboxylase in muscle. J Appl Physiol. 2002;92:2475–2482. doi: 10.1152/japplphysiol.00071.2002. [DOI] [PubMed] [Google Scholar]
- Patsouris D, Mandard S, Voshol PJ, Escher P, Tan NS, Havekes LM, Koenig W, Marz W, Tafuri S, Wahli W, et al. PPARalpha governs glycerol metabolism. J Clin Invest. 2004;114:94–103. doi: 10.1172/JCI20468. [DOI] [PMC free article] [PubMed] [Google Scholar]
- Phan J, Peterfy M, Reue K. Lipin expression preceding peroxisome proliferator-activated receptor-gamma is critical for adipogenesis in vivo and in vitro. J Biol Chem. 2004;279:29558–29564. doi: 10.1074/jbc.M403506200. [DOI] [PubMed] [Google Scholar]
- Saha AK, Laybutt DR, Dean D, Vavvas D, Sebokova E, Ellis B, Klimes I, Kraegen EW, Shafrir E, Ruderman NB. Cytosolic citrate and malonyl-CoA regulation in rat muscle in vivo. Am J Physiol. 1999;276:E1030–1037. doi: 10.1152/ajpendo.1999.276.6.E1030. [DOI] [PubMed] [Google Scholar]
- Sheorain VS, Mattock MB, Subrahmanyam D. Sex-dependence in triglyceride metabolism in response to dietary carbohydrates. Experientia. 1979;35:162–163. doi: 10.1007/BF01920587. [DOI] [PubMed] [Google Scholar]
- Stefos GC, Becker W, Lampidonis AD, Rogdakis E. Cloning and functional characterization of the ovine malic enzyme promoter. Gene. 2009;428:36–40. doi: 10.1016/j.gene.2008.09.027. [DOI] [PubMed] [Google Scholar]
- Sundaram TK, Chell RM, Wilkinson AE. Monomeric malate synthase from a thermophilic Bacillus. Molecular and kinetic characteristics. Archives of biochemistry and biophysics. 1980;199:515–525. doi: 10.1016/0003-9861(80)90309-4. [DOI] [PubMed] [Google Scholar]
- Tigges M, Marquez-Lago TT, Stelling J, Fussenegger M. A tunable synthetic mammalian oscillator. Nature. 2009;457:309–312. doi: 10.1038/nature07616. [DOI] [PubMed] [Google Scholar]
- Torres DM, Harrison SA. Diagnosis and therapy of nonalcoholic steatohepatitis. Gastroenterology. 2008;134:1682–1698. doi: 10.1053/j.gastro.2008.02.077. [DOI] [PubMed] [Google Scholar]
- Tran TT, Yamamoto Y, Gesta S, Kahn CR. Beneficial effects of subcutaneous fat transplantation on metabolism. Cell Metab. 2008;7:410–420. doi: 10.1016/j.cmet.2008.04.004. [DOI] [PMC free article] [PubMed] [Google Scholar]
- Tserng KY, Kalhan SC. Calculation of substrate turnover rate in stable isotope tracer studies. Am J Physiol. 1983;245:E308–311. doi: 10.1152/ajpendo.1983.245.3.E308. [DOI] [PubMed] [Google Scholar]
- Van Gaal LF, Mertens IL, De Block CE. Mechanisms linking obesity with cardiovascular disease. Nature. 2006;444:875–880. doi: 10.1038/nature05487. [DOI] [PubMed] [Google Scholar]
- Vergnes L, Beigneux AP, Davis R, Watkins SM, Young SG, Reue K. Agpat6 deficiency causes subdermal lipodystrophy and resistance to obesity. J Lipid Res. 2006;47:745–754. doi: 10.1194/jlr.M500553-JLR200. [DOI] [PMC free article] [PubMed] [Google Scholar]
- Weber W, Link N, Fussenegger M. A genetic redox sensor for mammalian cells. Metab Eng. 2006;8:273–280. doi: 10.1016/j.ymben.2005.12.004. [DOI] [PubMed] [Google Scholar]
- Yki-Jarvinen H. Fat in the liver and insulin resistance. Ann Med. 2005;37:347–356. doi: 10.1080/07853890510037383. [DOI] [PubMed] [Google Scholar]
- Youssef WI, McCullough AJ. Steatohepatitis in obese individuals. Best Pract Res Clin Gastroenterol. 2002;16:733–747. doi: 10.1053/bega.2002.0334. [DOI] [PubMed] [Google Scholar]
- Zhong S, Li C, Wong WH. ChipInfo: Software for extracting gene annotation and gene ontology information for microarray analysis. Nucleic Acids Res. 2003;31:3483–3486. doi: 10.1093/nar/gkg598. [DOI] [PMC free article] [PubMed] [Google Scholar]
- Zigman JM, Nakano Y, Coppari R, Balthasar N, Marcus JN, Lee CE, Jones JE, Deysher AE, Waxman AR, White RD, et al. Mice lacking ghrelin receptors resist the development of diet-induced obesity. J Clin Invest. 2005;115:3564–3572. doi: 10.1172/JCI26002. [DOI] [PMC free article] [PubMed] [Google Scholar]
- Ziouzenkova O, Orasanu G, Sharlach M, Akiyama TE, Berger JP, Viereck J, Hamilton JA, Tang G, Dolnikowski GG, Vogel S, et al. Retinaldehyde represses adipogenesis and diet-induced obesity. Nat Med. 2007;13:695–702. doi: 10.1038/nm1587. [DOI] [PMC free article] [PubMed] [Google Scholar]
Associated Data
This section collects any data citations, data availability statements, or supplementary materials included in this article.


