Abstract
This study examined the feasibility of using short-echo water-suppressed point-resolved spectroscopy (PRESS) on a clinical 3T magnetic resonance (MR) scanner for evaluating biochemical changes in degenerated bovine and cadaveric human inter-vertebral discs. In bovine discs (N = 17), degeneration was induced with papain injections. Degeneration of human cadaveric discs (N = 27) was assessed using the Pfirrmann grading on T2-weighted images. Chemicals in the carbohydrate region (Carb), the choline head group (Cho), the N-acetyl region (N-acetyl), and the lipid and lactate region (Lac+Lip) were quantified using 1H PRESS, and were compared between specimens with different degrees of degeneration. The correlation between the spectroscopic findings and glycosaminoglycan (GAG) quantification using biochemical assays was determined. Significant differences were found between the ratios (N-acetyl/Cho, N-acetyl/Lac+Lip) acquired before and after papain injection in bovine discs. For human cadaveric discs, significant differences in the ratios (N-acetyl/Carb, N-acetyl/Lac+Lip) were found between discs having high and low Pfirrmann scores. Significant correlations were found between N-acetyl/Lac+Lip and GAG content in bovine discs (R = 0.77, P = 0.0007) and cadaveric discs (R = 0.83, P < 0.0001). Significant correlation between N-acetyl/Cho and GAG content was also found in cadaver discs (R = 0.64, P = 0.0039). This study demonstrates for the first time that short-echo PRESS on a clinical 3T MR scanner can be used to noninvasively and can reproducibly quantify metabolic changes associated with degeneration of intervertebral discs.
Keywords: metabolite quantitation, intervertebral disc degeneration, single-voxel MR spectroscopy, glycosaminoglycan, Pfirrmann grade
Intervertebral degenerative disc disease (IVDD) afflicts nearly 12 million people in the United States and is a leading cause of lumbar spine–related lower-back pain (1,2). The intervertebral disc consists of three regions: the nucleus pulposus, the annulus fibrosus, and the cartilaginous end-plates. The nucleus pulposus is composed of a negatively charged hydrated proteoglycan (PG) gel within a loose network of collagen. The annulus fibrosus contains collagen and a low concentration of PG. The end-plate separates the disc from the bordering vertebral bone. Early degenerative change occurs when large aggregating PGs break down and the extracellular matrix degrades, leading to disc dehydration and depressurization. These biochemical changes later cause morphological changes and alterations in biomechanical properties (3–6). Early detection of IVDD with these biochemical changes would contribute significantly to early diagnosis of the disease and successful treatment strategies to halt or reverse the degenerative process.
Several imaging techniques have been investigated to study IVDD. Radiography and X-ray computed tomography (CT) are two imaging methods dedicated to the morphologic evaluation of the disc disease and reactive bony changes (7–9). Discography (10) is invasive and requires injection of dye to elucidate the source of the pain into the disc. Its invasive nature limits clinical application. Magnetic resonance imaging (MRI) has been used to detect and assess intervertebral disc degeneration. Conventional MRI provides information on disc structure including signal intensity changes of the disc or changes in disc height related to disc degeneration. Both T1- and T2-weighted images are capable of showing these structural changes (11,12). The Pfirrmann scoring system was introduced, which utilizes the disc morphology as revealed by T2-weighted MR images to characterize intervertebral disc degeneration (13). However, MR findings in asymptomatic aging and painful degenerative disc disease may be very similar and standard MR images do not reliably identify disc segments that are symptomatic, thus limiting preoperative assessment (9). Therefore, the development of techniques to quantify disc degeneration based on biochemical changes in discs is warranted. Such techniques have the potential to facilitate the study of disease progression and to identify symptomatic disc segments. MRI methods including T1 mapping (14,15), T2 mapping (14,16), T1rho imaging (1,17,18) as well as diffusion imaging (15,19,20), have recently been proposed to quantitatively detect early degenerative changes in the matrix content of intervertebral discs.
In vivo MR spectroscopy can compliment MRI techniques by providing an assessment of the chemical changes associated with disc degeneration. Prior in vitro high-resolution magic-angle spinning (HRMAS) spectroscopic studies of intact human discs have demonstrated significant chemical changes associated with disc degeneration (21,22). In these studies, four chemically distinct spectral regions were identified: the carbohydrate region (Carb) (3.50–4.20 ppm), the choline region (Cho) (3.15–3.30 ppm), the N-acetyl region (N-acetyl) (1.90–2.10 ppm), and the lipid and lactate region (Lac+Lip) (1.15–1.40 ppm). With increasing disc degradation, as measured by increasing Thompson grade, there were decreases in the N-acetyl resonance and the amount of proteoglycans (PGs) in disc (21,22). Additionally, there was a Thompson grade–dependent increase in the spectral resolution in the carbohydrate region that correlated with increasing amounts of breakdown products of both collagen and chondroitin sulfate (22). Furthermore, a recent HRMAS disc study suggested that spectroscopic markers of proteoglycan, collagen, and lactate may also serve as markers of discogenic back pain (23). Specifically, significantly lower N-acetyl/Carb, and N-acetyl/Lac ratios, and higher Lac/Carb ratio were observed in disc specimens obtained from discogenic pain patients when compared to scoliosis patients (23). However, the ability of spatially-localized, in-vivo, single-voxel, proton (1H) MR spectroscopy (SVS) performed on a clinical MR scanner to accurately and robustly detect metabolic changes associated with disc degeneration has not been established. Because a prior 11.7T HRMAS study (21) demonstrated that the chemical constituents of human discs had relatively short T2s, as short as 30 to 50 ms for N-acetyl, and the volume of the disc is as small as ~9 ml in the literature (24), a short echo time, single-voxel localized spectroscopic approach was investigated in this study (21). To determine whether it was feasible to pursue spectroscopic studies in humans, two in vitro model systems of disc degeneration were employed, a papain-digested bovine disc model and a human cadaveric model.
The goal of this study was to use short echo time, water-suppressed, point-resolved spectroscopy (PRESS) on a clinical 3T MR scanner to acquire localized spectra from intact bovine and human cadaveric discs at increasing stages of degradation in order to determine the ability of 3T SVS to detect metabolic changes associated with disc degeneration and to correlate these changes with the biochemical analysis of the proteoglycan content of the same discs.
MATERIALS AND METHODS
A 3T GE Excite Signa whole-body MR scanner (General Electric Medical Systems, Milwaukee, WI) and a GE 8-channel phase-array knee coil were employed for all of the imaging and localized spectroscopy studies.
Bovine Disc Study
A total of 23 fresh-frozen bovine caudal discs were thawed and imaged at room temperature. The discs were kept intact inside the spine segments. To simulate degeneration with loss of PG, enzymatic degradation of the disc was performed with papain (Sigma P-4762). Each disc was injected with 0.1 mL of a papain solution containing 2 mg papain (14 U/mg), 0.1 M sodium phosphate (Aldrich 342483), 0.05 M ethylene diamine tetraacetic acid (EDTA) (Sigma E6758) and 0.01 M L-Cysteine hydrochloride (Sigma C1276), following the formulation used by Bradford et al (25). Due to back pressure, the exact amount of injected papain solution could not be determined. However, it was estimated that 70 to 95 µL of solution was injected in each disc (26).
Among the 23 bovine discs, 16 discs were injected with papain in order to induce degradation and the other seven discs were kept as controls. Both papain-injected and control bovine discs were stored at 4°C for 4 to 6 days and were scanned again to examine the degeneration that was introduced by papain injection. After the scan, seven of the papain-injected discs and seven control discs were analyzed for proteoglycan content.
Cadaveric Disc Study
A total of 37 fresh-frozen cadaveric human lumbar inter-vertebral discs (from 17 spines, age 32–92 years, 10 males, 7 females) were acquired. The discs were then thawed and imaged at room temperature. A subset of 18 cadaveric human discs were dissected for biochemical analysis.
Biochemical Assay for Glycosaminoglycan
The biochemical analysis was performed using a traditional glycosaminoglycan (GAG) assay method (27). With GAG being a major component of PG, GAG assay offers a quantitative approach for the analysis of PG concentration. After MR scans, the cadaveric human discs and the bovine discs were dissected and a 25-mg tissue sample of the nucleus pulposus was obtained by punch biopsy (Sklar Truepunch; Sklar Instruments, West Chester, PA, USA). The biopsy punches were taken at a central location of nucleus pulposus on each intervertebral disc. The sample tissues were digested in papain and used for biochemical GAG assays. The GAG content was measured using a dimethylene blue assay as previously described (27).
Imaging and Spectroscopic Acquisition
The imaging protocol was principally composed of a standard sagittal T2-weighted fast spin-echo (FSE) sequence and a SVS sequence. The imaging parameters for the sagittal FSE sequence were as follows: field-of-view = 20 cm, TE/TR = 60 ms/4000 ms, matrix size = 320 × 224, slice thickness = 5 mm, number of excitations = 4, echo train length = 16, total imaging time = 4 min. The single-voxel spectra were obtained by a PRESS sequence with a three-pulse chemical shift selective (CHESS) saturation sequence for water suppression. The imaging parameters of the SVS sequence were as follows: TE/TR = 35 ms/1700 ms, number of data points = 1024, spectral width = 2000 Hz, suppressed echoes = 384. Total imaging time was 11 min 29 s. A 4 × 16 × 14 mm3 voxel was placed at the center of the intervertebral disc (the voxel size can be slightly modified according to the size of the actual imaging disc to avoid lipid contamination from neighboring tissues). A very-selective-saturation (VSS) pulse (28) and acquisition of 120% of the PRESS volume were employed to sharpen the volume selection profile and to reduce the effects of chemical shift misregistration. Localized shimming was performed automatically followed by manual shimming to improve field homogeneity. Spectra were acquired with a full-width at half-maximum (FWHM) < 15 Hz at 3T, corresponding to 0.12 ppm.
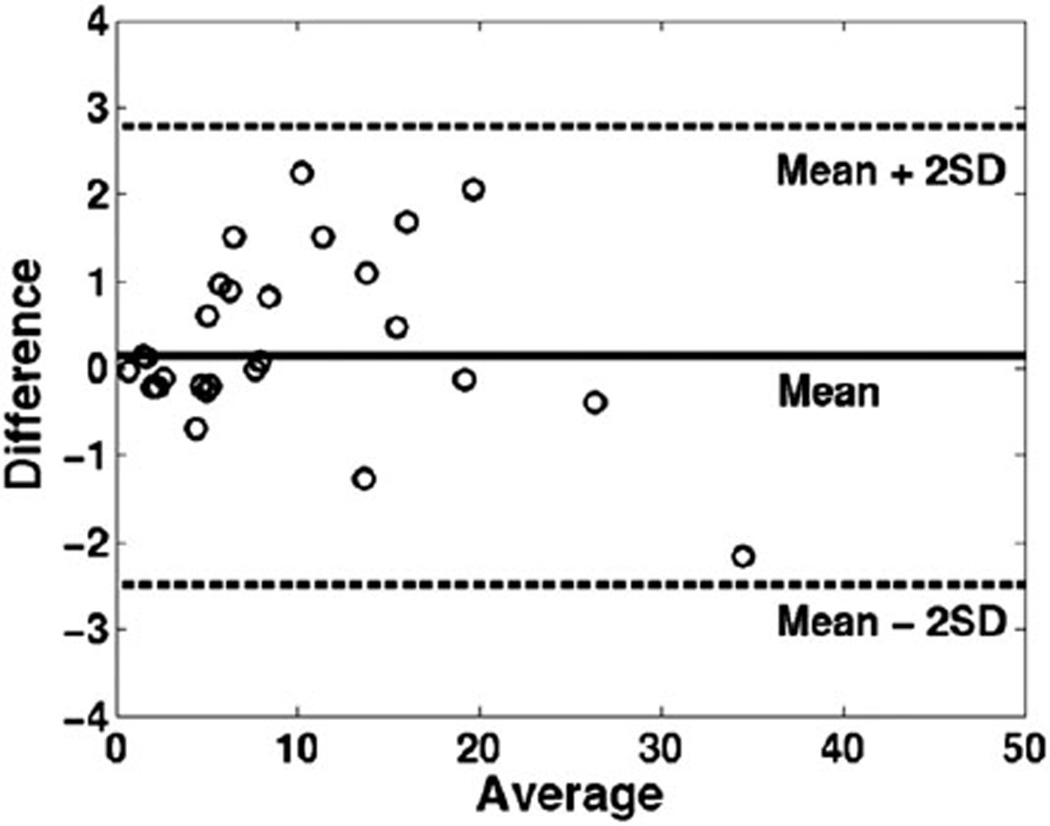
To evaluate the scan reproducibility, six bovine discs were scanned twice on the same day. The discs were repositioned between the repeated scans. The reproducibility was later assessed with a Bland and Altman plot (29).
Image Grading and Spectral Analysis
Pfirrmann grading (13) was performed for all discs within the cadaveric spine, using a sagittal T2-weighted FSE sequence by an experienced musculoskeletal radiologist (T.M.L.) in all cadaveric human discs. The Pfirrmann grading is performed based on signal characteristics of the intervertebral disc:
Discs exhibiting a homogeneous structure with bright hyperintense white signal intensity and a normal height were classified as grade 1;
Discs with the above features but exhibiting an inhomogeneous structure (with or without horizontal bands) were considered to be grade 2;
Discs showing gray, inhomogeneous structure with unclear distinction of nucleus and annulus were considered to be grade 3;
Discs exhibiting inhomogeneous, gray to black structure with a loss of distinction of nucleus and annulus were considered to be grade 4;
Discs showing black structure with collapsed disc space were assessed as grade 5.
All processing of the spectra data was performed offline on a Sun workstation (Sun Microsystems, Palo Alto, CA, USA). The data acquired were processed using a previously-developed method (30): phase corrected and apodized with a 4-Hz Lorentzian function, followed by a Fourier transformation to the frequency domain, frequency correction, and baseline correction. A peak-fitting program developed in our laboratory (31) was further applied to provide an estimation of the peak areas of the chemical constituents of the disc, and three peak area ratios: N-acetyl/Carb, N-acetyl/Cho, and N-acetyl/Lac+Lip were computed.
Statistical Analysis
An analysis of variance (ANOVA) test with a Tukey-Kramer correction for multiple comparisons was used for the statistical analysis of chemical ratios acquired between baseline and papain-digested bovine discs at different time points after digestion. Among the 23 bovine discs, 14 discs were rescanned 6 days after the first scans, eight discs were rescanned 5 days after first scans, and one disc was rescanned 4 days after first scan. The first 14 discs had GAG assay done. The metabolite ratios did not change significantly after 4 days in our observation. The same method was employed to analyze the metabolite ratio changes between the cadaveric discs in the low and high Pfirrmann score groups. Significance level was set to 0.05.
RESULTS
Reproducibility
Figure 1 is a Bland and Altman plot of the bovine disc N-acetyl/Lac+Lip, N-acetyl/Cho, and N-acetyl/Carb ratios acquired from the same bovine disc twice on the same day. The differences of the two repeated measurements were within two standard deviations (SDs), demonstrating good agreement for the repeated measurements. Mean coefficients of variation (CVs) of the three calculated metabolite ratios varied from 9.32% to 12.72%, with N-acetyl/Lac+Lip demonstrating the smallest CV (9.32%), followed by N-acetyl/Cho (11.08%), and N-acetyl/Carb (12.72%).
FIG. 1.
Bland and Altman analysis plots the differences between the two measurements vs. the averages of the two measurements, showing that the two measurements were in good agreement.
Bovine Disc Study
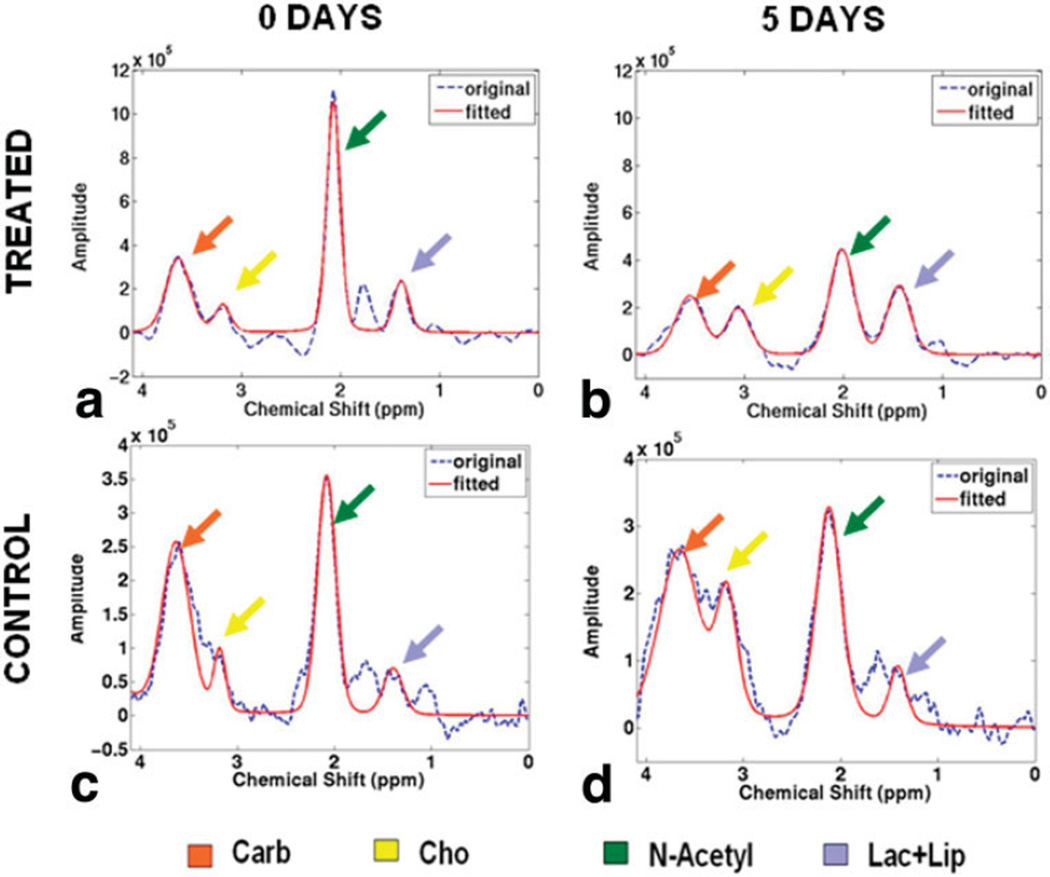
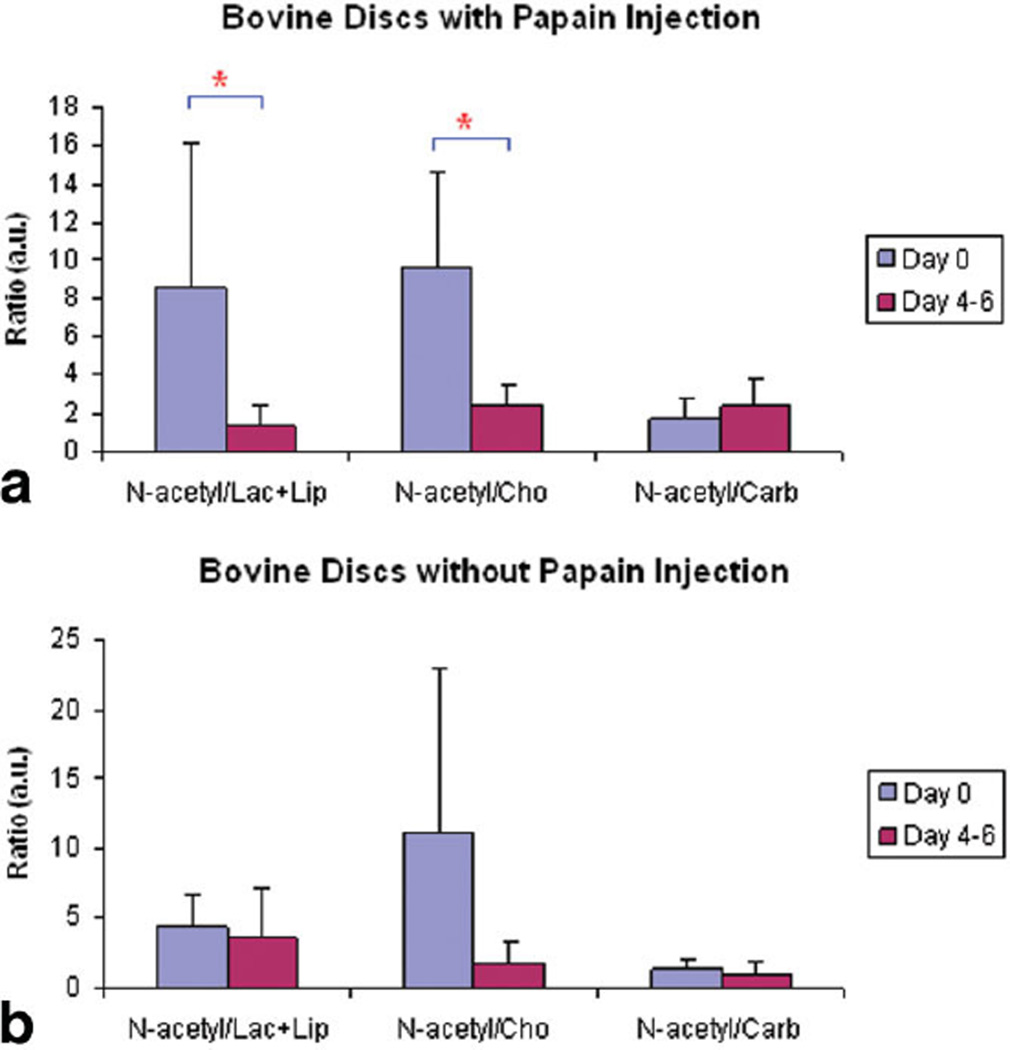
Figure 2a and b show representative 1H disc spectra from a bovine disc before and 5 days after papain injection. A significant decrease in N-acetyl peak height was observed as the disc was digested by papain. In comparison, no apparent changes were observed between Fig. 2c and d, which were acquired from a control disc at the same time points. Significant differences were found between the N-acetyl/Lac+Lip (P = 0.0032) and N-acetyl/Cho (P < 0.0001) ratios acquired before and 4 to 6 days after papain injection (Fig. 3a), but no differences were found between the N-acetyl/Carb ratios (P = 0.44). No significant differences were observed between these ratios acquired from the control discs at same two time points though the ratios was demonstrated a decreasing trend (Fig. 3b).
FIG. 2.
Representative MR single-voxel spectra acquired in a bovine disc before (a) and 5 days after (b) papain injection vs. the spectra acquired in a control bovine disc at the same time points: before (c) and 5 days after (d). Note the significant decrease of N-acetyl peak height. In comparison, no significant differences were found in the control bovine disc between the two time points. The dash blue lines represent the acquired spectra, the solid red line represent the fitted spectra for peak area quantification.
FIG. 3.
Computed N-acetyl/Lac+Lip ratios, N-acetyl/Cho ratios, and N-acetyl/Carb ratios of MR spectra acquired on the bovine discs before (day 0) and 4 to 6 days after papain injection (day 4–6). Significant reductions of the N-acetyl/Lac+Lip ratio and the N-acetyl/Cho ratio were observed in the discs with papain injection (a), but not in the control discs. *Indicates significant statistical difference (P < 0.05).
Cadaveric Disc Study
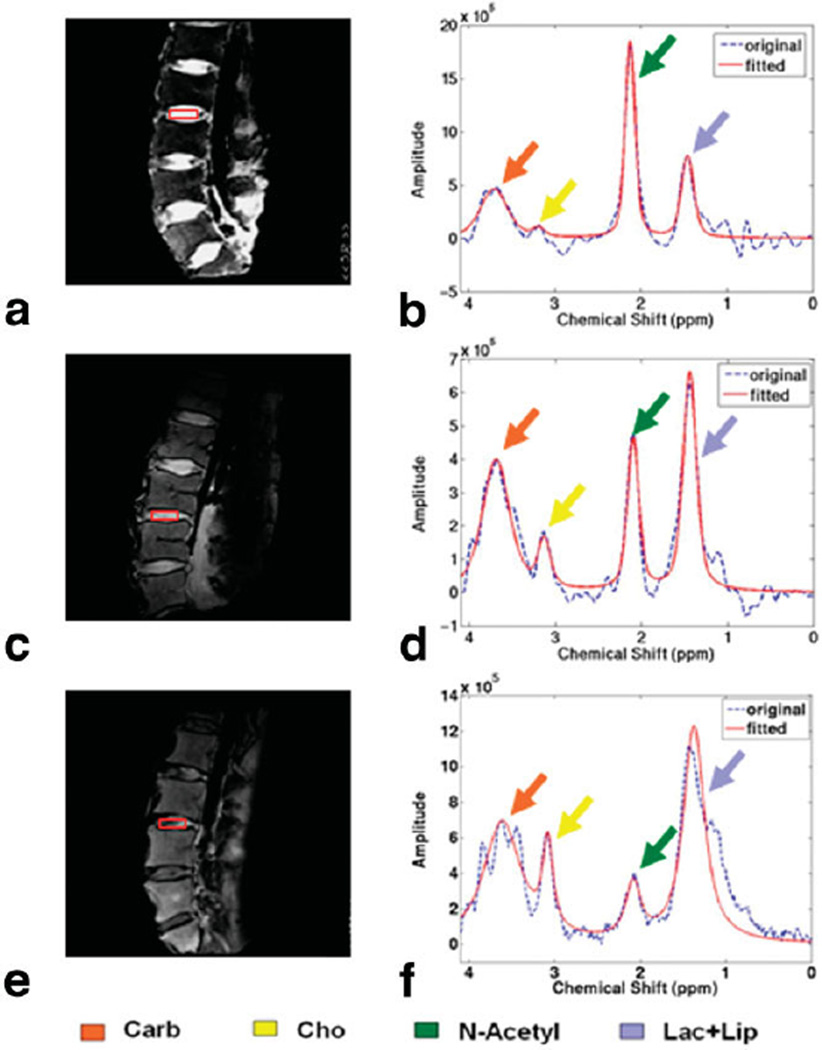
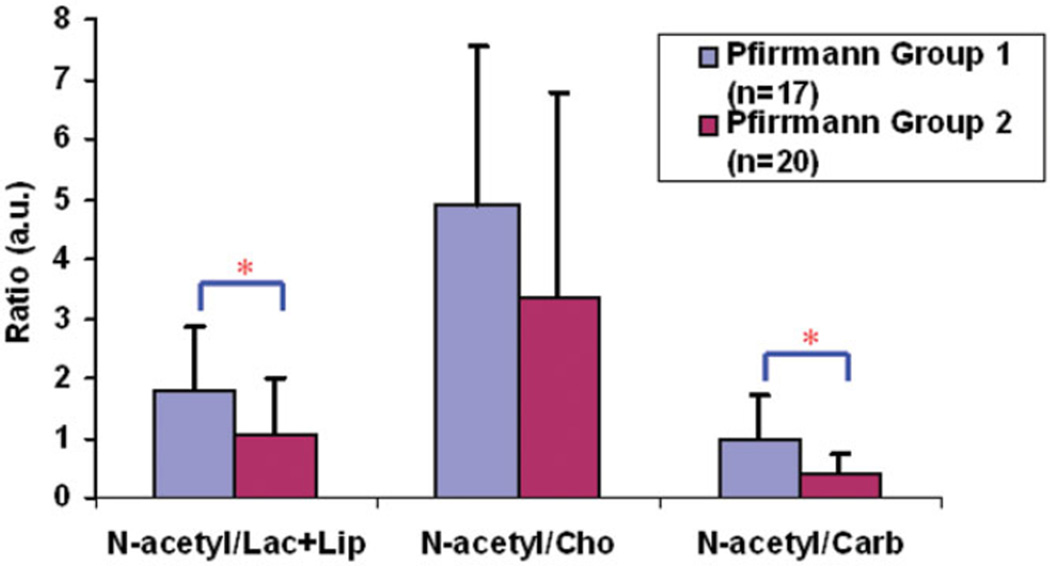
Of the 37 human cadaver discs studied, two were classified as Pfirrmann grade 1, 15 as grade 2, one as grade 2.5, 16 as grade 3, and three as grade 3.5. Representative T2-weighted images and the corresponding spectra are shown in Fig. 4. The N-acetyl decreased and the Cho and Lac+Lip peaks increased with increasing Pfirrmann grade. Considering the nonuniform distribution of the Pfirrmann scores in the studied discs and the subjectivity of the Pfirrmann grading, the discs were divided into two groups: discs with scores ≤ 2 (low) and discs with scores > 2 (high). Group 1 had 17 discs and represented less-degenerated discs; group 2 had 20 discs and represented more-degenerated discs. The N-acetyl/Lac+Lip ratio, the N-acetyl/Cho ratio, and the N-acetyl/Carb ratio decreased as the discs were more degenerated (Fig. 5). Tukey-Kramer test indicated significant differences in the N-acetyl/Carb (P = 0.0022) and the N-acetyl/Lac+Lip ratios (P = 0.017) between the two groups. Although there was a clear decease in the N-acetyl/Cho ratio with higher Pfirrmann score, this decrease was not significant (P = 0.069).
FIG. 4.
Representative T2-weighted images of Pfirrmann grade 1 (a), Pfirrmann grade 2 (c), Pfirrmann grade 3 (e), and the corresponding spectra (b,d,f) from cadaveric human discs of different Pfirrmann grade. Color arrows indicate the metabolite peaks. Note the decrease of N-acetyl and the increase of Cho and Lac+Lip with disc degeneration.
FIG. 5.
Statistical analysis of the measured metabolite ratios between the cadaveric human discs of different Pfirrmann groups. *Indicates significant statistical difference. [Color figure can be viewed in the online issue, which is available at www.interscience.wiley.com.]
Biochemical Assay for GAG
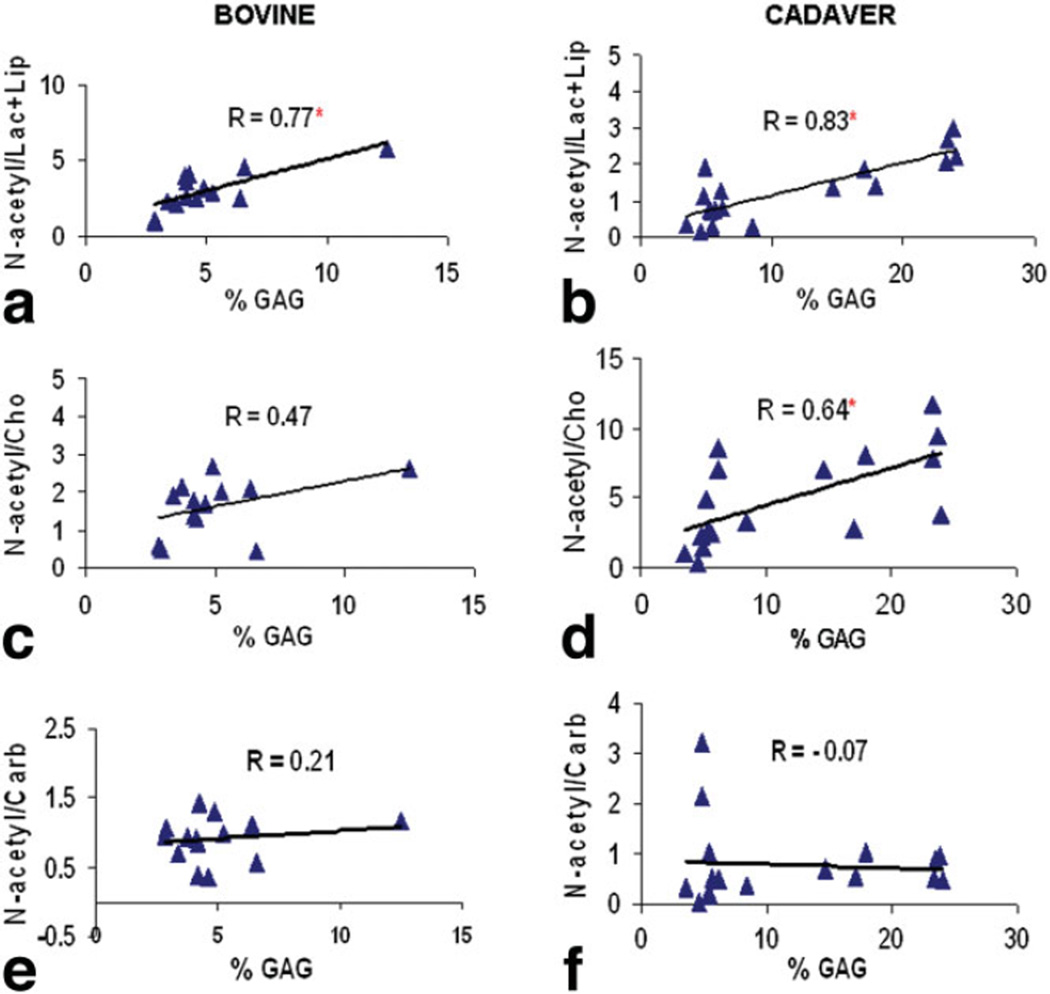
Analysis of the GAG content of bovine discs revealed significant correlation between N-acetyl/Lac+Lip and GAG content (R = 0.77, P = 0.0007) (Fig. 6a). Significant correlations between N-acetyl/Lac+Lip and GAG content (R = 0.83, P < 0.0001) (Fig. 6b) as well as between N-acetyl/Cho and GAG content (R = 0.64, P = 0.0039) (Fig. 6d) were also demonstrated in the cadaveric human discs study. No significant correlations were found between other two calculated metabolite ratios (N-acetyl/Cho and N-acetyl/Carb) and GAG content in bovine discs (Fig. 6c and e); and no significant correlation was found between N-acetyl/Carb and GAG content in cadaveric human discs (Fig. 6f).
FIG. 6.
Biochemical analysis on bovine discs showed significant correlation between N-acetyl/Lac+Lip (R = 0.77, P = 0.0007) and GAG content (a); but not between N-acetyl/Cho and GAG content (R = 0.47, P = 0.15) (c) nor between N-acetyl/Carb and GAG content (R = 0.21, P = 0.46) (e). Biochemical analysis on cadaver discs showed significant correlations between N-acetyl/Lac+Lip (R = 0.83, P < 0.0001) and GAG content (b) as well as between N-acetyl/Cho and GAG content (R = 0.64, P = 0.0039) (d); but not between N-acetyl/Carb and GAG content (R = −0.07, P = 0.77) (f). *Indicates significant correlation. [Color figure can be viewed in the online issue, which is available at www.interscience.wiley.com.]
DISCUSSION
This study demonstrates for the first time that short-echo water-suppressed PRESS on a clinical 3T MR scanner can be used to reproducibly acquire localized 1H spectra from intact bovine and human cadaveric discs. Similar to prior high-field (11.7T) HRMAS disc studies (21,22), 3T single-voxel spectroscopy can detect significant chemical differences that correlate with disc degeneration. Reproducibility studies showed good agreement between the repeated spectral measurements of the bovine disk, with mean CVs of the N-acetyl/Lac+Lip, N-acetyl/Cho, and N-acetyl/Carb ratios in the disc being comparable to the spectral measurement reproducibility found in single-voxel 1H spectroscopic studies of the human brain (32).
A decrease in the N-acetyl/Lac+Lip and N-acetyl/Cho ratios with disc degeneration was observed in both bovine and cadaveric discs and correlated to a biochemical reduction in GAG content. In this study, papain-induced digestion of bovine intervertebral discs was used as a model of intervertebral disc degeneration. It was recently reported that papain treatment significantly reduced GAG content in a bovine explant model 1 week after the injection (26). Our spectral and biochemical results are in agreement with these findings, and suggest that the N-acetyl peak might be a good biomarker for PG content in the disc and its reduction a good estimate of disc degeneration.
The Pfirrmann grading system offers a 5-point scale for morphological classification of intervertebral disc degeneration based on anatomic changes on MRI (13). However, Pfirrmann grading is subjective and has been incapable of revealing a consistent signal pattern characteristic of patients with low back pain (33). In this study, significant differences were found for the N-acetyl/Carb ratio and the N-acetyl/Lac+Lip ratio between cadaveric human discs having low and high Pfirrmann grades. The N-acetyl peak is well resolved from other resonances and has the highest signal to noise ratio of all of the peaks in the 1H disc spectra, making it the easiest peak to quantify. Therefore, quantitative changes in the N-acetyl peak may provide a less subjective, more robust assessment of disc degeneration and potentially back pain as well.
Previous HRMAS studies of human discs demonstrated increased spectral resolution (sharper peaks) in the carbohydrate region of degenerated disc spectra (21,22). This increase in spectral resolution has been attributed to increased levels of chemical constituents associated with the breakdown of collagen (hydroxyproline, glycine) and chondroitin sulfate (N-acetylgalactosamine and glucuronic acid) in prior high-field HRMAS studies (21,22). Splits in the carbohydrate region were observed in a subset of the cadaveric human discs with Pfirrmann grade 3 or higher (Fig. 4f). Similar to previous HRMAS studies, we suspect that these splits represent increased spectral resolution with disc degeneration. However, due to the limited number of specimen, and more importantly, due to the spectral complexity (overlapping and often broad peaks of different chemical constituents) of this region of spectrum in 3T 1H disc spectra, the quantification of individual chemical constituents of the carbohydrate region is not possible at this stage. Nevertheless, the area under the curve of this spectral region does serve as a useful denominator for the N-acetyl/Carb ratio that significantly changes with disc degeneration. Additionally, ways of quantifying the increase in spectral resolution of the carbohydrate region with disc degeneration are currently being investigated.
In this study, the peak area of the choline region of the 1H disc spectrum also increased with the severity of disc degeneration. In a prior HRMAS study of human discs there was also evidence of increasing choline levels in more degenerated discs (21). While the mechanism behind this increase in choline is not clear, it is interesting from the standpoint that even in 3T 1H disc spectra the choline peak can be resolved and quantified, and it has served as a useful denominator in discriminating disc degeneration in this study.
Lack of differentiation of the lactate from the lipid peaks is a limitation of the study, and could be a big challenge for in vivo 1H spectroscopic evaluation of disc degeneration. In in vivo PRESS studies of other human tissues, lactate has been resolved from lipid resonances by using an echo time = 144 ms, which reduces lipid resonances due to their shorter T2 relaxation times and inverts the lactate peak due to J-modulation (34). More sophisticated spectral editing techniques for resolving lactate that take advantage of J-coupling (35) or multiple quantum coherences (36) also require the use of longer echo times and/or result in significant losses in magnetization. Unfortunately, the chemical constituents in the annulus and nucleus of the human disc have T2 relaxation times as short as 30 to 50 ms for N-acetyl (21), leading to a dramatic decrease in the signal-to-noise ratio in long-echo PRESS spectra of the disc. This, combined with the relatively small size of the human disc, particularly degenerated discs, reduces the feasibility of acquiring long-echo PRESS or other spectrally-edited 1H spectra of the human disc to resolve lactate from lipid with sufficient signal-to-noise ratio.
Another limitation of the study is that the spatial resolution obtainable by in vivo 1H PRESS results in the averaging of chemical signals from both the nucleus and annulus of the disc. Hence the observed changes with disc degeneration in this study reflect morphologic and chemical changes in both of these structures. Prior HRMAS studies of degenerated human discs have noted different metabolic profiles for the annulus and nucleus but demonstrated similar chemical changes with disc degeneration (21). Therefore, the averaging of spectroscopic signals from the annulus and nucleus could still be used to quantify metabolic changes associated with degeneration of inter-vertebral discs.
Finally, measurements were not obtained on Pfirrmann grade 4 and higher discs in this study since the current goal was to develop a quantitative technique to detect disc degeneration at an early stage, and to differentiate degenerated symptomatic discs from those in asymptomatic patients. In addition, grade 4 and 5 disc spaces are usually collapsed and adequate quantification of metabolites is no longer possible; the reduced disc height limits the application of these spectroscopic measurements.
In summary, SVS of the intervertebral disc seems to be a promising approach for noninvasive characterization of early IVDD. Current studies indicate a correlation between measured metabolite ratio changes and the severity of disc degeneration. Additionally, we observed a significant correlation between the N-acetyl/Lac+Lip ratio and the GAG content. Further in vitro and in vivo studies are warranted. In combination with MRI, SVS of the intervertebral discs may provide an objective and noninvasive to measure IVDD in vivo.
ACKNOWLEDGMENTS
We thank Jeff C. Lotz and Azucena G. Rodriguez of the Department of Orthopaedic Surgery, University of California, San Francisco, California, for their provision of the human cadaver spines (N = 12) in this study. We also acknowledge the National Development and Research Institutes (NDRI, New York, NY) for providing spines (N = 5).
Grant sponsor: University of California (UC) Discovery, Industry-University Cooperative Research Program (IUCRP) Nocimed, LLC; Grant number: BIO07-10641; Grant sponsor: National Institutes of Health (NIH); Grant number: RO1 AG 17762.
REFERENCES
- 1.Johannessen W, Auerbach JD, Wheaton AJ, Kurji A, Borthakur A, Reddy R, Elliott DM. Assessment of human disc degeneration and proteoglycan content using T1rho-weighted magnetic resonance imaging. Spine. 2006;31:1253–1257. doi: 10.1097/01.brs.0000217708.54880.51. [DOI] [PMC free article] [PubMed] [Google Scholar]
- 2.Paajanen H, Erkintalo M, Parkkola R. Age-dependent correlation of low-back pain and lumbar disc degeneration. Arch Orthop Trauma Surg. 1997;116:106–107. doi: 10.1007/BF00434112. [DOI] [PubMed] [Google Scholar]
- 3.Urban JP, McMullin JF. Swelling pressure of the lumbar intervertebral discs: influence of age, spinal level, composition, and degeneration. Spine. 1988;13:179–187. doi: 10.1097/00007632-198802000-00009. [DOI] [PubMed] [Google Scholar]
- 4.Antoniou J, Steffen T, Nelson F, Winterbottom N, Hollander AP, Poole RA, Aebi M, Alini M. The human lumbar intervertebral disc: evidence for changes in the biosynthesis and denaturation of the extracellular matrix with growth, maturation, ageing and degeneration. J Clin Invest. 1996;98:996–1003. doi: 10.1172/JCI118884. [DOI] [PMC free article] [PubMed] [Google Scholar]
- 5.Kirkaldy-Willis WH, Wedge JH, Young-Hing K, Reilly J. Pathology and pathogenesis of lumbar spondylosis and stenosis. Spine. 1978;3:319–328. doi: 10.1097/00007632-197812000-00004. [DOI] [PubMed] [Google Scholar]
- 6.Andersson GB. What are the age-related changes in the spine? Baillieres Clin Rheumatol. 1998;12:161–173. doi: 10.1016/s0950-3579(98)80010-1. [DOI] [PubMed] [Google Scholar]
- 7.Kistler MW, Pribram HW. Epidural venography in the diagnosis of lumbar disc disease. Surg Neurol. 1976;5:287–291. [PubMed] [Google Scholar]
- 8.Griebel R, Tchang S, Khan M, Varughese G. Correlation of computed tomography with surgical diagnosis in lumbar disc disease. Can J Neurol Sci. 1983;10:248–251. doi: 10.1017/s0317167100045091. [DOI] [PubMed] [Google Scholar]
- 9.Finch P. Technology insight: imaging of low back pain. Nat Clin Pract Rheumatol. 2006;2:554–561. doi: 10.1038/ncprheum0293. [DOI] [PubMed] [Google Scholar]
- 10.Collis JS, Jr, Gardner WJ. Lumbar discography. Analysis of 600 degenerated disks and diagnosis of degenerated disk disease. JAMA. 1961;178:67–70. doi: 10.1001/jama.1961.73040400020017b. [DOI] [PubMed] [Google Scholar]
- 11.Modic MT, Ross JS. Magnetic resonance imaging in the evaluation of low back pain. Orthop Clin North Am. 1991;22:283–301. [PubMed] [Google Scholar]
- 12.Jenkins JP, Stehling M, Sivewright G, Hickey DS, Hillier VF, Isherwood I. Quantitative magnetic resonance imaging of vertebral bodies: a T1 and T2 study. Magn Reson Imaging. 1989;7:17–23. doi: 10.1016/0730-725x(89)90320-2. [DOI] [PubMed] [Google Scholar]
- 13.Pfirrmann CW, Metzdorf A, Zanetti M, Hodler J, Boos N. Magnetic resonance classification of lumbar intervertebral disc degeneration. Spine. 2001;26:1873–1878. doi: 10.1097/00007632-200109010-00011. [DOI] [PubMed] [Google Scholar]
- 14.Chatani K, Kusaka Y, Mifune T, Nishikawa H. Topographic differences of 1H-NMR relaxation times (T1, T2) in the normal intervertebral disc and its relationship to water content. Spine. 1993;18:2271–2275. doi: 10.1097/00007632-199311000-00022. [DOI] [PubMed] [Google Scholar]
- 15.Chiu EJ, Newitt DC, Segal MR, Hu SS, Lotz JC, Majumdar S. Magnetic resonance imaging measurement of relaxation and water diffusion in the human lumbar intervertebral disc under compression in vitro. Spine. 2001;26:437–444. doi: 10.1097/00007632-200110010-00017. [DOI] [PubMed] [Google Scholar]
- 16.Weidenbaum M, Foster RJ, Best BA, Saed-Najad F, Nickoloff E, Newhouse J, Ratcliffe A, Mow VC. Correlating magnetic resonance imaging with the biochemical content of the normal human intervertebral disc. J Orthop Res. 1992;10:552–561. doi: 10.1002/jor.1100100410. [DOI] [PubMed] [Google Scholar]
- 17.Auerbach JD, Johannessen W, Borthakur A, Wheaton AJ, Dolinskas CA, Balderston RA, Reddy R, Elliott DM. In vivo quantification of human lumbar disc degeneration using T1(rho)-weighted magnetic resonance imaging. Eur Spine J. 2006;15(Suppl 3):S338–S344. doi: 10.1007/s00586-006-0083-2. [DOI] [PMC free article] [PubMed] [Google Scholar]
- 18.Blumenkrantz G, Li X, Han E, Newitt D, Link T, Majumdar S. A feasibility study on in vivo T1rho imaging of the intervertebral disc. Magn Reson Imaging. 2006;24:1001–1007. doi: 10.1016/j.mri.2006.04.013. [DOI] [PubMed] [Google Scholar]
- 19.Antoniou J, Demers CN, Beaudoin G, Goswami T, Mwale F, Aebi M, Alini M. Apparent diffusion coefficient of intervertebral discs related to matrix composition and integrity. Magn Reson Imaging. 2004;22:963–972. doi: 10.1016/j.mri.2004.02.011. [DOI] [PubMed] [Google Scholar]
- 20.Kerttula L, Kurunlahti M, Jauhiainen J, Koivula A, Oikarinen J, Tervonen O. Apparent diffusion coefficients and T2 relaxation time measurements to evaluate disc degeneration. A quantitative MR study of young patients with previous vertebral fracture. Acta Radiol. 2001;42:585–591. doi: 10.1080/028418501127347241. [DOI] [PubMed] [Google Scholar]
- 21.Keshari KR, Zektzer AS, Swanson MG, Majumdar S, Lotz JC, Kurhanewicz J. Characterization of intervertebral disc degeneration by high-resolution magic angle spinning (HR-MAS) spectroscopy. Magn Reson Med. 2005;53:519–527. doi: 10.1002/mrm.20392. [DOI] [PubMed] [Google Scholar]
- 22.Keshari KR, Lotz JC, Kurhanewicz J, Majumdar S. Correlation of HR-MAS spectroscopy derived metabolite concentrations with collagen and proteoglycan levels and Thomson grade in the degenerative disc. Spine. 2005;30:2683–2688. doi: 10.1097/01.brs.0000188256.88859.9c. [DOI] [PubMed] [Google Scholar]
- 23.Keshari KR, Lotz JC, Link TM, Hu S, Majumdar S, Kurhanewicz J. Lactic acid and proteoglycans as metabolic markers for discogenic back pain. Spine. 2008;33:312–317. doi: 10.1097/BRS.0b013e31816201c3. [DOI] [PubMed] [Google Scholar]
- 24.Prichard JW. What the clinician can learn from MRS lactate measurements. NMR Biomed. 1991;4:99–102. doi: 10.1002/nbm.1940040212. [DOI] [PubMed] [Google Scholar]
- 25.Bradford DS, Oegema TR, Jr, Cooper KM, Wakano K, Chao EY. Chymopapain, chemonucleolysis, and nucleus pulposus regeneration. A biochemical and biomechanical study. Spine. 1984;9:135–147. doi: 10.1097/00007632-198403000-00004. [DOI] [PubMed] [Google Scholar]
- 26.Roberts S, Menage J, Sivan S, Urban JPG. Bovine explant model of degeneration of the intervertebral disc. BMR Musculoskelet Disord. 2008;9:24. doi: 10.1186/1471-2474-9-24. [DOI] [PMC free article] [PubMed] [Google Scholar]
- 27.Hoemann CD. Molecular and biochemical assays of cartilage component. Methods Mol Med. 2004;101:127–156. doi: 10.1385/1-59259-821-8:127. [DOI] [PubMed] [Google Scholar]
- 28.Le Roux P, Gilles RJ, McKinnon GC, Carlier PG. Optimized outer volume suppression for single-shot fast spin-echo cardiac imaging. J Magn Reson Imaging. 1998;8:1022–1032. doi: 10.1002/jmri.1880080505. [DOI] [PubMed] [Google Scholar]
- 29.Bland JM, Altman DG. Statistical methods for assessing agreement between two methods of clinical measurement. Lancet. 1986;1:307–310. [PubMed] [Google Scholar]
- 30.Nelson SJ. Analysis of volume MRI and MR spectroscopic imaging data for the evaluation of patients with brain tumors. Magn Reson Med. 2001;46:228–239. doi: 10.1002/mrm.1183. [DOI] [PubMed] [Google Scholar]
- 31.Li X, Nelson SJ. Reliable in vivo lactate and lipid estimation in glioma patients; Proceedings of the 25th Annual International Conference of the IEEE Engineering in Medicine and Biology Society; Cancun, Mexico. 2003. pp. 482–485. [Google Scholar]
- 32.Hammen T, Stadlbauer A, Tomandl B, Ganslandt O, Pauli E, Huk W, Neundörfer B, Stefan H. Short TE single-voxel 1H-MR spectroscopy of hippocampal structures in healthy adults at 1.5 Tesla—how reproducible are the results? NMR Biomed. 2005;18:195–201. doi: 10.1002/nbm.958. [DOI] [PubMed] [Google Scholar]
- 33.Buirski G, Silberstein M. They symptomatic lumbar disc in patients with low-back pain. Magnetic resonance imaging appearances in both a symptomatic and control population. Spine. 1993;18:1808–1811. doi: 10.1097/00007632-199310000-00016. [DOI] [PubMed] [Google Scholar]
- 34.Frahm J, Bruhn H, Gyngell ML, Merboldt KD, Hanlcke W, Sauter R. Localized proton NMR spectroscopy in different regions of the human brain in vivo. Relaxation times and concentrations of cerebral metabolites. Magn Reson Med. 1989;9:79–93. doi: 10.1002/mrm.1910110105. [DOI] [PubMed] [Google Scholar]
- 35.Williams SR, Gadian DG, Proctor E. A method for lactate detection in vivo by spectral editing without the need for double irradiation. J Magn Reson. 1986;66:562–567. [Google Scholar]
- 36.Sotak CH, Freeman DM, Hurd RE. The unequivocal determination of in vivo lactic acid using two dimensional double-quantum coherence-transfer spectroscopy. J Magn Reson. 1988;78:382–388. [Google Scholar]


