Abstract
Mining operations are a potential source of metal and metalloid contamination by atmospheric particulate generated from smelting activities, as well as from erosion of mine tailings. In this work, we show how lead isotopes can be used for source apportionment of metal and metalloid contaminants from the site of an active copper mine. Analysis of atmospheric aerosol shows two distinct isotopic signatures: one prevalent in fine particles (< 1 μm aerodynamic diameter) while the other corresponds to coarse particles as well as particles in all size ranges from a nearby urban environment. The lead isotopic ratios found in the fine particles are equal to those of the mine that provides the ore to the smelter. Topsoil samples at the mining site show concentrations of Pb and As decreasing with distance from the smelter. Isotopic ratios for the sample closest to the smelter (650 m) and from topsoil at all sample locations, extending to more than 1 km from the smelter, were similar to those found in fine particles in atmospheric dust. The results validate the use of lead isotope signatures for source apportionment of metal and metalloid contaminants transported by atmospheric particulate.
Keywords: Lead isotopes, Dust and aerosol, MOUDI, Smelting, Metal and metalloid contamination
1. Introduction
Metal- and metalloid-laden dust and aerosol particles are produced during mining operations in a wide range of sizes. Coarse particles (> 1 μm aerodynamic diameter) are produced mainly by mechanical action like grinding and wind erosion (Csavina et al. 2011) while fine particles (< 1 μm) are the result of molten ore processing and smelting, being produced by condensation and coagulation of vapors (Jacob, 1999; Banic et al., 2006). The impact of airborne particles on human health depends on particle diameter and composition. Particles larger than 10 μm are generally filtered out by the upper respiratory tract while particles smaller than 10 μm (PM10) are inhaled and may be transported to the lungs where they are phagocytized by alveolar macrophages and transported to the blood stream (Zheng et al., 2004). The composition of the particles also plays a key role in health effects. Of particular concern is the presence of lead and other contaminants (e.g., arsenic) in atmospheric dust and aerosol that result from mining activities (Csavina et al., 2011, 2012; Mackay et al., 2013).
The atmosphere is the major initial recipient of lead among all environmental compartments. Global anthropogenic sources of lead are at least one order of magnitude higher than natural sources (Komárek et al., 2008). The determination of potential sources of atmospheric lead is important since its production can be controlled in advance, minimizing unwanted exposures to this toxic metal. However, it is difficult to discriminate between sources of lead and other metal and metalloid contaminants by only knowing their total concentration (Hopper et al., 1991). For this reason, lead isotopic analysis has been introduced as a “fingerprinting” technique for lead contamination. Each source of lead may have a specific isotopic composition and the differences in this composition may be used to discriminate between possible sources (Komárek et al., 2008).
The use of lead isotopes to determine possible sources has been widely reported (e.g., Munksgaard and Parry, 1998; Zheng et al., 2004; Chen et al., 2005; Grousset et al., 1994; Veysseyre et al., 2001; Kurkjian et al., 2002). Lead has four stable isotopes (average molar abundances in parenthesis): 204Pb (1.4 %), 206Pb (24.1 %), 207Pb (22.1 %) and 208Pb (52.4 %). 204Pb is the only non-radiogenic isotope and its abundance has remained constant over time (Russell and Farquhar, 1960). The abundances of 206Pb, 207Pb and 208Pb in minerals vary because they are derived from the decay of 238U, 235U and 232Th, respectively (Adgate et al., 1998). Isotopic composition of the radiogenic isotopes varies in different ores, depending on the age of their geological formation (Faure, 1986). An advantage of the use of lead isotopes for source apportionment is the fact that isotopic fractionation does not happen in industrial or environmental processes (Ault et al., 1970), owing mainly to the high atomic mass of lead. Lead isotopic composition is often expressed in terms of the concentration ratios 208Pb/206Pb and 207Pb/206Pb (Chen et al., 2008; Zheng et al. 2004).
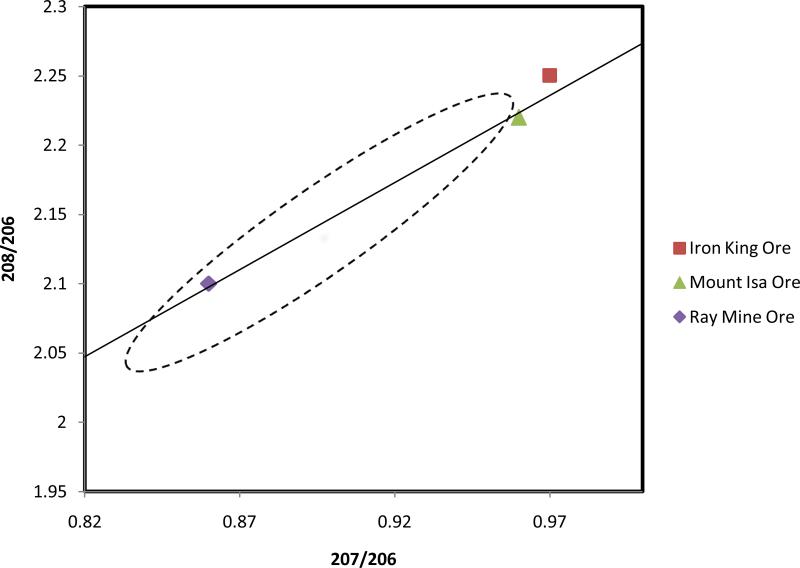
Cumming and Richards (1975) observed that a plot of the concentration ratios 208Pb/206Pb vs. 207Pb/206Pb led to approximately a single monotonically increasing curve for all mineral samples analyzed. The radioactive decay of 238U, 235U and 232Th in terms of their relative abundances and half-lives has led to an increase in the concentration of 206Pb over time. As a consequence, the ratios 207Pb/206Pb and 208Pb/206Pb have decreased over time (Mukai et al., 2001). Figure 1 shows the plot devised by Cumming and Richards, often called “growth curve”, and the distribution along the curve of three different ores: The Iron King mine (Arizona, USA) is the oldest ore of those shown with an age of 1800 million years (Anderson and Guilbert, 1979), the Mount Isa ore (Queensland, Australia) has an age of approximately 1600 million years (Cumming and Richards, 1975) and the Ray Mine ore (Arizona, USA) has an age of 70 million years (Bouse et al., 1999).
Figure 1.
The Cumming and Richards growth curve (solid line) for lead isotope concentration ratios (adapted from Chen et al. 2008), showing three mineral ores. The dashed region includes data from extensive sources (86 different sites in 35 countries) reported by Bollhöfer and Rosman (2001).
In this work, we sampled atmospheric dust and aerosol at two different sites in Arizona: The first site is located in the towns of Hayden and Winkelman, where a copper mine and smelter currently operate; while the second site is located in Tucson, representing a local urban environment. The main objectives of this work were:
To assess if lead isotopic analysis can be used for source apportionment of airborne particular matter associated with mining operations.
To investigate the extent of soil contamination in the vicinity of the smelting complex.
2. Materials and Methods
2.1 Study Site
The Hayden site is located approximately 80 km northeast of Tucson, Arizona. It is comprised of two towns − Hayden and Winkelman − with a combined population of approximately 1200. Currently, the site includes a concentrator, a copper smelter and tailings facilities. It is located at the confluence of the Gila and San Pedro Rivers. The processed copper ore originates from various mines in the vicinity, including the Ray mine. The Ray mine consist mainly of a porphyry copper deposit hosted in Pinal schist and Pioneer shale (w.mindat.org/loc-3377.html). In 2005, soil analysis showed that arsenic, lead and copper levels exceeded their respective residential soil remediation levels (EPA 2012). The Environmental protection agency has reported elevated concentrations of arsenic, lead, copper, chromium and cadmium in atmospheric air samples in Hayden and Winkelman (EPA 20012).
2.2 Sampling
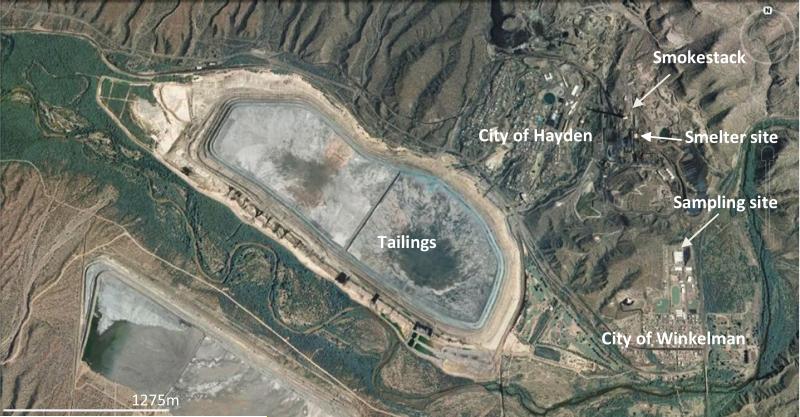
The sampling site was located on the roof of a single-story High School building, approximately 2 km E of the mine tailings impoundment and 1 km SSE of the smelter (Figure 2). A weather station and data logger (CR800, Campbell Scientific) providing information about temperature, relative humidity, wind speed and wind direction, was also present at the site. Wind speed and wind direction were analyzed with WindRose Pro (Enviroware) software. In Tucson, AZ, the sampling site was located on the roof of the five-story Physics and Atmospheric Sciences building at the University of Arizona.
Figure 2.
Satellite picture of the sampling site in Hayden, AZ, with locations of mining and sampling operations. Source: Google Earth.
A ten-stage micro-orifice uniform deposit impactor (MOUDI; M110-R, MSP Corporation) (Marple et al. 1991) was used to collect atmospheric dust and aerosol. The MOUDI was operated at a flow rate of 30 L min-1 for 96-h sampling periods. Sampling was performed in two modes: regular sampling was done by operating the MOUDI continuously for 96 h, while programmed sampling was performed by operating the MOUDI only for specified wind speeds and directions until total operating time reached 96 h. The calibrated cut points (d50-values) for the MOUDI sampler are 18, 9.9, 6.2, 3.1, 1.8, 1.0, 0.55, 0.32, 0.18, 0.10 and 0.054 μm equivalent aerodynamic diameters. Teflon substrates (PTFE membrane, 2-μm pore size, 46.2 mm diameter, Whatman) were used for sample collection. The substrates were cleaned sequentially by DI water and methanol before use. They were transported to and from the field site in enclosed impactor holders (MSP Corporation). Substrates were weighed before and after sampling using EPA class I equivalent methods on an ultra-microbalance (Mettler Toledo XP2U). Aluminum substrates (47 mm, MSP Corporation) were occasionally used for electron microscope analysis samples.
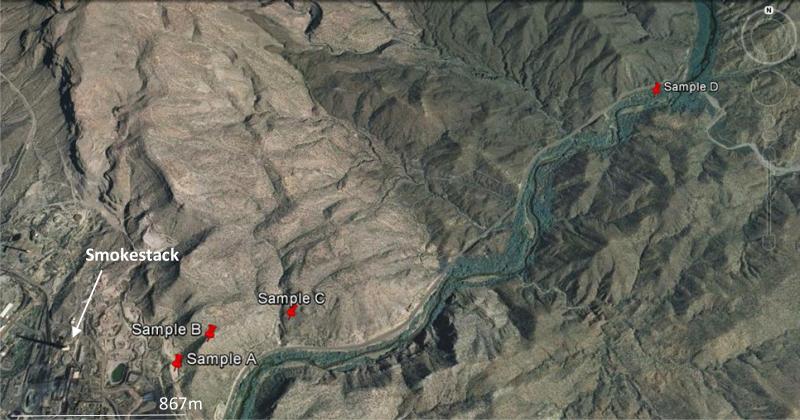
Soil samples were taken at Hayden at four different distances from the smelting complex in a straight line transect NE of the smelter, a prevailing wind direction (Figure 3). Samples were collected at different depths to obtain a vertical profile of the contamination: 0 - 3 mm, 3 - 6 mm, 6 - 9 mm, at 50 mm, and finally at 100 mm below the surface. Final samples at each site and depth were obtained by mixing three different samples. The composite samples were dried for 10 hours at a temperature of 110 °C and then sieved (ASTM, 2010) through a 0.84 mm sieve to discard coarser fractions.
Figure 3.
Satellite picture showing the four soil sampling locations (labeled A to D) at the Hayden site. The shadow of the 305 m high smokestack can be seen towards the WNW. Approximate distances of the sampling points from the smelter location: A – 650 m, B – 900 m, C – 1300 m, D – 4000 m. Altitudes with respect to sea level of sampling points are: A – 680 m, B – 760 m, C – 710 m, D – 620 m. Source: Google Earth.
2.3 Sample Preparation
Exposed Teflon substrates were transferred to glass vials and extracted with 15 mL of aqua regia (1.03 M HNO3/2.23 M HCl, trace-metal grade) in a sonicator at 80 °C for 60 minutes (Harper et al., 1983). Aliquots of 1.2 mL were diluted to 4 mL with deionized water before analysis. Soil samples were extracted in the same way, using 5 mg of soil in each sample. Prior to lead isotope analysis, samples were concentrated on a hot plate. The extraction method was verified by comparing it with the use of concentrated HNO3, or a combination of concentrated HNO3/H2O2 solutions in conjunction with microwave digestion, all of which yielded similar concentrations for representative samples (Gonzales et al., 2014), which suggests that element measures represent total acid extractable concentrations.
2.4 Sample Analysis
An ICP-MS (Agilent 7700X with Octopole reaction system) was used for the determination of lead, arsenic and cadmium, as well as lead isotopes. The equipment was tuned for robust plasma conditions to reduce the formation of oxides to less than 2%. Certified calibration standards from Accustandard were prepared with MiliQ water, 0.669 M HCl (Fisher, trace-metal grade) and 0.309 M HNO3 (EMD, Omnitrace). National Institute of Standards and Technology (NIST) standard reference material (SRM 1643e trace elements in water) was analyzed with each set of samples. NIST SRM 981 (lead isotopic standard) was used for calibration of lead isotope measurements. The analytical precision of lead isotopic ratios was under 0.5 % for the concentration ratios Pb207/Pb206 and Pb208/Pb206.
Morphologic and elemental analyses were done at University Spectroscopy and Imaging Facilities of the University of Arizona using a field emission scanning electron microscope (Hitachi S-4800 Type II SEM) coupled to energy dispersive spectroscopy (ThermoNORAN NSS EDS). Aluminum substrates were used in the MOUDI when collecting samples for this purpose to improve resolution.
3. Results and Discussion
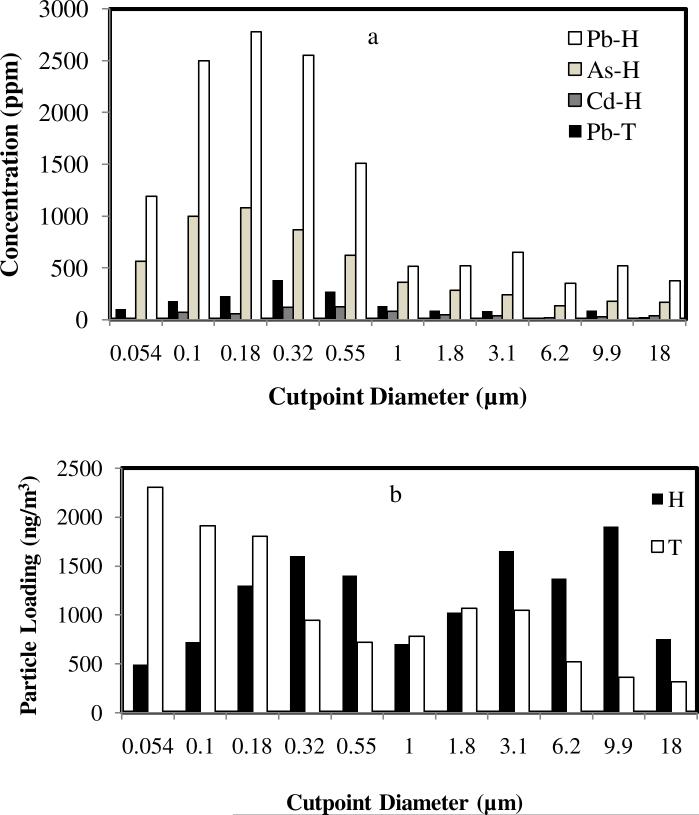
Figure 4a shows a comparison of concentrations in atmospheric particulate at the two field sites for a representative sampling period. Contaminant concentrations follow a bimodal distribution at the Hayden site with maxima around 0.18 and 9.9 μm. This trend was consistently seen over sampling periods spanning several years of sampling (Csavina et al., 2011). The highest concentration of contaminants is present in the accumulation mode (particles between 0.1 and 1 μm) (Seinfeld and Pandis, 2006). Smelting and high-temperature processes release submicron particles formed by condensation of vapors, which coalesce to enrich the accumulation mode. Note that both contaminant concentration and particle mass concentration follow a bimodal distribution at the Hayden site.
Figure 4.
(a) Concentrations (wt/wt) of As, Cd and Pb as a function of particle size from representative (consecutive 96-hour operation) MOUDI samples of dust and aerosol in atmospheric air taken at the two sites (H – Hayden site, T – Tucson site). Arsenic and cadmium were below detection limits in the Tucson samples. (b) Mass concentration of total particles as a function of particle size for the sample in (a).
Lead and arsenic concentrations of the mine tailings impoundment in Hayden are 14.0 ± 6.8 and 46.4 ± 33.7 ppm (EPA, 2012), respectively, which suggests that the main source of atmospheric contamination at this site is smelting activity and not the erosion of mine tailings, given the high contaminant concentrations in atmospheric particulate (100 – 1000 ppm, Figure 4a).
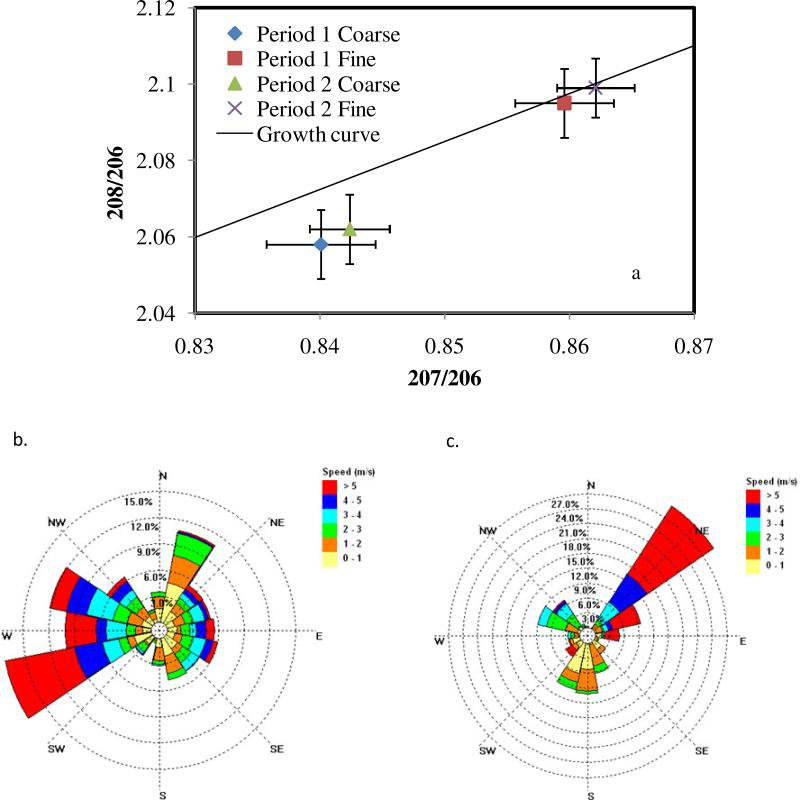
Lead isotope analysis was performed at the two sites of study. Particles in the range of 0.32 - 0.55 μm (denoted as fine particles here) and 3.1 - 6.2 μm (coarse particles) were analyzed to obtain the lead isotopic composition. Figure 5 shows the lead isotope ratios associated with two sampling periods at Hayden, along with the corresponding wind roses. Two different isotopic signatures for coarse and fine particles are evident (Figure 5a), which suggests the existence of two different atmospheric lead sources. The isotopic ratios of the fine particles coincide with those of the Ray Mine (Figure 1) which is the main ore source for the smelter. This is evidence that the lead found in the fine particles is associated with condensation of high-temperature vapors produced at the smelting site. The different isotopic signature of the coarse particles suggests a different origin, possibly related to the background lead present in the area (see below). It is interesting to note that the two sampling periods shown in Figure 5 corresponded to completely different average wind directions. In fact, the concentration of lead in the fine particles during period 1 (12.5 ng/m3, wind from WSW) was around twice the concentration for period 2 (6.2 ng/m3,wind from NE). Note that during period 1, wind patterns favor the direction from the smelter to the sampling site.
Figure 5.
(a) Lead isotope concentration ratios obtained during MOUDI sampling for two 96- hour sampling periods at the Hayden site. Error bars show standard deviations of triplicate measurements by ICP-MS; (b) Wind rose for period 1; (c) Wind rose for period 2.
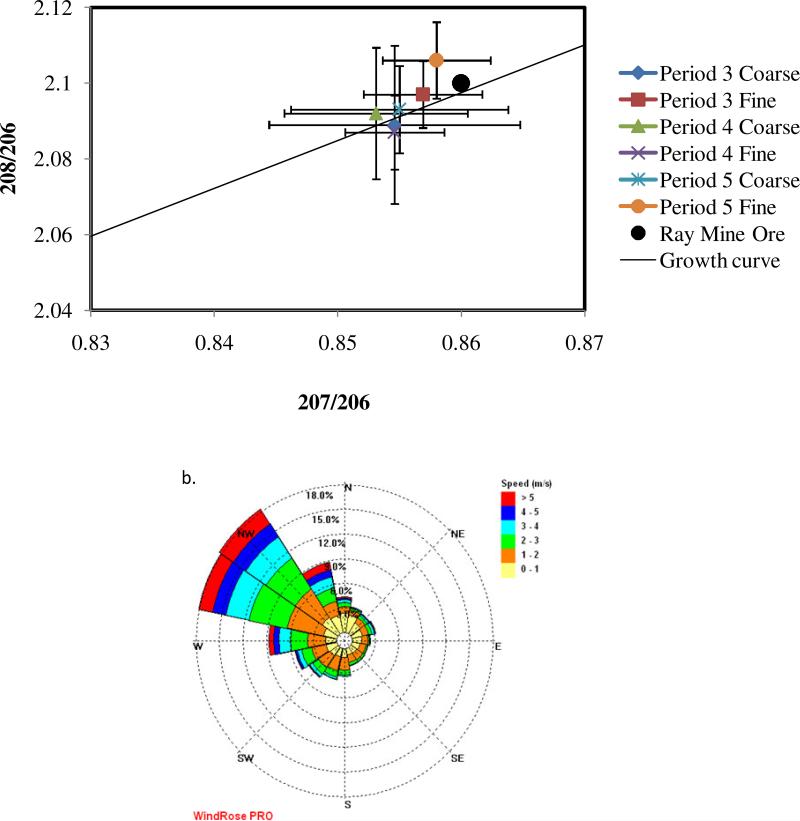
Three different programmed sets of samples were taken with the MOUDI at the Hayden site (periods 3 to 5). The MOUDI was programmed to sample only when the wind was coming from the smelting area (300-360°). Results obtained from these samples, as well as a representative wind rose of the sampling periods are presented in Figure 6. Figure 6a shows that both coarse and fine particles exhibit only one isotopic signature with high ratios similar to the results shown on Figure 5a for fine particles. This indicates that for the programmed samples the smelter was the predominant source. Note that the isotopic ratios for all the sampling periods are within experimental error, which suggests that smelter emissions have a consistent signature, that is, the ore processed in the smelter seems to have the same origin or, at least, the same lead isotopic composition. This does not mean dust and aerosol from other sources were absent. However, since the lead concentration is appreciably higher for samples coming from the smelter area, their lead isotopic signature predominates. We also note that due to the complex topography of the Hayden site, there is no certainty that winds followed the general line of sight (300-360°).
Figure 6.
(a) Lead isotopic ratios obtained from MOUDI samples during programmed sampling when wind direction was from the smelter to the sampling site (300-360°) at the Hayden site; (b) Representative wind rose of the programmed sampling periods.
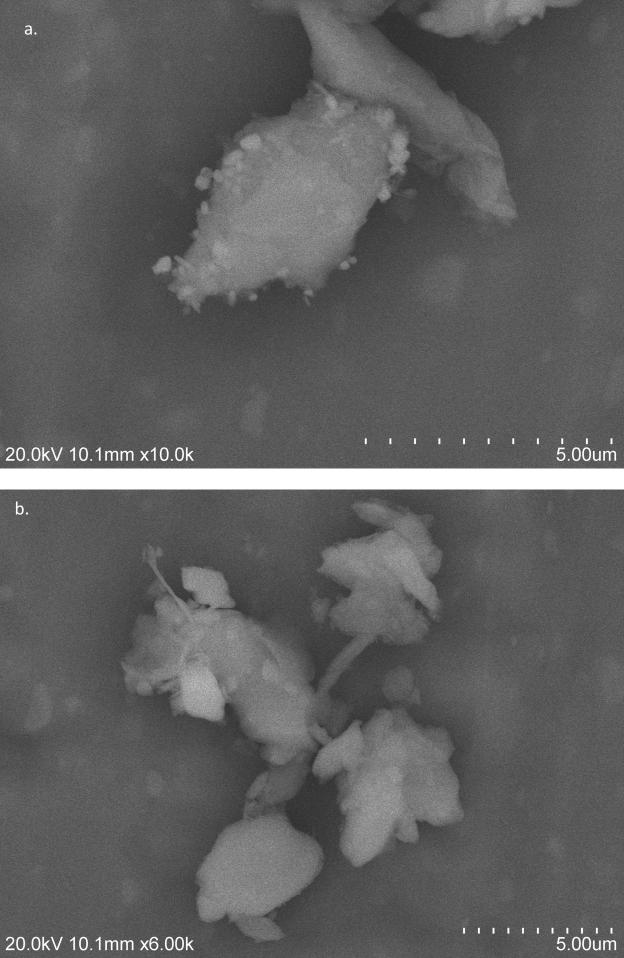
The programmed samples were analyzed by scanning electron microscopy (SEM). Sample of images obtained are shown in Figure 7. Deposition of fine particles onto coarse particles is clearly observed in Figure 7a. Energy dispersive spectroscopy (EDS) was used to determine the content of lead in the fine particles attached; it was found that these particles contain lead in concentrations as high as 14.85 ± 1.88 % by weight. Figure 7b shows coarse particles in which the attachment of fine particles is absent. The lead content of these particles was negligible, as determined by EDS. This confirms that the second lead signature seen in the MOUDI samples collected without discriminating for wind direction (coarse particles in Figure 5a) is, in this case, masked by the prevalence of lead-enriched aerosol in both fine and coarse particles.
Figure 7.
Scanning electron microscope images from MOUDI samples from period 3: (a) Some coarse particles show fine particles attached to them, while (b) other coarse particles are free of fine particles.
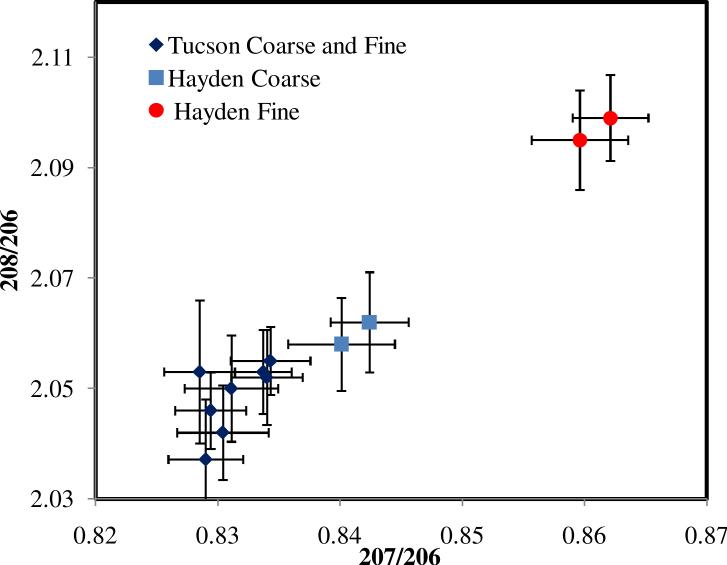
The coarse particle lead ratios (Figure 5a) were similar to those found in samples taken at the Tucson site, which is free of mining activity (Figure 8). Coarse particles may be associated with wind-blown soil from the site. For Tucson, coarse and fine particles had the same lead isotopic ratios. This result suggests that the Tucson lead, which coincides with the Hayden lead in coarse particles, is unaffected by smelting activities, and it might be representative of a background source of lead common to the region, presumably legacy lead from fuel sources, since this isotopic signature is similar to that of lead used as a gasoline additive, which originates from Missouri ores: 208Pb/206Pb = 2.07, 207Pb/206Pb = 0.84 (Sutherland et al., 2003; Bollhöfer and Rosman, 2001).
Figure 8.
Comparison between lead isotopic ratios obtained in atmospheric dust and aerosol in Hayden and Tucson, AZ.
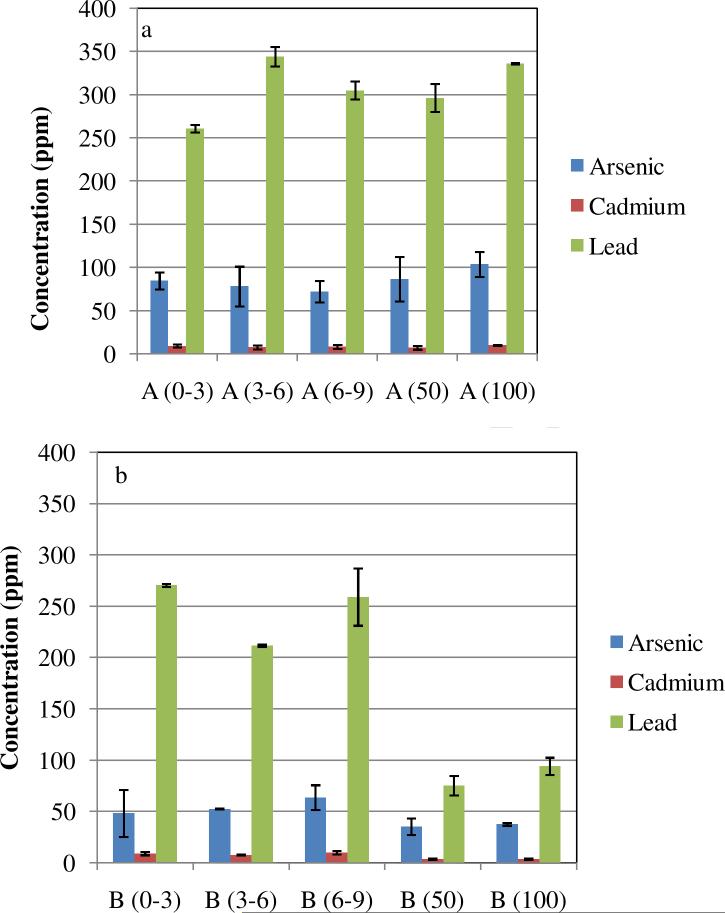
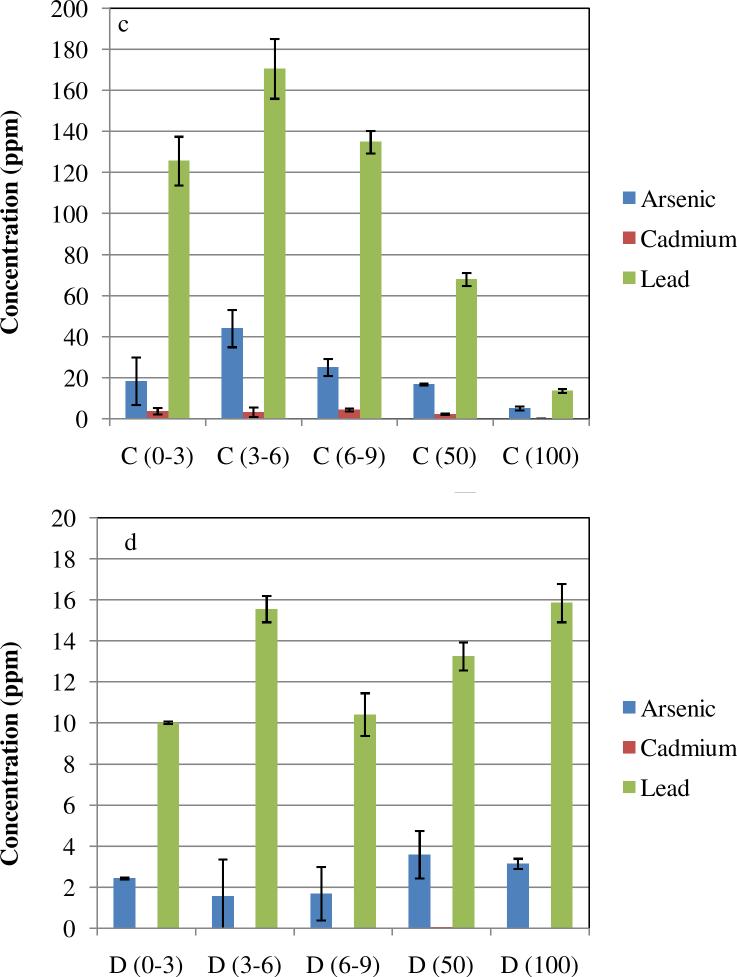
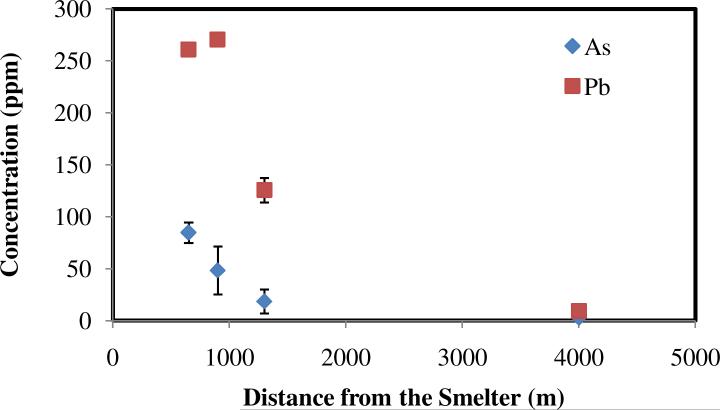
The results presented above point to a significant atmospheric contamination at the Hayden site that originates from smelting activities. We investigated how this contamination affects the soil in the vicinity of the smelter. Soil samples were analyzed for Pb, As and Cd at various distances from the smelter and various depths. Contaminant concentrations are shown in Figures 9 and 10. As expected, contaminant concentrations in topsoil decreased monotonically with distance from the smelter (Figure 10).
Figure 9.
Total lead, cadmium and arsenic in Hayden site soil samples; Distance from the smelter: (a) 650 m ; (b) 900 m; (c) 1300 m; (d) 4000 m. Horizontal axis values represents range of depth of samples in mm.
Figure 10.
Lead and arsenic concentrations in topsoil (0-3 mm depth) at the Hayden site as a function of distance from the smelter.
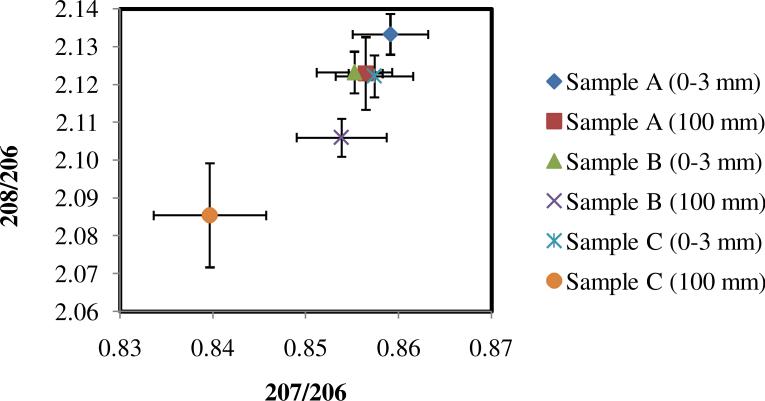
Lead isotopic analyses were performed on soil samples A, B and C (Figure 3) to determine the source of contamination and possible effect of the deposition of smelter fine particles on the soil. Sample D was not analyzed for lead isotopes due to the low concentration of lead present. For each of the samples analyzed, only the top and the bottom layers were considered. Figure 11 shows the isotopic ratios obtained for the different soil samples. Isotopic ratios obtained in the sample closest to the smelter (sample A) are similar to the ratios obtained for the airborne fine particles in the atmosphere at Hayden (Figure 5). Similar ratios were observed in the 100 mm deep sample, which indicates a similar source of lead throughout the soil profile analyzed. Sampling point A is located only 650 m from the smelter. These results indicate that, despite weathering and rain runoff, lead and arsenic accumulate in the soil, and the contamination extends uniformly through at least 10 cm of depth (Figure 9a). Lead isotope results provide strong evidence that the contamination originates in atmospheric transport of smelter emissions.
Figure 11.
Isotopic ratios for soil samples in Hayden. Distance from the smelter specified in Figure 3. Numbers in parentheses represent the depth of the sample.
Isotopic ratios for the topsoil of sample B (Figure 11) are again close to the smelter emissions. However, the ratios for the deepest sample (100 mm) definitely indicate the presence of a different source mixed with the emissions source. This trend becomes more evident for sample C (1300 m), for which the topsoil layer still exhibits the smelter isotopic ratios, but the 100 mm depth sample shows significantly lower ratios, which trend in the direction of the presumed background measured in the coarse atmospheric particles (compare with Figure 5a).
4. Conclusions
The results obtained in this work demonstrate that lead isotope analysis can be used for source apportionment of metal and metalloid contaminants from mining operations. At the mining site in Hayden, AZ, two different lead sources were identified: one associated with fine particles originating from condensation of high temperature vapors emitted at the smelter site, and another one associated with a regional background, which shows the same isotopic composition as legacy lead used in fuels. Topsoil samples near the smelting site show concentrations of Pb and As decreasing with distance from the smelter but lead isotope ratios similar to those found in fine particles in atmospheric dust, which are characteristic of smelting emissions. On the other hand, isotope ratios at a soil depth of 100 mm decrease with distance from the smelter. These results are consistent with a contaminant deposition pattern from windblown particles from the smelter site to surrounding soils. These results validate the use of lead isotope signatures for source apportionment of metal and metalloid contaminants transported by atmospheric particulate.
Highlights.
- Lead isotopes used for source apportionment of lead contamination at mining sites
- Atmospheric particulate and soils exhibit lead and arsenic contamination
- Contaminant soil deposition patterns can be determined from lead isotopic analysis
Acknowledgements
This work was supported by grant number P42 ES04940 from the National Institute of Environmental Health Sciences (NIEHS), National Institutes of Health (NIH). The views of authors do not necessarily represent those of the NIEHS, NIH.
Footnotes
Publisher's Disclaimer: This is a PDF file of an unedited manuscript that has been accepted for publication. As a service to our customers we are providing this early version of the manuscript. The manuscript will undergo copyediting, typesetting, and review of the resulting proof before it is published in its final citable form. Please note that during the production process errors may be discovered which could affect the content, and all legal disclaimers that apply to the journal pertain.
References
- Adgate JL, Rhoads GG, Lioy PJ. The use of isotope ratios to apportion sources of lead in Jersey City, NJ, house dust wipe samples. Sci Total Environ. 1998;221:2–3. doi: 10.1016/s0048-9697(98)00282-4. [DOI] [PubMed] [Google Scholar]
- ASTM (American Society for Testing and Materials) Standard test methods for laboratory determination of water (moisture) content of soil and rock by mass. Report D2216-10. 2010 [Google Scholar]
- Anderson P, Guilbert JM. Precambrian massive sulfide deposits of Arizona- a distinct metallogenic epoch and province. Nev Bur Mines Geol Rep. 1979;33:39–48. [Google Scholar]
- Ault WU, Senechal RG, Erlebach WE. Isotopic composition as a natural tracer of lead in the environment. Environ Sci Technol. 1970;4:305–13. [Google Scholar]
- Banic CM, Leaitch WR, Strawbridge KB, Tanabe R, Wong HKT, Gariepy C, Simonetti A, Nejedly Z, Campbell JL, Lu J. The physical and chemical evolution of aerosols in smelter and power plant plumes: An airborne study. Geochemistry: Explor Environ Anal. 2006;6:111–20. [Google Scholar]
- Bollhöfer A, Rosman KJR. Isotopic source signatures for atmospheric lead: The northern hemisphere. Geochim Cosmochim Acta. 2001;65:1727–40. [Google Scholar]
- Bouse RM, Ruiz J, Titley SR, Tosdal RM, Wooden JL. Lead isotope compositions of late Cretaceous and early Tertiary igneous rocks and sulfide minerals in Arizona: Implications for the sources of plutons and metals in porphyry copper deposits. Econ Geol. 1999;94:211–44. [Google Scholar]
- Chen J, Tan M, Li Y, Zhang Y, Lu W, Tong Y, Zhang G, Li Y. A lead isotope record of Shanghai atmospheric lead emissions in total suspended particles during the period of phasing out of leaded gasoline. Atmo Environ. 2005;39:1245–53. [Google Scholar]
- Chen J, Tan M, Li Y, Zheng J, Zhang Y, Shan Z, Zhang G, Li Y. Characteristics of trace elements and lead isotope ratios in PM(2.5) from four sites in Shanghai. J Hazard Mater. 2008;156:1–3. doi: 10.1016/j.jhazmat.2007.11.122. [DOI] [PubMed] [Google Scholar]
- Csavina J, Landazuri A, Wonaschutz A, Ryne K, Rheinheimer P, Barbaris B, Conant W, Sáez AE, Betterton EA. Metal and metalloid contaminants in atmospheric aerosols from mining operations. Water Air Soil Poll. 2011;221:145–57. doi: 10.1007/s11270-011-0777-x. [DOI] [PMC free article] [PubMed] [Google Scholar]
- Csavina J, Field J, Taylor MP, Gao S, Landazuri A, Betterton EA, Sáez AE. A review on the importance of metals and metalloids in atmospheric dust and aerosol from mining operations. Sci Total Environ. 2012;433:58–73. doi: 10.1016/j.scitotenv.2012.06.013. [DOI] [PMC free article] [PubMed] [Google Scholar]
- Cumming GL, Richards JR. Ore lead isotope ratios in a continuously changing Earth. Earth Planet Sci Lett. 1975;28:155–71. [Google Scholar]
- EPA (Environmental Protection Agency) [2012];Asarco Hayden Plant. http://yosemite.epa.gov/r9/sfund/r9sfdocw.nsf/7508188dd3c99a2a8825742600743735/3940634a9aec311e88257478006736ce!OpenDocument.
- Faure G. Principles of isotope geology. Wiley; New York: 1986. [Google Scholar]
- Gonzales P, Felix O, Alexander C, Lutz E, Ela W, Sáez AE. Laboratory dust generation and size-dependent characterization ofmetal and metalloid-contaminated mine tailings deposits. J Hazardous Mat. 2014;280:619–6. doi: 10.1016/j.jhazmat.2014.09.002. [DOI] [PubMed] [Google Scholar]
- Grousset FE, Quetel CR, Thomas B, Buat-Menard P, Donard OF, Bucher A. Transient Pb isotopic signatures in the western European atmosphere. Environ Sci Technol. 1994;28:1605–8. doi: 10.1021/es00058a011. [DOI] [PubMed] [Google Scholar]
- Harper SL, Walling JF, Holland DM, Pranger LJ. Simplex optimization of multielement ultrasonic extraction of atmospheric particulates. Anal Chem. 1983;55:1553–7. [Google Scholar]
- Hopper JF, Ross HB, Sturges WT, Barrie LA. Regional source discrimination of atmospheric aerosols in europe using the isotopic composition of lead. Tellus. 1991;43:45–60. [Google Scholar]
- Jacob DJ. Introduction to atmospheric chemistry. Princeton University Press; Princeton: 1999. [Google Scholar]
- Komárek M, Ettler V, Chrastný V, Mihaljevi M. Lead isotopes in environmental sciences: A review. Environ Int. 2008;34:562–77. doi: 10.1016/j.envint.2007.10.005. [DOI] [PubMed] [Google Scholar]
- Kurkjian R, Dunlap C, Flegal AR. Lead isotope tracking of atmospheric response to post-industrial conditions in Yerevan, Armenia. Atmo Environ. 2002;36:1421–9. [Google Scholar]
- Mackay AK, Taylor MP, Munksgaard NC, Hudson-Edwards KA, Burn-Nunes L. Identification of environmental lead sources and pathways in a mining and smelting town: Mount Isa, Australia. Environ Poll. 2013;180:304–11. doi: 10.1016/j.envpol.2013.05.007. [DOI] [PubMed] [Google Scholar]
- Marple VA, Rubow KL, Behm SM. A microorifice uniform deposit impactor (MOUDI): Description, calibration, and use. Aerosol Sci Technol. 1991;14:434–46. [Google Scholar]
- Mukai H, Machida T, Tanaka A, Vera YP, Uematsu M. Lead isotope ratios in the urban air of eastern and central Russia. Atmo Environ. 2001;35:2783–93. [Google Scholar]
- Munksgaard NC, Parry DL. Lead isotope ratios determined by ICP-MS: Monitoring of mining-derived metal particulates in atmospheric fallout, Northern Territory, Australia. Sci Total Environ. 1998;217:113–25. [Google Scholar]
- Russell RD, Farquhar RM. Lead isotopes in geology. Interscience Publishers; New York: 1960. [Google Scholar]
- Seinfeld JH, Pandis SN. From air pollution to climate change. Wiley; New York: 2006. Atmospheric chemistry and physics. [Google Scholar]
- Sutherland RA, Day JP, Bussen JO. Lead concentrations, isotope ratios, and source apportionment in road deposited sediments, Honolulu, Oahu, Hawaii. Water Air Soil Poll. 2003;142:165–86. [Google Scholar]
- Veysseyre AM, Bollhöfer AF, Rosman KJ, Ferrari CP, Boutron CF. Tracing the origin of pollution in French alpine snow and aerosols using lead isotopic ratios. Environ Sci Technol. 2001;35:4463–9. doi: 10.1021/es0105717. [DOI] [PubMed] [Google Scholar]
- Zheng J, Tan M, Shibata Y, Tanaka A, Li Y, Zhang G, Zhang Y, Shan Z. Characteristics of lead isotope ratios and elemental concentrations in PM10 fraction of airborne particulate matter in Shanghai after the phase-out of leaded gasoline. Atmo Environ. 2004;38:1191–200. [Google Scholar]


