

Abstract
Early clinical studies suggested infiltrating T cells might be associated with poor outcomes in prostate cancer (PCa) patients. The detailed mechanisms how T cells contribute to PCa progression, however, remained unclear. Here, we found PCa cells have a better capacity to recruit more CD4(+) T cells than the surrounding normal prostate cells via secreting more chemokines‐CXCL9. The consequences of more recruited CD4(+) T cells to PCa might then lead to enhance PCa cell invasion. Mechanism dissection revealed that infiltrating CD4(+) T cells might function through the modulation of FGF11→miRNA‐541 signals to suppress PCa androgen receptor (AR) signals. The suppressed AR signals might then alter the MMP9 signals to promote the PCa cell invasion. Importantly, suppressed AR signals via AR‐siRNA or anti‐androgen Enzalutamide in PCa cells also enhanced the recruitment of T cells and the consequences of this positive feed back regulation could then enhance the PCa cell invasion. Targeting these newly identified signals via FGF11‐siRNA, miRNA‐541 inhibitor or MMP9 inhibitor all led to partially reverse the enhanced PCa cell invasion. Results from in vivo mouse models also confirmed the in vitro cell lines in co‐culture studies. Together, these results concluded that infiltrating CD4(+) T cells could promote PCa metastasis via modulation of FGF11→miRNA‐541→AR→MMP9 signaling. Targeting these newly identified signals may provide us a new potential therapeutic approach to better battle PCa metastasis.
Keywords: Prostate cancer, T cells, Androgen receptor, Tumor metastasis, Tumor microenvironment
Highlights
We show the distribution of CD4+T cell in prostate cancer (PCa) tissue.
We show the potential risk of CD4+T cell effects on enhancing PCa metastasis.
We find the essential role of the cross‐talk between FGF11 and AR signaling in PCa.
CD4+T cell and FGF11‐AR pathway may become a new target for the future PCa therapy.
1. Introduction
The incidence of prostate cancer (PCa) across the Western World is increasing at an alarming rate and becoming the most common form of cancer in men in the USA and the second leading cause of cancer death (Jemal et al., 2008). Many factors, including age, family history, and diet may influence the PCa development, however, the detailed mechanism(s) remain unclear (Maitland and Collins, 2008).
The androgen receptor (AR) has been recognized as the key player in the PCa progression (Chang et al., 2013, 1988, 2004, 2013). Importantly, more and more data suggested that AR might have duel roles to either promote PCa proliferation or suppress PCa metastasis (Lai et al., 2012, 2013, 2013, 2008, 2008, 2010). Using knocked‐out AR in selective cells, Niu et al. (Niu et al., 2008, 2008, 2010) and Lai et al. (Lai et al., 2012) concluded that PCa stromal AR could promote PCa progression and AR in epithelial luminal cells could also play positive roles to maintain PCa survival. However, AR in epithelial basal intermediate cells might play a suppressor role in PCa metastasis (Niu et al., 2008, 2008, 2010). Other reports suggested that AR might function as suppressor in PCa metastasis via modulation of the epithelial–mesenchymal transition (EMT) and stem cell population (Sun et al., 2012; Tu and Lin, 2012).
The prostate tumor microenvironment (pTME) with many inflammatory immune cells may play important roles during PCa development and progression (Fang et al., 2013; Izumi et al., 2013; Lin et al., 2013a; Omabe and Ezeani, 2011; Reebye et al., 2011; Vendramini‐Costa and Carvalho, 2012; Wang et al., 2013; Yates, 2011). Among these infiltrating immune cells, T cells with CD4(+) and/or CD8(+) were found to be associated with PCa (Steiner et al., 2002) and early clinical studies suggested infiltrated CD4(+) T cells might be linked to the poor outcome in patients with PCa (McArdle et al., 2004). The detailed mechanism how these CD4(+) T cells were recruited to the PCa and how they contributed to the PCa metastasis, however, remained unclear.
Here we demonstrated that infiltrated CD4(+) T cells could enhance PCa cell invasion and mechanism dissection found the infiltrated CD4(+) T cells might go through modulation of FGF11→miRNA‐541→AR→MMP9 signaling to influence the PCa metastasis.
2. Materials and methods
2.1. Patients
We found 20 patients whose biopsies showed clinical evidence of PCa by biopsy. All these patients were treated with radical prostatectomy and no other therapy before surgery. Each patient biopsy tissue was divided into 2 groups: one was the PCa area and the other was the adjacent normal tissue area. The detailed information of patients was shown in Table 1.
Table 1.
The clinical information from 20 PCa patients.
| Patient number (n) | 20 |
| Age (years) | 63.8 ± 5.6 |
| *tPSA (ng/ml) | 21.57 ± 19.63 |
| **f/tPSA | 0.12 ± 0.05 |
| TNM2002 AJCC* | |
| T1 | 15 |
| T2 | 5 |
| pT2a | 3 |
| pT2b | 2 |
| Gleason score | |
| Gleason 6 | 17 |
| Gleason 7 | 1 |
| Gleason 8 | 2 |
*tPSA: total prostate‐specific antigen.
**f/tPSA: the ratio between free PSA and total PSA.
2.2. Cell culture
The LNCaP and CWR22RV1 cell lines were purchased from the American Type Culture Collection (Rockville, MD, USA), the C4‐2 cell line was a gift from Dr. Jer‐Tsong Hsieh (Southwestern Medical Center, USA) and grown in RPMI‐1640 media (Invitrogen #A10491, Grand Island, NY, USA) containing 1% penicillin and streptomycin, supplemented with 10% fetal bovine serum (FBS). The immortalized non‐transformed RWPE‐1 prostate epithelial cell line was purchased from American Type Culture Collection and grown in keratinocyte serum free medium (K‐SFM) supplemented with bovine pituitary extract (BPE) and human recombinant epidermal growth factor (EGF). CD4(+) T‐lymphocytic cell lines HH and Molt‐3 were acquired from the American Type Culture Collection (ATCC# CRL‐2105 and CRL‐1552 respectively), and maintained in 10% heat‐inactivated fetal bovine serum RPMI media with 1% Pen/Strep. All cell lines were cultured in a 5% CO2 humidified incubator at 37 °C.
2.3. Reagents
Monoclonal anti‐CXCL9 antibodies were purchased from R&D systems (Minneapolis, MN, USA), and 500 μg/ml stock was reconstituted in phosphate buffered saline (PBS). For anti‐CXCL9 treatment, stocks were adjusted to a final concentration of 6 μg/ml. MMP9 inhibitor was purchased from ABGene (Pittsburgh PA, USA) and was adjusted to a final concentration of 5 μg/ml. For cell treatment, Enzalutamide were adjusted to a final concentration of 10 μM.
2.4. Migration assay
The PCa cells and normal prostate RWPE‐1 cells at 1 × 10⁵ were plated into the lower chamber of the transwells with 5 μm pore polycarbonate membrane inserts (Corning, #3422, Corning, NY, USA). 1 × 10⁵ HH or Molt‐3 cells were plated onto the upper chamber. After 6 h, the cells migrated into the lower chamber media were collected and counted by the Bio‐Rad TC10 automatic cell counter. Each sample was assayed in triplicate and the experiments were repeated twice.
2.5. Invasion assay
For in vitro invasion assays, the upper chambers of the transwells (Corning; 8 μm pores) were pre‐coated with diluted growth factor‐reduced Matrigel (1:4 serum free RPMI media) (BD Biosciences, Sparks, MD). Before invasion assays, PCa cells were co‐cultured with HH or Molt‐3 for 48 h in 6‐well transwell plates (Corning; 0.4 μm). 1 × 10⁵ of HH or Molt‐3 cells were plated onto the upper chamber and 1 × 10⁶ PCa cells were plated into the lower chamber. The conditioned media (CM) or control media were collected, diluted with 10% FBS RPMI media at 1:1, plated into the lower chamber and the parental PCa cells without treatment were plated onto the upper chamber at 1 × 10⁵. After 36 h of incubation, the cells in the upper chamber were removed. The insert membranes were fixed in ice cold 75% alcohol, stained with crystal violet, and the positively stained cells were counted under the microscope. The numbers of cells were averaged from counting of five random fields. Each sample was run in triplicate and in multiple experiments.
2.6. 3D invasion assay
Thaw Matrigel on ice and add 40 μl of Matrigel to each well of 8‐well glass chamber slides (at 50 μl/cm2) and spread the Matrigel evenly using a P‐200 tip. Place the slides in the cell culture incubator and allow the Matrigel to solidify (takes 15–20 min). Plate 1 × 10⁵ CWR22RV1 cells into each well with different CMs containing 5% Matrigel and 10 ng/ml EGF and media containing 2.5% Matrigel and 5 ng/ml EGF were replenished every 4 days. PCa cells take about 7 days to form acini‐like structures. 10 different random fields under 200× microscope were chosen randomly and the number of structures in each field counted.
2.7. Quantitative PCR
Total RNA was extracted from each cell line using Trizol (Invitrogen). Reverse transcription was performed using the iScript reverse transcription kit (Bio‐Rad, Hercules, CA, USA). Quantitative real‐time PCR (qRT‐PCR) was conducted using a Bio‐Rad CFX96 system with SYBR green to determine the level of mRNA expression of a gene of interest. Expression levels were normalized to the expression of GAPDH RNA.
2.8. Western‐blot assay
Cells were washed twice in PBS and lysed with RIPA buffer containing 1% protease inhibitors (Amresco, Cochran, NY, USA). Protein concentration in the cell lystate solution was determined by BCA protein assay (Amresco). The cell lystate was mixed with 5 × SDS‐PAGE loading buffer (Amresco). Equivalent protein quantities were heated at 95 °C for 10 min before separation on precasted 7%–15% SDS‐polyacrylamide gels (Bio‐Rad). Proteins were electro‐transferred to PVDF membranes (Millipore, Atlanta GA, USA) that were blocked in Tris‐buffered saline plus 0.05% Tween‐20 (TBS‐T) containing 5% non‐fat dried milk for 1 h. The membranes were washed in TBS‐T and incubated with primary monoclonal antibodies overnight at 4 °C in TBS‐T containing 1% non‐fat milk. The following primary antibodies were used: rabbit anti‐AR (1:1000; Santa Cruz Biotechnology, CA, USA); rabbit anti‐MMP9 (1:1000; Abcam, Cambridge, MA, USA) mouse anti‐GAPDH (1:1000; Santa Cruz Biotechnology). After a washing in TBS‐T buffer, membranes were incubated with goat anti‐horseradish peroxidase‐conjugated secondary antibody (1:1000; Invitrogen) for 1 h at room temperature in 1% non‐fat milk dissolved in TBS‐T. Membranes were then washed with TBS‐T buffer, and signals were visualized by use of an enhanced chemiluminescence system (Thermo, Pittsburgh, PA, USA).
2.9. Lentivirus package and transfection
We designed the AR and FGF11‐siRNA sequences and inserted into the PLKO1.0 vector, packaged with psPAX2 and pMD2.G plasmid, then transfected into 293T cells for 48 h to get the lentivirus soup for freezing at −80 °C until use. The pSuperior–AR siRNA targeting human AR mRNA sequence is 5′‐gtggccgccagcaaggggctg‐3′ (1530–1550); the pSuperior–FGF11siRNA targeting human FGF11 mRNA sequence is 5′‐tcaaaggcatcgtcaccaa‐3′ (454–473).
2.10. In vivo metastasis studies
Male 6–8 weeks old nude mice were purchased from NCI. CWR22RV1 cells were engineered to express luciferase reporter gene (PCDNA3.0‐luciferase) by stable transfection and the positive stable clones were selected and expanded in culture. 12 mice were injected with 1 × 10⁶ CWR22RV1‐Luc cells (mixed with Matrigel, 1:1v/v) and the 20 other mice divided into equal 2 groups were co‐injected with CWR22RV1‐Luc cells with HH or Molt‐3 cells (1 × 10⁵) into both anterior prostate (AP). Metastasis in live mice was measured using a Fluorescent Imager (IVIS Spectrum, Caliper Life Sciences, Hopkinton, MA) at 4 different time points (1, 4, 5, and 6 wks after injection). After a final monitoring with the imager, mice were sacrificed. Each specimen of tumor metastasis in diaphragm was fixed in 4% neutral buffered para‐formaldehyde for 24 h, embedded in paraffin, sectioned to 4 μm slices, and prepared for hematoxylin and eosin (H&E) staining.
2.11. Immunohistochemistry (IHC)
The tumor samples from prostate tumors in situ were fixed in 4% neutral buffered para‐formaldehyde, embedded in paraffin, and sectioned to 4 μm slices. The primary antibodies of the rabbit anti‐CD4(+) (1:50 Thermo), rabbit anti‐CD8(+) (1:100 Thermo), rabbit anti‐AR (1:200 Santa Cruz), rabbit anti‐MMP9 (1:500 Abcam), and rabbit anti‐FGF11 (1:50 Abcam) were used for staining. The primary antibody was recognized by the biotinylated secondary antibody (Vector, Burlingame, CA, USA), and visualized by VECTASTAIN ABC peroxidase system and peroxidase substrate DAB kit (Vector).
2.12. Statistical analysis
Data are expressed as mean ± SEM from at least 3 independent experiments. Statistical analyses involved paired t‐test with SPSS 17.0 (SPSS Inc., Chicago, IL). For in vivo studies, measurements of tumor metastasis among the three groups were analyzed through one‐way ANOVA coupled with the Newman–Keuls test. P < 0.05 was considered statistically significant.
3. Results
3.1. PCa has better capacity than surrounding normal prostate to recruit T cells via secreting morechemokines‐CXCL9
Early studies documented the existence of T cells in some TMEs including PCa (Ebelt et al., 2008). We were interested to see the distribution of T cells in PCa and their potential impacts on PCa progression. We first compared T cells infiltration in PCa with normal prostate in clinical specimens using IHC staining with T cell markers, CD4(+), and results revealed that more infiltrated CD4 (+) T cells were found in PCa than the surrounding normal prostate tissues (Figure 1A).
Figure 1.
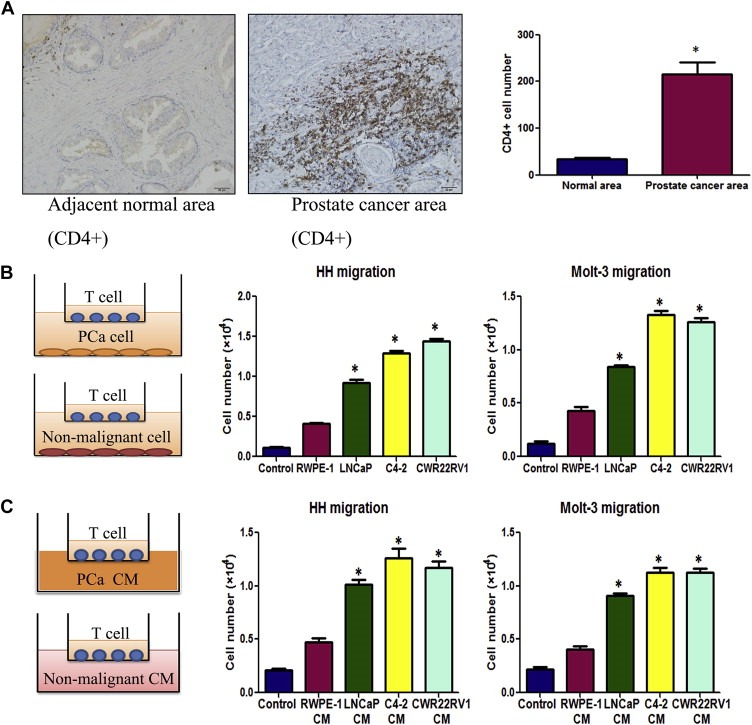
Prostate cancer tissues recruit more T cells. A. Clinical specimen IHC staining from 20 prostate cancer patients showed that more CD4(+) T cells infiltrate surrounding the prostate cancer area than in the adjacent normal prostate area, scale bar: 20 μm, *P < 0.05. B. Transwell T cell migration assay. 1 × 10⁵ of PCa cells or non‐malignant prostate epithelial cells were plated into the lower chambers of the transwells. 1 × 10⁵ of CD4(+) T cells, HH cells or Molt‐3 cells, were plated onto the upper chamber with 5 μm pore polycarbonate membrane for T cell migration assay. The cells migrated into the lower chamber media were collected after 6 h and counted by the Bio‐Rad TC10 automatic cell counter. Compared to the prostate normal epithelial cell line RWPE‐1, LNCaP, C4‐2 and CWR22RV1 recruited more HH and Molt‐3 (*P < 0.05). C. When PCa or RWPE‐1 conditioned media (CM) was added into the lower chamber, PCa cell CM could attract more HH or Molt‐3 cells compared with RWPE‐1 cells CM (*P < 0.05).
We then applied the in vitro co‐culture system T cell recruitment assay to confirm the above in vivo clinical results. In the Boyden chamber migration system, we placed the various PCa cells (LNCaP, C4‐2, CWR22RV1) vs non‐malignant prostate epithelial cells (RWPE‐1) in the lower chamber and then placed CD4(+) T cells (HH cells or Molt‐3 cells) onto the upper chamber (Figure 1B, left panel). After 6 h incubation, we counted the number of HH or Molt‐3 cells that migrated through the membranes and into the bottom chamber, and found PCa cells have a much better capacity to recruit the T cells as compared to the non‐malignant prostate RWPE‐1 cells (Figure 1B, middle and right panels). Similar results were also obtained when we replaced PCa cells/normal prostate cells with their CMs in the lower chambers (Figure 1C).
To dissect the mechanisms why PCa has a better capacity than normal prostate to recruit T cells, we then used q‐PCR to assay the most reported chemokines that are related to attracting T cells (Koch, 2005; Oldham et al., 2012) from PCa vs normal prostate cells in the above co‐culture system. The results revealed a higher CXCL9 expression in PCa C4‐2 cells than normal prostate RWPE‐1 cells (Figure 2A). Similar results were also obtained when we replaced C4‐2 cells with LNCaP or CWR22RV1 cells (Figure 2B).
Figure 2.
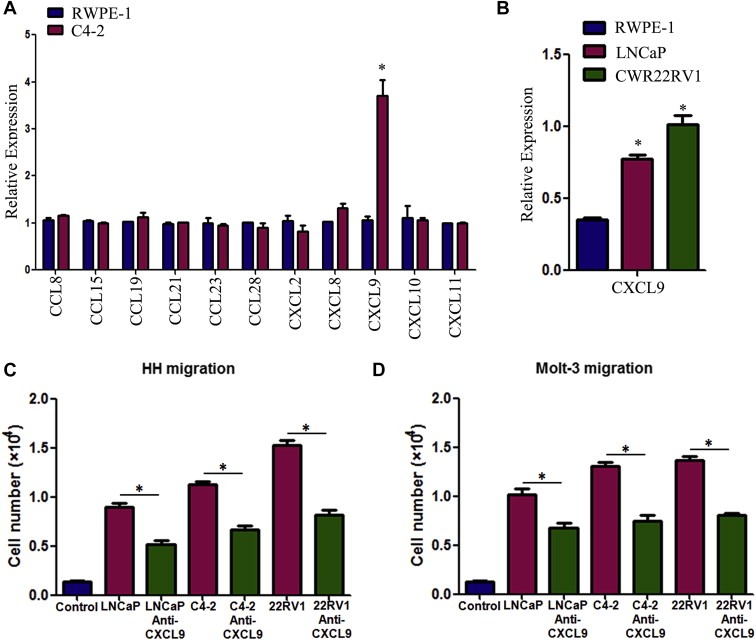
Reverse of T cell recruitment by blocking the CXCL9 with neutralizing antibody. A. Q‐PCR screening of a panel of cytokine factors that could be responsible for PCa cell promoted T cell migration. Compared to the RWPE‐1 cells, C4‐2 cells can express more CXCL9 (*P < 0.05). B. Higher expression of CXCL9 mRNA was confirmed in LNCaP and CWR22RV1 (22RV1) cell lines using q‐PCR (*P < 0.05). C&D. The PCa cell‐promoted HH and Molt‐3 migrations were partly blocked after adding CXCL9 neutralizing antibody (4 μg/ml) into PCa CM in bottom chambers (*P < 0.05).
We then applied an interruption assay with CXCL9 neutralizing antibody in the Boyden chamber migration system and found blocking CXCL9 led to partially suppress the HH cells migration toward PCa (LNCaP, C4‐2, CWR22RV1) cells (Figure 2C). Similar results were also obtained when we replaced HH cells with Molt‐3 cells (Figure 2D).
Taken together, these studies from 1, 2 suggest that PCa tissue has a better capacity to recruit T cells than the surrounding normal prostate that may involve the secretion of more CXCL9 from PCa cells.
3.2. Increased infiltrated T cells to PCa enhanced the PCa cell invasion via down‐regulation of AR signals in PCa cells
What are the consequences after PCa cells recruited more T cells? Using a co‐culture system with transwell plates, we co‐cultured PCa cells with T cells for 2 days and the CMs were collected to test T cells effect on PCa invasion (Figure 3A). Results showed the CM collected from co‐culture of infiltrated T cells (HH or Molt‐3) with different PCa cells could enhance the PCa (LNCaP, C4‐2 or CWR22RV1) cell invasion (Figure 3B).
Figure 3.
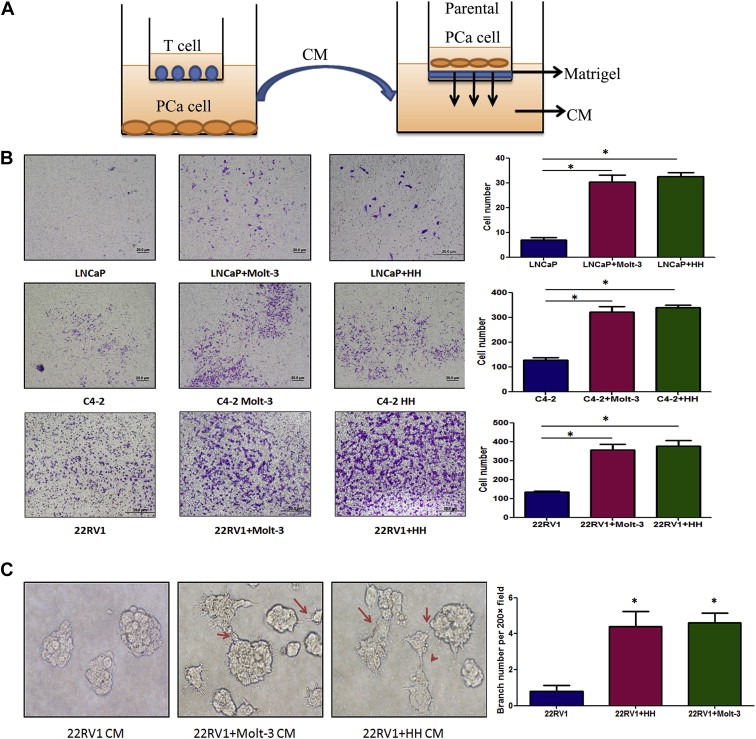
Co‐culture of T cells promoted PCa invasion. A. CMs collected from PCa/T cells co‐culture could promote PCa invasiveness using in vitro Matrigel invasion assay. The PCa/T cells were co‐cultured in 0.4 μM transwell plate for 2 days. The CM or control media were collected, diluted 1:1 with 10% FBS RPMI media, and placed into the lower chamber of transwells. The 1 × 10⁵ PCa cells (without any pre‐treatment) were plated onto upper insert chamber pre‐coated with Matrigel for 36 h invasion assay. B. Toluidine blue staining results showed the PCa/T cells co‐cultured CM can promote PCa cell invasion. Invasion assay has been performed on 3 different PCa cell lines, LNCaP, C4‐2 and CWR22RV1 (22RV1) and 2 different T cells, Molt‐3 and HH (*P < 0.05). C. 3D invasion assay showed that more acini‐like structures formed when treating the parental CWR22RV1 cells with CWR22RV1/T cell co‐culture CM (200×) (*P < 0.05).
Similar results were also obtained when we replaced the Boyden chamber invasion system with 3D invasion assay. After 7‐day treatment with the CM of CWR22RV1 co‐cultured with T cells, the parental CWR22RV1 cell could form more acini‐like structures (Figure 3C).
To dissect the mechanism(s) why infiltrated T cells could enhance PCa cell invasion, we first focused on the AR as early reports suggested that targeting AR could result in the PCa cells becoming more invasive (Izumi et al., 2013, 2013, 2008, 2008, 2010). Using q‐PCR assay, we found the down‐regulation of AR mRNA expression in PCa cells after co‐culture with T cells for 2 days (Figure 4A). Western‐Blot analyses further confirmed the down‐regulation of AR expression at the protein level in LNCaP, C4‐2 and CWR22RV1 (22RV1) cells after co‐culture with the HH or Molt‐3 cells (Figure 4B).
Figure 4.
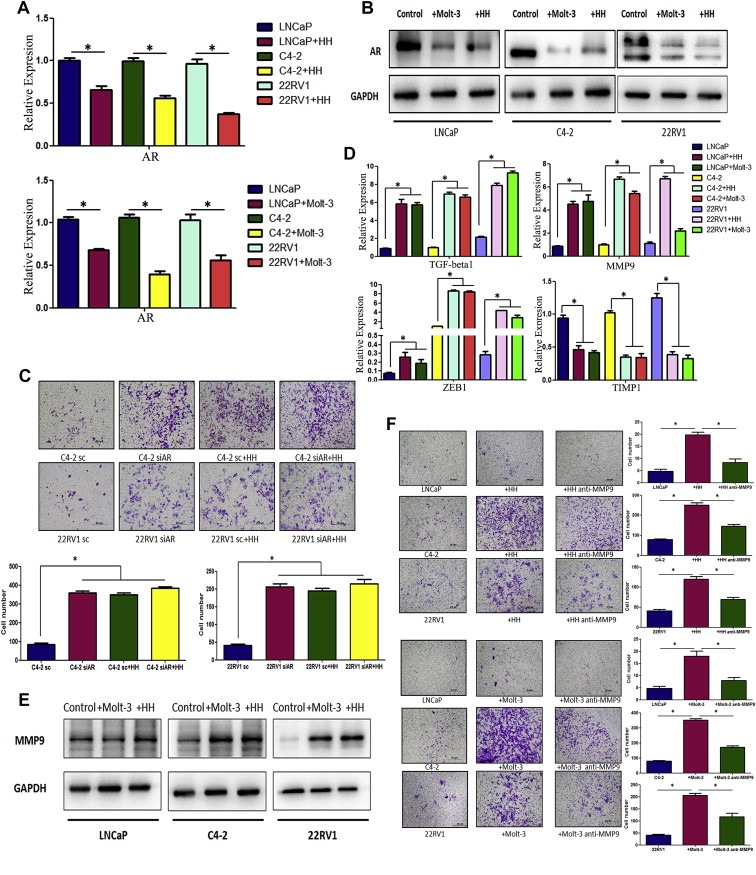
T cells can down‐regulate AR expression and up‐regulate MMP9 expression of PCa cells after co‐culture. A. Q‐PCR detection showed AR mRNA was down‐regulated in PCa cells, LNCaP, C4‐2 and CWR22RV1 (22RV1), after co‐culture with HH or Molt‐3 cells for 2 days (*P < 0.05). B. Western‐blot results showed AR expression of LNCaP, C4‐2 and 22RV1 cells decreased after co‐culture with HH or Molt‐3 cells for 2 days. C. T cell co‐culture could not effectively change invasion in PCa cells with AR knockdown by siRNA. We used lentiviral AR‐siRNA to knock‐down AR expression in PCa. T cells co‐culture failed to promote invasion of PCa cell with AR‐siRNA compared with PCa cell with control si‐Luc (*P < 0.05). D. Four metastasis–related genes were detected by q‐PCR. TGF‐beta1, MMP9 and ZEB1 mRNA level were up‐regulated in PCa cells after co‐culture with T cells, however the MMP9‐inhibitor gene, TIMP1, decreased in PCa cells (*P < 0.05). E. MMP9 expressions of LNCaP, C4‐2 and 22RV1 cells are up‐regulated after co‐culture with HH or Molt‐3 cells using Western‐blot assay (*P < 0.05). F. Blocking MMP9 by MMP9 inhibitor can partly reverse T cell‐promoted PCa invasion (*P < 0.05).
To further examine the importance of AR roles in the mediation of infiltrating T cells for the influence of PCa cell invasion, we then applied the interruption assay with AR‐siRNA to knock‐down AR in PCa cells, and results revealed that infiltrating T cells capacity to enhance PCa cell invasion was suppressed, suggesting the essential role of AR for the mediation of infiltrating T cells to enhance PCa cell invasion (Figure 4C).
Together, results from Figure 4A–C suggest that infiltrated T cells could down‐regulate AR in PCa cells, and may be related with T cell promoting PCa cell invasion.
To further dissect how suppressed AR in PCa played key roles to mediate the infiltrated T cells‐enhanced PCa cell invasion, we applied q‐PCR and western‐blot assays to examine the expression of AR modulated down‐stream metastasis genes in PCa cells after co‐culture with T cells, and found the MMP9 expression was consistently up‐regulated in co‐culture of PCa (LNCaP, C4‐2 and CWR22RV1) cells with T cells (HH or Molt‐3) at the mRNA (Figure 4D) and protein levels (Figure 4E).
Using interruption assay with adding MMP9 inhibitor in PCa cells, we found blocking MMP9 in PCa cells partially reversed the infiltrated T cells‐enhanced PCa cell invasion (Figure 4F), suggesting AR→MMP9 signals in PCa could play key roles to mediate the infiltrated T cells‐enhanced PCa cell invasion.
3.3. Mechanism(s) how infiltrated T cells suppress AR signals in PCa cells
An early report suggested that FGF family members might play key roles in PCa invasion (Lin and Wang, 2010). We assayed the expression of 7 FGF family members in HH or Molt‐3 T cells by comparing T cells alone vs T cells co‐cultured with PCa C4‐2 cells. We also assayed FGF family gene expressions in C4‐2 cells by comparing C4‐2 cells alone vs co‐cultured with T cells. We found the FGF11 expression was consistently higher in T cells after co‐culture with C4‐2 (Figure 5A).
Figure 5.
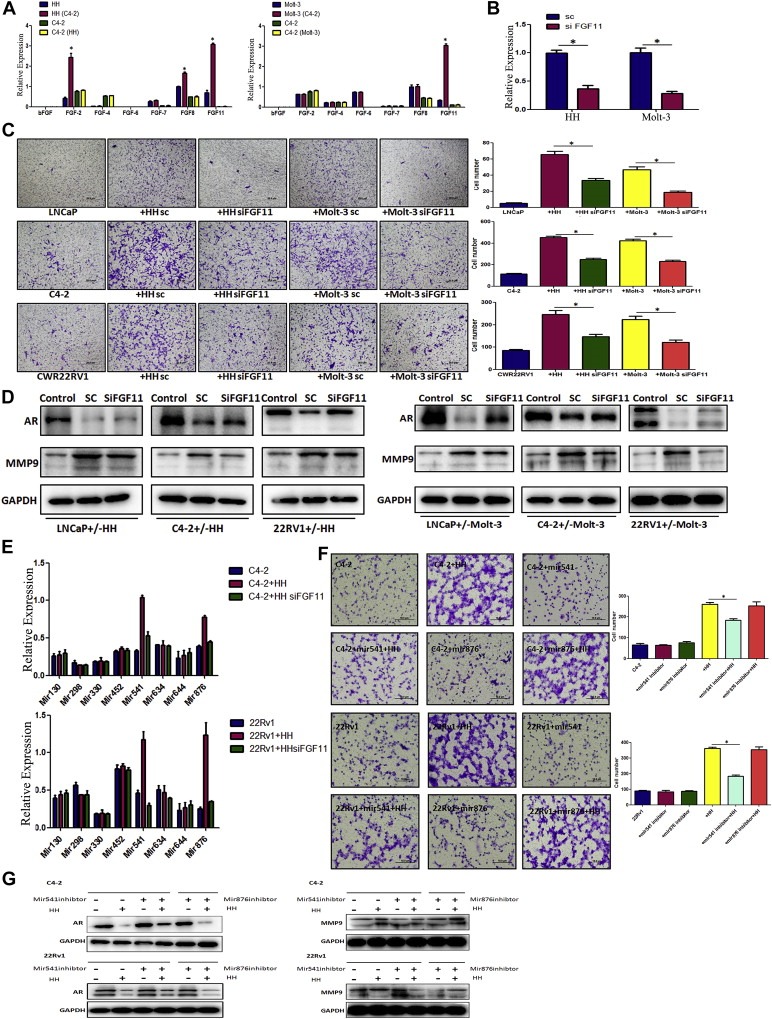
Down‐regulation of AR in PCa cells by T cells secreted FGF11. A. Results showed FGF11 expression is selectively and significantly increased in T cells after co‐culture with PCa cells for 2 days. The data have been validated in 2 different T cell lines co‐cultured with C4‐2 cells (*P < 0.05). B. Validation of FGF11‐siRNA knockdown efficiency in 2 different T cell lines (*P < 0.05). C. T cell promotion of PCa cell invasion can be partly reversed by FGF11 knock‐down in 2 T cell lines. The results have been validated in 2 different T cells and 3 PCa cells, LNCaP, C4‐2, and CWR22RV1 (22RV1) cells (*P < 0.05). D. Knockdown of FGF11 in T cells can partially reverse the T cells‐mediated AR down‐regulation and MMP9 up‐regulation. Results have been validated in the 2 different T cells and 3 PCa cells. E. Q‐PCR results showed that miRNA‐541 (Mir541) and miRNA‐876 (Mir876) stably reduced in PCa cells after knockdown of FGF11 in T cells co‐culture with PCa cells (*P < 0.05). F. MiRNA‐541 inhibitor can partly reverse the HH cell‐enhanced PCa cell invasion (*P < 0.05). G. Inhibition of miRNA‐541 (but not miRNA‐876) can reverse the HH cells‐mediated AR down‐regulation and MMP9 up‐regulation.
Importantly, we found knocking‐down FGF11 with lentivirus FGF11‐siRNA in T cells (HH and Molt‐3) (Figure 5B) partially reversed the T cells‐enhanced PCa cells (LNCaP, C4‐2 and CWR22RV1) invasion (Figure 5C), and knocking‐down FGF11 in T cells also reversed the expression of AR and MMP9 in PCa cells in the co‐culture system (Figure 5D), suggesting the axis of FGF11 from T cells to PCa AR‐MMP9 signals might play key roles in infiltrated T cells‐enhanced PCa cell invasion.
To further dissect how FGF11 can influence AR protein and mRNA at the molecular level, we surveyed a panel of micro‐RNAs (miRNAs) that control gene expression via inhibiting protein translation and/or degrading the target mRNA (Bartel, 2009; He and Hannon, 2004), especially to those miRNAs that could down‐regulate AR in PCa (Ostling et al., 2011). Our T cell/PCa cell co‐culture system with or without knocking‐down FGF11 via siFGF11, demonstrated two potential down‐stream targets, miRNA‐541 and miRNA‐876, as their expression was repeatedly altered in PCa cells (Figure 5E).
We then applied the interruption assay via adding miRNA‐541 or miRNA‐876 inhibitor in PCa cells and found blocking miRNA‐541, but not miRNA‐876, in PCa cells partially reversed the infiltrated HH cells‐enhanced PCa cell invasion (Figure 5F), and the AR and MMP9 expression were also reversed (Figure 5G), suggesting FGF11→miRNA‐541→AR→MMP9 signals could be a key step to mediate the infiltrated T cell influences on PCa cell invasion.
Together, results from 1, 2, 3, 4, 5 suggest that infiltrated T cells could secrete more FGF11 during co‐culture with PCa cells to enhance PCa cell invasion via down‐regulation of AR‐MMP9 signals.
Interestingly, we also found down‐regulated AR in PCa cells, in return, could also lead PCa cells to recruit more T cells. As shown in Figure S1 A & B, targeting AR with AR‐siRNA in LNCaP, C4‐2 and CWR22RV1 cells led to recruit more T HH or Molt‐3 cells in the co‐culture system. Similar results were also obtained when we replaced AR‐siRNA with anti‐androgen Enzalutamide (Figure S1C & D).
These results suggest a positive feed back between down‐regulation of AR signals in PCa cells and increased T cell infiltration: more T cells recruited to PCa cells could lead to down‐regulation of AR in PCa cells, which might then recruit more infiltrating T cells. The consequences of this positive feed back regulation then leads to enhance the PCa cell invasion.
3.4. Infiltrated T cells‐enhanced PCa metastasis in the in vivo mouse models
To confirm the above in vitro results from various cell lines studies, we then investigated the effects of infiltrated T cells on PCa metastasis using in vivo mouse PCa xenografted models with PCa CWR22RV1 cells co‐implanted with T cells (HH or Molt‐3) at 10:1 ratio. CWR22RV1 cells have been transfected with pCDNA3‐luciferase for monitoring tumor growth and metastasis using the in vivo real‐time imaging system (IVIS) image.
After 6 weeks injection, we found results from IVIS showing that the CWR22RV1/T cells co‐implanted group mice had more metastatic luminescence signals located at distant organs as compared with CWR22RV1 only group (Figure 6A). The mice were then sacrificed for tumor examination, and results showed higher metastasis rate (89% in 8 of 9 mice) with metastatic tumors found in the diaphragms in the co‐implanted CWR22RV1+HH cells groups and 78% (7 of 9 mice) in the co‐implanted CWR22RV1+Molt‐3 group. In contrast, only 27% (3 of 11 mice) were found to have metastatic tumors in CWR22RV1 only group.
Figure 6.
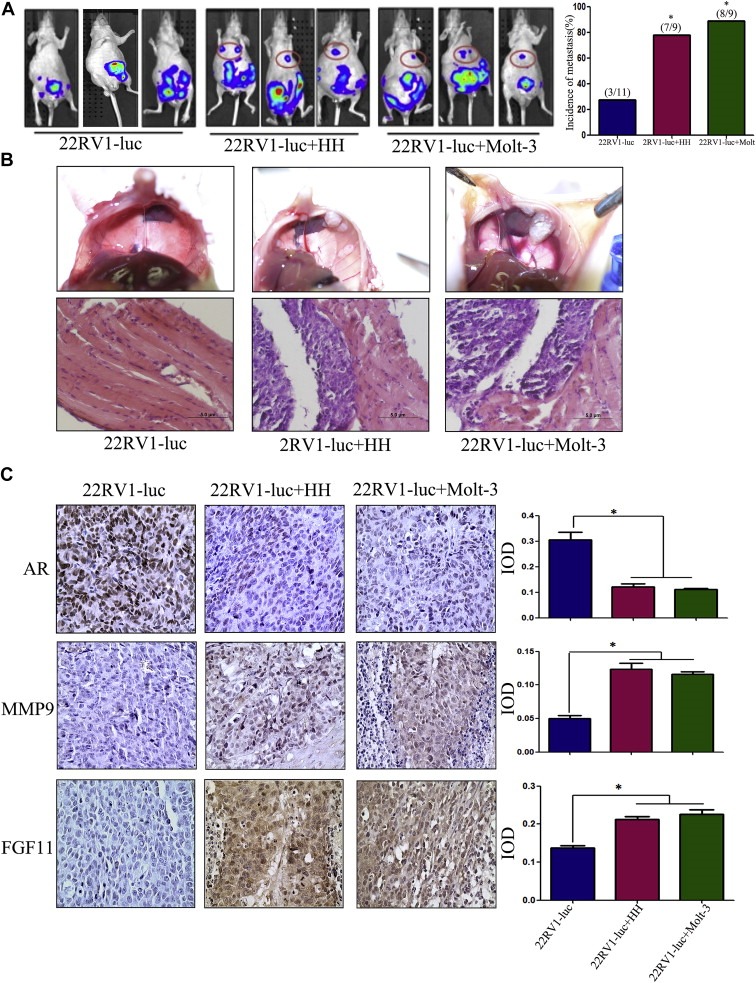
Induction of PCa metastasis by T cells in orthotopic PCa model. A. CWR22RV1‐luc (22RV1‐luc) cells (1 × 10⁶) were mixed with HH or Molt‐3 (1 × 10⁵) and orthotopically implanted into the anterior prostates of nude mice. After 6 weeks, the PCa growth and metastases were evaluated by the IVIS system. The 22RV1 cells co‐injected with T cells showed significant increase of the distant metastatic tumors in diaphragm, compared to the 22RV1 single injection mice (*P < 0.05). B. The mice were then sacrificed (6 week after implantation), the metastatic tumors observed on the diaphragm were confirmed by histology H&E staining. C. IHC staining confirmed T cells co‐implanted 22RV1 tumors have a reduced AR, increased MMP9 and FGF11 expression (400×) (*P < 0.05).
We further confirmed the PCa lesions by H&E staining (Figure 6B), and IHC staining also found the expression of those key molecules such as AR, MMP9, CCL5 and FGF11 matched well to the above in vitro cell lines studies showing lower expression of AR, and higher expression of MMP9 and FGF11 in those co‐injected PCa cells with T cells as compared to those injected with PCa cells alone (Figure 6C).
Together, results from in vivo mouse model studies confirmed the above in vitro cell lines studies and demonstrated that infiltrated T cells could enhance PCa metastasis via modulating FGF11→miRNA‐541→AR→MMP9 signaling.
3.5. FGF11 expression in human PCa tissues
To further prove the FGF11 roles in the T cell promotion of PCa cell invasion. We also examined the FGF11 expression in 20 human PCa tissues via IHC staining. The results revealed that the IHC staining of FGF11 was higher in PCa area than surrounding normal prostate area (Figure 7A). Serial paraffin sections used to detect the distribution of CD4(+) T cell and expression of FGF11 also revealed that FGF11 was located in the epithelial cells and CD4(+) T cells area (Figure 7B), suggesting a positive correlation between the expression of FGF11 and infiltration of CD4(+) T cells (x 2 = 8.37, P = 0.016).
Figure 7.
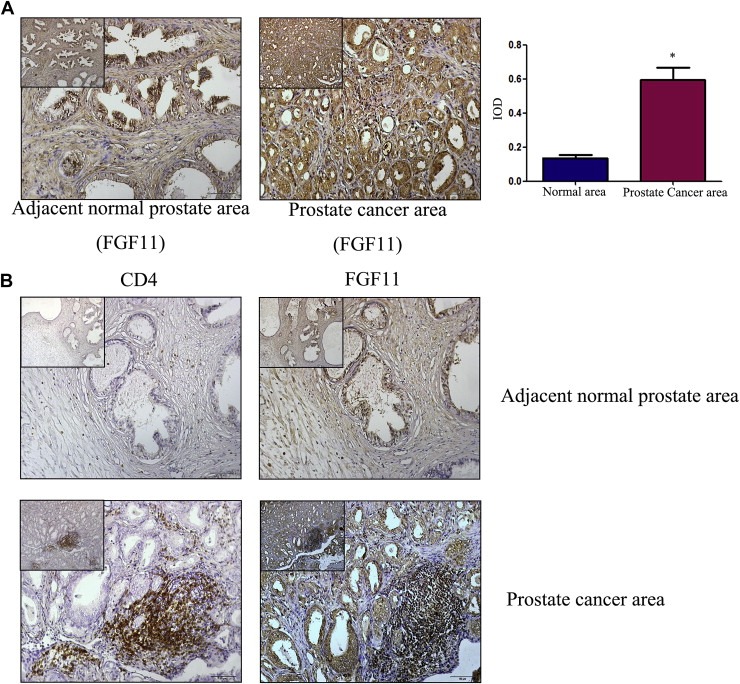
Expression of FGF11 in clinical samples. A. IHC staining for FGF11 in tissue specimens from 20 PCa patients. Compared to adjacent normal area (left panel), FGF11 expression was higher in the PCa area (right panel) (scale bar: 50 μm, the scale bar of upper left corners: 100 μm, *P < 0.05). B. Serial paraffin sections were used to detect the distribution of CD4(+) T cells and expression of FGF11 (Upper panels, adjacent normal area; lower panels, PCa area. Left panels CD4(+) and right labels FGF11, scale bar: 50 μm. The scale bar of upper left corners: 100 μm).
4. Discussion
Several CD3(+) lymphocytes were found in the pTME, and among these infiltrated T cells, CD4(+) was the major sub‐population (Ebelt et al., 2008, 2009). McArdle et al. found the increased CD4(+) T‐lymphocyte infiltration within the tumor was associated with poor outcome in PCa patients (McArdle et al., 2004). Other studies also indicated that increased infiltrated CD4(+) or CD8(+) T‐lymphocytes were associated with decreased survival in patients with renal cancer (Bromwich et al., 2003), and recruited CD4+ T cells in mammary tumors could enhance metastasis (Tan et al., 2011). However, the detailed mechanisms how infiltrated T cells could influence those tumors progression remained unclear.
Here we first demonstrated that infiltrating T cells could enhance PCa cell invasion via modulation of FGF11→miRNA‐541→AR→MMP9 signaling. This is in agreement with previous studies showing AR could function as a suppressor to suppress metastasis in PCa (Chang et al., 2013, 2013, 2012, 2013, 2013, 2013, 2008, 2008, 2010, 2013) and hepatocellular carcinoma (HCC) (Ma et al., 2012). Interestingly, using different PCa cell lines‐MDA PCa 2b, Hara T, et al. also reported that AR might promote PCa cell invasion via alteration the AR‐MMP2/MMP9 signals (Hara et al., 2008).
Early studies also indicated that FGF family members might play important roles in PCa metastasis (Wesche et al., 2011). For example: FGF‐8 was expressed at a high frequency in bone metastases of human PCa (Valta et al., 2008), and FGF9 and FGF19 were involved in PCa metastasis into bones (Feng et al., 2013; Teishima et al., 2012). Here we first identified that the FGF11 could be the AR up‐stream signaling to modulate AR in PCa. Among 7 FGF family members detected, we found infiltrating T cells could promote FGF11 expression after co‐culture with PCa cells.
The miRNAs are small and un‐translated RNAs that control gene expression by inhibiting protein translation and/or degrading target mRNAs (Bartel, 2009; He and Hannon, 2004). Each miRNA can control hundreds of target genes and up to 60% of all transcripts are potentially modulated by miRNAs (Friedman et al., 2009). Among AR related miRNAs in PCa (Ostling et al., 2011), we found miRNA‐541 and miRNA‐876 were repeatedly altered in our co‐culture of T cells with PCa cells with/without FGF‐siRNA, and miRNA inhibitor assay showed miRNA‐541 is the key molecule in our system. The miRNA‐541 (Zhang et al., 2011) has been well studied for its roles in neuronal differentiation. However, our data is the first to suggest that it can also play a role in PCa cell invasion.
Targeting AR leading to enhanced T cells recruitment is also in agreement with early clinical studies showing PCa patients who received ADT had increased CD4(+) T cells in PCa lesions (Mercader et al., 2001), or increased population of CD3(+) T lymphocytes (Gannon et al., 2009; Sanchez et al., 2013; Shore et al., 2013).
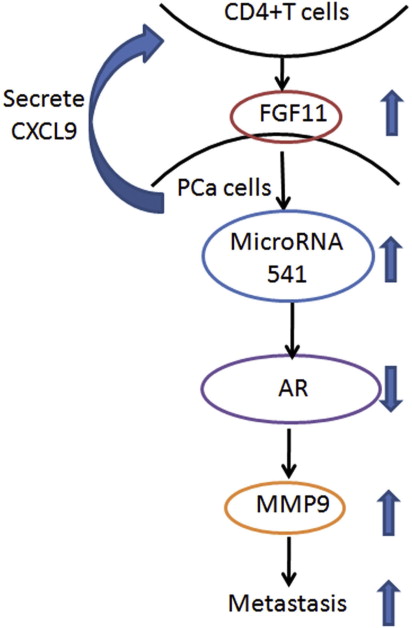
In summary, our results concluded that infiltrating T cells could promote PCa metastasis via modulation of FGF11→miRNA‐541→AR→MMP9 signals (Figure S3), which may provide us new potential therapeutic approaches to better battle PCa metastasis via targeting these newly identified signals from infiltrated T cells.
5. Conclusions
We concluded that infiltrating CD4(+) T cells could promote PCa metastasis via modulation of FGF11→miRNA‐541→AR→MMP9 signals, which may provide us a new potential therapeutic approach to better battle PCa metastasis via targeting these newly identified signals from infiltrated CD4(+) T cells.
Conflict of interest
The authors have declared that no conflict of interest exists.
Supporting information
The following are the supplementary data related to this article:
Figure S1. AR down‐regulation in PCa cells could recruit more T cells. A. AR was knocked down by lentivirus siAR in three PCa cells (LNCaP, C4‐2 and CWR22RV1). B. T cells migrated more effectively toward PCa cells after AR knockdown in PCa cells (*P < 0.05). C&D. The PCa cells, LNCaP, C4‐2 and CWR22RV1 cells, were pre‐treated with 10 μM Enzalutamide, or vehicle control for 3 days. The used these cells for the HH migration assay. HH cells or Molt‐3 cells migrated more effectively toward the PCa cells with Enzalutamide pre‐treatment (*P < 0.05).
Figure S2. CD8+T cell infiltration in clinical samples from PCa patients. Clinical specimen IHC staining from 20 PCa patients showed that more CD8+ T cells infiltrate surrounding the prostate cancer area than in the adjacent normal prostate area, scale bar: 20 μm, *P < 0.05.
Figure S3. Mechanisms and regulatory pathways of T cells–promoted PCa metastasis. PCa cells can secrete CXCL9 to better recruit T cells infiltration. PCsa cells and T cells interact with each other in PCa microenvironment. T cells can secrete FGF11 to down‐regulate AR and up‐regulate MMP9 in PCa cells through increasing miRNA‐541 and lead to increased PCa invasion. Meanwhile, AR down‐regulation in PCa can make PCa cells recruit more T cells.
Acknowledgments
This work was supported by NIH grants (CA155477 and CA156700), George Whipple Professorship Endowment and Taiwan Department of Health Clinical Trial, Research Center of Excellence (DOH99‐TD‐B‐111‐004 to China Medical University, Taichung, Taiwan) and China 973 Program (2012CB518305).
1.
Supplementary data related to this article can be found at http://dx.doi.org/10.1016/j.molonc.2014.07.013.
Hu Shuai, Li Lei, Yeh Shuyuan, Cui Yun, Li Xin, Chang Hong-Chiang, Jin Jie, Chang Chawnshang, (2015), Infiltrating T cells promote prostate cancer metastasis via modulation of FGF11→miRNA-541→androgen receptor (AR)→MMP9 signaling, Molecular Oncology, 9, doi: 10.1016/j.molonc.2014.07.013.
Contributor Information
Jie Jin, Email: jinjie@vip.163.com.
Chawnshang Chang, Email: chang@urmc.rochester.edu.
References
- Bartel, D.P. , 2009. MicroRNAs: target recognition and regulatory functions. Cell. 136, 215–233. [DOI] [PMC free article] [PubMed] [Google Scholar]
- Bromwich, E.J. , McArdle, P.A. , Canna, K. , McMillan, D.C. , McNicol, A.M. , Brown, M. , Aitchison, M. , 2003. The relationship between T-lymphocyte infiltration, stage, tumour grade and survival in patients undergoing curative surgery for renal cell cancer. Br. J. Cancer. 89, 1906–1908. [DOI] [PMC free article] [PubMed] [Google Scholar]
- Chang, C. , Lee, S.O. , Yeh, S. , Chang, T.M. , 2013. Androgen receptor (AR) differential roles in hormone-related tumors including prostate, bladder, kidney, lung, breast and liver. Oncogene. 33, 3225–3234. [DOI] [PubMed] [Google Scholar]
- Chang, C.S. , Kokontis, J. , Liao, S.T. , 1988. Molecular cloning of human and rat complementary DNA encoding androgen receptors. Science. 240, 324–326. [DOI] [PubMed] [Google Scholar]
- Ebelt, K. , Babaryka, G. , Figel, A.M. , Pohla, H. , Buchner, A. , Stief, C.G. , Eisenmenger, W. , Kirchner, T. , Schendel, D.J. , Noessner, E. , 2008. Dominance of CD4+ lymphocytic infiltrates with disturbed effector cell characteristics in the tumor microenvironment of prostate carcinoma. Prostate. 68, 1–10. [DOI] [PubMed] [Google Scholar]
- Ebelt, K. , Babaryka, G. , Frankenberger, B. , Stief, C.G. , Eisenmenger, W. , Kirchner, T. , Schendel, D.J. , Noessner, E. , 2009. Prostate cancer lesions are surrounded by FOXP3+, PD-1+ and B7-H1+ lymphocyte clusters. Eur. J. Cancer. 45, 1664–1672. [DOI] [PubMed] [Google Scholar]
- Fang, L.Y. , Izumi, K. , Lai, K.P. , Liang, L. , Li, L. , Miyamoto, H. , Lin, W.J. , Chang, C. , 2013. Infiltrating macrophages promote prostate tumorigenesis via modulating androgen receptor-mediated CCL4-STAT3 signaling. Cancer Res. 73, 5633–5646. [DOI] [PMC free article] [PubMed] [Google Scholar]
- Feng, S. , Dakhova, O. , Creighton, C.J. , Ittmann, M. , 2013. Endocrine fibroblast growth factor FGF19 promotes prostate cancer progression. Cancer Res. 73, 2551–2562. [DOI] [PMC free article] [PubMed] [Google Scholar]
- Friedman, R.C. , Farh, K.K. , Burge, C.B. , Bartel, D.P. , 2009. Most mammalian mRNAs are conserved targets of microRNAs. Genome Res. 19, 92–105. [DOI] [PMC free article] [PubMed] [Google Scholar]
- Gannon, P.O. , Poisson, A.O. , Delvoye, N. , Lapointe, R. , Mes-Masson, A.M. , Saad, F. , 2009. Characterization of the intra-prostatic immune cell infiltration in androgen-deprived prostate cancer patients. J. Immunol. Methods. 348, 9–17. [DOI] [PubMed] [Google Scholar]
- Hara, T. , Miyazaki, H. , Lee, A. , Tran, C.P. , Reiter, R.E. , 2008. Androgen receptor and invasion in prostate cancer. Cancer Res. 68, 1128–1135. [DOI] [PubMed] [Google Scholar]
- He, L. , Hannon, G.J. , 2004. MicroRNAs: small RNAs with a big role in gene regulation. Nat. Rev. Genet. 5, 522–531. [DOI] [PubMed] [Google Scholar]
- Heinlein, C.A. , Chang, C. , 2004. Androgen receptor in prostate cancer. Endocr. Rev. 25, 276–308. [DOI] [PubMed] [Google Scholar]
- Izumi, K. , Fang, L.Y. , Mizokami, A. , Namiki, M. , Li, L. , Lin, W.J. , Chang, C. , 2013. Targeting the androgen receptor with siRNA promotes prostate cancer metastasis through enhanced macrophage recruitment via CCL2/CCR2-induced STAT3 activation. EMBO Mol. Med. 5, 1383–1401. [DOI] [PMC free article] [PubMed] [Google Scholar]
- Jemal, A. , Siegel, R. , Ward, E. , Hao, Y. , Xu, J. , Murray, T. , Thun, M.J. , 2008. Cancer statistics, 2008. CA Cancer J. Clin. 58, 71–96. [DOI] [PubMed] [Google Scholar]
- Koch, A.E. , 2005. Chemokines and their receptors in rheumatoid arthritis: future targets?. Arthritis Rheum. 52, 710–721. [DOI] [PubMed] [Google Scholar]
- Lai, K.P. , Yamashita, S. , Huang, C.K. , Yeh, S. , Chang, C. , 2012. Loss of stromal androgen receptor leads to suppressed prostate tumourigenesis via modulation of pro-inflammatory cytokines/chemokines. EMBO Mol. Med. 4, 791–807. [DOI] [PMC free article] [PubMed] [Google Scholar]
- Lin, T.H. , Izumi, K. , Lee, S.O. , Lin, W.J. , Yeh, S. , Chang, C. , 2013. Anti-androgen receptor ASC-J9 versus anti-androgens MDV3100 (Enzalutamide) or Casodex (Bicalutamide) leads to opposite effects on prostate cancer metastasis via differential modulation of macrophage infiltration and STAT3–CCL2 signaling. Cell Death Dis. 4, e764 [DOI] [PMC free article] [PubMed] [Google Scholar]
- Lin, T.H. , Lee, S.O. , Niu, Y. , Xu, D. , Liang, L. , Li, L. , Yeh, S.D. , Fujimoto, N. , Yeh, S. , Chang, C. , 2013. Differential androgen deprivation therapies with anti-androgens Casodex/bicalutamide or MDV3100/Enzalutamide versus anti-androgen receptor ASC-J9(R) Lead to promotion versus suppression of prostate cancer metastasis. J. Biol. Chem. 288, 19359–19369. [DOI] [PMC free article] [PubMed] [Google Scholar]
- Lin, Y. , Wang, F. , 2010. FGF signalling in prostate development, tissue homoeostasis and tumorigenesis. Biosci. Rep. 30, 285–291. [DOI] [PubMed] [Google Scholar]
- Luo, J. , Ok Lee, S. , Liang, L. , Huang, C.K. , Li, L. , Wen, S. , Chang, C. , 2013. Infiltrating bone marrow mesenchymal stem cells increase prostate cancer stem cell population and metastatic ability via secreting cytokines to suppress androgen receptor signaling. Oncogene. 33, 2768–2778. [DOI] [PubMed] [Google Scholar]
- Ma, W.L. , Hsu, C.L. , Yeh, C.C. , Wu, M.H. , Huang, C.K. , Jeng, L.B. , Hung, Y.C. , Lin, T.Y. , Yeh, S. , Chang, C. , 2012. Hepatic androgen receptor suppresses hepatocellular carcinoma metastasis through modulation of cell migration and anoikis. Hepatology. 56, 176–185. [DOI] [PMC free article] [PubMed] [Google Scholar]
- Maitland, N.J. , Collins, A.T. , 2008. Prostate cancer stem cells: a new target for therapy. J. Clin. Oncol. 26, 2862–2870. [DOI] [PubMed] [Google Scholar]
- McArdle, P.A. , Canna, K. , McMillan, D.C. , McNicol, A.M. , Campbell, R. , Underwood, M.A. , 2004. The relationship between T-lymphocyte subset infiltration and survival in patients with prostate cancer. Br. J. Cancer. 91, 541–543. [DOI] [PMC free article] [PubMed] [Google Scholar]
- Mercader, M. , Bodner, B.K. , Moser, M.T. , Kwon, P.S. , Park, E.S. , Manecke, R.G. , Ellis, T.M. , Wojcik, E.M. , Yang, D. , Flanigan, R.C. , Waters, W.B. , Kast, W.M. , Kwon, E.D. , 2001. T cell infiltration of the prostate induced by androgen withdrawal in patients with prostate cancer. Proc. Natl. Acad. Sci. U. S. A. 98, 14565–14570. [DOI] [PMC free article] [PubMed] [Google Scholar]
- Niu, Y. , Altuwaijri, S. , Lai, K.P. , Wu, C.T. , Ricke, W.A. , Messing, E.M. , Yao, J. , Yeh, S. , Chang, C. , 2008. Androgen receptor is a tumor suppressor and proliferator in prostate cancer. Proc. Natl. Acad. Sci. U. S. A. 105, 12182–12187. [DOI] [PMC free article] [PubMed] [Google Scholar]
- Niu, Y. , Altuwaijri, S. , Yeh, S. , Lai, K.P. , Yu, S. , Chuang, K.H. , Huang, S.P. , Lardy, H. , Chang, C. , 2008. Targeting the stromal androgen receptor in primary prostate tumors at earlier stages. Proc. Natl. Acad. Sci. U. S. A. 105, 12188–12193. [DOI] [PMC free article] [PubMed] [Google Scholar]
- Niu, Y. , Chang, T.M. , Yeh, S. , Ma, W.L. , Wang, Y.Z. , Chang, C. , 2010. Differential androgen receptor signals in different cells explain why androgen-deprivation therapy of prostate cancer fails. Oncogene. 29, 3593–3604. [DOI] [PubMed] [Google Scholar]
- Oldham, K.A. , Parsonage, G. , Bhatt, R.I. , Wallace, D.M. , Deshmukh, N. , Chaudhri, S. , Adams, D.H. , Lee, S.P. , 2012. T lymphocyte recruitment into renal cell carcinoma tissue: a role for chemokine receptors CXCR3, CXCR6, CCR5, and CCR6. Eur. Urol. 61, 385–394. [DOI] [PubMed] [Google Scholar]
- Omabe, M. , Ezeani, M. , 2011. Infection, inflammation and prostate carcinogenesis. Infection, genetics and evolution. J. Mol. Epidemiol. Evol. Genet. Infect. Dis. 11, 1195–1198. [DOI] [PubMed] [Google Scholar]
- Ostling, P. , Leivonen, S.K. , Aakula, A. , Kohonen, P. , Makela, R. , Hagman, Z. , Edsjo, A. , Kangaspeska, S. , Edgren, H. , Nicorici, D. , Bjartell, A. , Ceder, Y. , Perala, M. , Kallioniemi, O. , 2011. Systematic analysis of microRNAs targeting the androgen receptor in prostate cancer cells. Cancer Res. 71, 1956–1967. [DOI] [PubMed] [Google Scholar]
- Reebye, V. , Frilling, A. , Habib, N.A. , Mintz, P.J. , 2011. Intracellular adaptor molecules and AR signalling in the tumour microenvironment. Cell Signal. 23, 1017–1021. [DOI] [PubMed] [Google Scholar]
- Sanchez, C. , Chan, R. , Bajgain, P. , Rambally, S. , Palapattu, G. , Mims, M. , Rooney, C.M. , Leen, A.M. , Brenner, M.K. , Vera, J.F. , 2013. Combining T-cell immunotherapy and anti-androgen therapy for prostate cancer. Prostate Cancer Prostatic Dis. 16, 123–131. S121 [DOI] [PMC free article] [PubMed] [Google Scholar]
- Shore, N.D. , Mantz, C.A. , Dosoretz, D.E. , Fernandez, E. , Myslicki, F.A. , McCoy, C. , Finkelstein, S.E. , Fishman, M.N. , 2013. Building on sipuleucel-T for immunologic treatment of castration-resistant prostate cancer. Cancer control. J. Moffitt Cancer Cent. 20, 7–16. [DOI] [PubMed] [Google Scholar]
- Steiner, G.E. , Djavan, B. , Kramer, G. , Handisurya, A. , Newman, M. , Lee, C. , Marberger, M. , 2002. The picture of the prostatic lymphokine network is becoming increasingly complex. Rev. Urol. 4, 171–177. [PMC free article] [PubMed] [Google Scholar]
- Sun, Y. , Wang, B.E. , Leong, K.G. , Yue, P. , Li, L. , Jhunjhunwala, S. , Chen, D. , Seo, K. , Modrusan, Z. , Gao, W.Q. , Settleman, J. , Johnson, L. , 2012. Androgen deprivation causes epithelial-mesenchymal transition in the prostate: implications for androgen-deprivation therapy. Cancer Res. 72, 527–536. [DOI] [PubMed] [Google Scholar]
- Tan, W. , Zhang, W. , Strasner, A. , Grivennikov, S. , Cheng, J.Q. , Hoffman, R.M. , Karin, M. , 2011. Tumour-infiltrating regulatory T cells stimulate mammary cancer metastasis through RANKL-RANK signalling. Nature. 470, 548–553. [DOI] [PMC free article] [PubMed] [Google Scholar]
- Teishima, J. , Shoji, K. , Hayashi, T. , Miyamoto, K. , Ohara, S. , Matsubara, A. , 2012. Relationship between the localization of fibroblast growth factor 9 in prostate cancer cells and postoperative recurrence. Prostate Cancer Prostatic Dis. 15, 8–14. [DOI] [PubMed] [Google Scholar]
- Tu, S.M. , Lin, S.H. , 2012. Prostate cancer stem cells. Clin. Genitourin Cancer. 10, 69–76. [DOI] [PMC free article] [PubMed] [Google Scholar]
- Valta, M.P. , Tuomela, J. , Bjartell, A. , Valve, E. , Vaananen, H.K. , Harkonen, P. , 2008. FGF-8 is involved in bone metastasis of prostate cancer. Int. J. Cancer. 123, 22–31. [DOI] [PubMed] [Google Scholar]
- Vendramini-Costa, D.B. , Carvalho, J.E. , 2012. Molecular link mechanisms between inflammation and cancer. Curr. Pharm. Des. 18, 3831–3852. [DOI] [PubMed] [Google Scholar]
- Wang, X. , Lee, S.O. , Xia, S. , Jiang, Q. , Luo, J. , Li, L. , Yeh, S. , Chang, C. , 2013. Endothelial cells enhance prostate cancer metastasis via IL-6→androgen receptor→TGF-beta→MMP-9 signals. Mol. Cancer Ther. 12, 1026–1037. [DOI] [PMC free article] [PubMed] [Google Scholar]
- Wen, S. , Niu, Y. , Lee, S.O. , Chang, C. , 2013. Androgen receptor (AR) positive vs negative roles in prostate cancer cell deaths including apoptosis, anoikis, entosis, necrosis and autophagic cell death. Cancer Treat. Rev. 40, 31–40. [DOI] [PMC free article] [PubMed] [Google Scholar]
- Wesche, J. , Haglund, K. , Haugsten, E.M. , 2011. Fibroblast growth factors and their receptors in cancer. Biochem. J. 437, 199–213. [DOI] [PubMed] [Google Scholar]
- Yates, C. , 2011. Prostate tumor cell plasticity: a consequence of the microenvironment. Adv. Exp. Med. Biol. 720, 81–90. [DOI] [PMC free article] [PubMed] [Google Scholar]
- Zhang, J. , Liu, L.H. , Zhou, Y. , Li, Y.P. , Shao, Z.H. , Wu, Y.J. , Li, M.J. , Fan, Y.Y. , Shi, H.J. , 2011. Effects of miR-541 on neurite outgrowth during neuronal differentiation. Cell Biochem. Funct. 29, 279–286. [DOI] [PubMed] [Google Scholar]
Associated Data
This section collects any data citations, data availability statements, or supplementary materials included in this article.
Supplementary Materials
The following are the supplementary data related to this article:
Figure S1. AR down‐regulation in PCa cells could recruit more T cells. A. AR was knocked down by lentivirus siAR in three PCa cells (LNCaP, C4‐2 and CWR22RV1). B. T cells migrated more effectively toward PCa cells after AR knockdown in PCa cells (*P < 0.05). C&D. The PCa cells, LNCaP, C4‐2 and CWR22RV1 cells, were pre‐treated with 10 μM Enzalutamide, or vehicle control for 3 days. The used these cells for the HH migration assay. HH cells or Molt‐3 cells migrated more effectively toward the PCa cells with Enzalutamide pre‐treatment (*P < 0.05).
Figure S2. CD8+T cell infiltration in clinical samples from PCa patients. Clinical specimen IHC staining from 20 PCa patients showed that more CD8+ T cells infiltrate surrounding the prostate cancer area than in the adjacent normal prostate area, scale bar: 20 μm, *P < 0.05.
Figure S3. Mechanisms and regulatory pathways of T cells–promoted PCa metastasis. PCa cells can secrete CXCL9 to better recruit T cells infiltration. PCsa cells and T cells interact with each other in PCa microenvironment. T cells can secrete FGF11 to down‐regulate AR and up‐regulate MMP9 in PCa cells through increasing miRNA‐541 and lead to increased PCa invasion. Meanwhile, AR down‐regulation in PCa can make PCa cells recruit more T cells.