

Abstract
Mutations in the HPRT1 gene, which encodes the purine salvage enzyme hypoxanthine-guanine phosphoribosyltransferase (HGprt), cause Lesch-Nyhan disease (LND) and more mildly affected Lesch-Nyhan variants. Prior studies have suggested a strong correlation between residual hypoxanthine recycling activity and disease severity. However, the relevance of guanine recycling and compensatory changes in the de novo synthesis of purines have received little attention. In the current studies, fibroblast cultures were established for 21 healthy controls and 36 patients with a broad spectrum of disease severity related to HGprt deficiency. We assessed hypoxanthine recycling, guanine recycling, steady-state purine pools, and de novo purine synthesis. There was a strong correlation between disease severity and either hypoxanthine or guanine recycling. Intracellular purines were normal in the HGprt-deficient fibroblasts, but purine wasting was evident as increased purine metabolites excreted from the cells. The normal intracellular purines in the HGprt-deficient fibroblasts was likely due in part to a compensatory increase in purine synthesis, as demonstrated by a significant increase in purinosomes. However, the increase in purine synthesis did not appear to correlate with disease severity. These results refine our understanding of the potential sources of phenotypic heterogeneity in LND and its variants.
Keywords: Inherited metabolic disease, Genotype-phenotype correlation, Purine metabolism, Purinosome
Introduction
There are many different mutations in the HPRT1 gene encoding the purine salvage enzyme hypoxanthine-guanine phosphoribosyltransferase (HGprt) that cause a broad spectrum of clinical phenotypes [1, 2]. These phenotypes are typically grouped into three categories based on the presence or absence of specific clinical features [2, 3]. The mildest phenotype is HGprt-related hyperuricemia (HRH) and includes overproduction of uric acid leading to hyperuricemia, nephrolithiasis, and gout.
An intermediate phenotype is HGprt-related neurological dysfunction (HND), which includes problems related to uric acid, along with varying degrees of motor impairment and neurocognitive abnormalities. The motor impairments are dominated by dystonia, but are sometimes accompanied by choreoathetosis or spasticity [4]. Neurocognitive disability also occurs, but usually it is not severe [5–7].
The most severe phenotype is known as Lesch-Nyhan disease (LND). It includes overproduction of uric acid, more prominent motor and neurocognitive abnormalities, and a characteristic behavioral syndrome. The hallmark behavioral problem in LND is recurrent self-injurious behavior, often with other problem behaviors such as impulsivity, hitting or spitting at others, or use of socially inappropriate language [8–10].
When assessed using live cell assays that recapitulate conditions in vivo, there is a strong relationship between disease severity and residual HGprt enzyme activity as determined by hypoxanthine recycling [11, 12]. Individuals with HRH have been reported to have residual activity of at least 8% of normal individuals, those with HND tend to have 2–8% residual activity, and individuals with LND to have 0–2% residual activity. The relationship between residual guanine recycling activity and disease severity has not been well studied. In addition to reduced hypoxanthine recycling activity, there is a secondary up-regulation of the de novo pathway for purine synthesis. This increase in purine synthesis is thought to compensate for the loss of purine recycling, but its relationship to disease severity also has not been explored.
The current studies were designed to determine how different changes in purine metabolism relate to disease severity. Using fibroblast cultures from 21 healthy controls and 36 patients with a spectrum of HGprt deficiency, we first compared disease severity with residual hypoxanthine or guanine recycling. We next examined steady-state purine pools. Finally, we examined purine synthesis as determined by the formation of purinosomes, which are multifunctional protein complexes of the 6 enzymes in the de novo purine biosynthesis pathway that form when cellular demand for purines is increased [13].
Material and Methods
Clinical evaluation
Individuals with HGprt deficiency and normal healthy controls were recruited after referral to centers with expertise in the evaluation and management of LND and its variants. The studies were approved by the Institutional Review Boards at Emory University and Johns Hopkins University. Cognitively normal subjects gave written informed consent. Those with cognitive impairments or children provided verbal assent, with written consent being provided by a legal guardian.
The diagnosis of classic LND was established according to prior studies [14] and was based on expression of the complete phenotype with evidence for overproduction of uric acid, motor impairments, intellectual disability, and self-injurious behavior. Self-injurious behavior was defined as any self-directed behavior leading to tissue injury. The diagnosis was confirmed by documentation of reduced HGprt enzyme activity in fibroblasts or blood cells or a mutation in the HPRT1 gene predicting null enzyme activity. The diagnosis of an attenuated variant of LND (HND or HRH) required evidence for reduced HGprt enzyme activity or a mutation in the HPRT1 gene, but without self-injurious behavior typical of LND. In keeping with prior studies [4], subjects with HND were distinguished from those with HRH by a Burke-Fahn-Marsden dystonia rating score ≥ 5, regardless of neurocognitive function. This arbitrary cutoff score was based on observations that normal controls sometimes have minor clumsy behavior that yields a score of 0–5.
Fibroblast cultures
Fresh cultures of human dermal fibroblasts were established from punch biopsies of the volar forearm. In brief, a 4 mm diameter, full-thickness skin biopsy punch was collected under sterile conditions and placed into a 15 mL conical tube containing Eagle’s minimal essential medium (DMEM, Life Technologies, USA) with 1% penicillin and steptomycin (Life Technologies, USA) and 0.6% Fungizone (Life Technologies, USA) at room temperature. Within 24–48 h, the biopsy was rinsed several times with phosphate-buffered saline and minced into 1–2 mm pieces with a razor blade or scissors. The minced pieces were rinsed again and digested in a 15 mL conical tube with 5 mL of a mixture of 0.1% collagenase and dispase in tissue culture medium for 60 min. At 15 min intervals, medium containing free cells was aspirated to a second tube and fresh digestion medium was added. The samples were then combined and spun at 500 × g for 10 min to pellet cells and undigested materials. The medium was discarded and the pellet replated with fresh tissue culture medium containing 15% fetal bovine serum (Hyclone, USA). Plates were left undisturbed for 4–7 days so that cells could attach, the cells were allowed to grow, and undigested material was removed with forceps after 2 weeks. Cells were split 1:4 when the plates reached 90% confluency and stored frozen in tissue culture medium supplemented with 10% dimethylsulfoxide at −150°C.
After thawing, the cells were grown at 37°C in an atmosphere of 5% CO2 in DMEM, supplemented with 1 μg/ml of streptomycin, 1 unit/ml of penicillin, 2 mM glutamine and 15% fetal calf serum (Invitrogen, Carlsbad CA).
HGprt enzyme activity assay
The enzyme assay was conducted in live fibroblasts as previously described [15–17]. This assay involves the incorporation of radiolabeled hypoxanthine or guanine into related nucleotides. Briefly, fibroblast cultures were grown in 100 mm petri dishes to near confluency so they were in late log phase. Four tissue culture plates were prepared for each culture for quadruplicate assay. Cells were detached by trypsinization, pelleted by centrifugation at 500 × g for 5 min, and 2×10⁵ cells were resuspended in 100 μL cell culture medium supplemented with 15% dialyzed fetal bovine serum (Thermo Fisher Scientific, Logan UT) containing 25 μM [8-14C]-hypoxanthine (50 mCi/mmol, Moravek Biochemicals Inc, CA) for Hprt activity assay; or 25 μM 14C-guanine (0.1 mCi/mL; 46.4 mCi/mmol, Moravek Biochemicals, CA) for Gprt activity assay. Cells were incubated for 2 h at 37°C with continuous gentle rotation to maintain suspension. Cells then were pelleted by gentle centrifugation, the supernatant was removed, and the cells were washed in ice-cold phosphate-buffered saline and pelleted again at 4°C by centrifugation. Purines were extracted with 25 μL of ice-cold 0.2 M perchloric acid and samples were stored frozen at −80°C. After thawing, the samples were incubated for 30 min at 4°C. The samples were centrifuged at 10,000 × g for 10 min at 4°C, and the supernatants were transferred to a fresh tube to count radiolabeled nucleotides. Pellets were kept for protein assay. To capture nucleotides, 5 μL of the supernatant was spotted onto microplates with diethylaminoethyl anion exchange filters (Millipore, Billerica MA). Samples were allowed to adsorb for 60 min and un-reacted radiolabeled substrate was washed from the filters once with 200 μL of H2O and three times with 50% methanol by vacuum filtration using a MultiScreen HTS Vacuum Manifold (Millipore). Next, 100 μL of ULTIMA GOLD MV scintillation liquid (Perkin Elmer, Waltham, MA) was added into each well and mixed for 24 h. The plates were counted using a 2450 MicroBeta Microplate Scintillation Counter (Perkin Elmer, Finland).
To accommodate slight changes in cell density at harvest, Hprt or Gprt activity were normalized to the total protein concentrations. Protein pellets were dissolved in 2% SDS, and the total protein concentration was determined with the Pierce BCA kit (Thermo Fisher Scientific, Rockford IL) as previously described.
Purine measurements
Purines were measured by high performance liquid chromatography with photodiode array ultraviolet detection (HPLC-UV) as previously described [16, 17]. Cells were grown in an atmosphere of 5% CO2 in DMEM, supplemented with 1 μg/mL of streptomycin, 1 units/mL of penicillin, 2 mM glutamine and 15% fetal calf serum (Invitrogen, Carlsbad, CA). Three tissue culture plates were prepared for each fibroblast culture for triplicate assay. The medium was replaced with fresh medium one day before harvesting. Cells were grown to near confluency. A 450 μL aliquot of the cell culture medium was mixed with 50 μL of 1 M percholoric acid and stored at −80°C. The attached cells were trypsinized and pelleted at 500 × g for 5 min. The cell pellets were then resuspended in 50 μL of 0.2 M PCA and stored at −80°C.
The media and cell lysates were thawed and the cell lysate were sonicated on ice for 1 min. The samples were centrifuged at 17,000 × g for 15 min at 4°C to remove the precipitated proteins. The supernatants were transferred into fresh tubes, and the protein pellet was reserved for protein determination. Supernatants of media and cell lysates were neutralized with 2% and 4% (v/v) 3.5 mol/L potassium carbonate, respectively, and incubated on ice for 60 min. After incubation, the potassium perchlorate precipitates were removed at 17,000 × g for 15 min at 4°C. Any further insoluble materials were eliminated by filtration through 0.45 μm PVDF microcentrifuge spin filters (Alltech, Deerfield IL). Purines were measured in the supernatant by HPLC with photodiode array UV detection as previously described [16, 18]. This method resolves and quantifies the most abundant biologically relevant purines including ATP, ADP, AMP, adenosine, adenine, GTP, GDP, GMP/IMP, guanosine, guanine, hypoxanthine, inosine, xanthine and uric acid. Purine analytes were normalized to total protein concentrations in collected materials with the Pierce BCA kit (Thermo Fisher Scientific, Rockford, IL).
Purinosome analysis
Purinosomes were assessed by transient transfection with a plasmid encoding FGAMS-GFP. Fibroblasts were eletroporated using Neon® Transfection System MPK5000 (Life Technologies, USA) by following manufacture’s protocol with slight modifications. Briefly, 2.5–3 ×10⁵ cells were used for each 10 μL reaction with plasmid DNA at a concentration of 1 μg/μL. Electroporation parameters of 1400 V/20 ms/2 pulses, 1600 V/20 ms/ 1 pulse, or 1700 V/20 ms/1 pulse were applied according to the viability of different cells after transfection. Cells were subsequently transferred to 0.5 mL minimum essential medium (Corning Cellgro) supplemented with 10% fetal bovine serum (FBS, Atlanta Biological S11550).
Approximately 20 h after electroporation, purinosomes were analyzed by fluorescence microscopy. Cells were subject to three 5 min incubations with buffered saline solution (20 mM HEPES pH 7.4, 135 mM NaCl, 5 mM KCl, 1 mM MgCl2, 1.8 mM CaCl2 and 5.6 mM glucose) before imaging. All samples were imaged at ambient temperature using a Nikon TE-2000E inverted microscope equipped with a 60 × 1.49 numerical aperture objective and a photometrics CoolSnap ES2 CCD detector. GFP detection was accomplished by using an S484/15x excitation filter, S517/30m emission filter, and Q505LP/HQ510LP dichroic (Chroma Technology). Nikon NIS-Elements software (3.0) was used for collecting images samples were viewed using a mercury fiber illuminator. Approximately 7500 cells from each case expressing FGAMS-GFP were counted. Purinosomes were assessed as the ratio of number of cells containing fluorescent cytoplasmic clustering to the number of cells with green fluorescence.
Data analysis
For each case, Hprt or Gprt enzyme activities were determined for 4 independent cultures, and results presented as average values ± SEM. Assay results were compared across the different patient subgroups: normal controls (n = 21), HRH (n = 6), HND (n = 9), and LND (n = 21). Since data were not normally distributed, the groups were analyzed using the Kruskal-Wallis test for non-parametric measures, with p < 0.05 as the criterion for statistical significance. Correlations between Hprt and Gprt activities were performed by linear regression using Sigmaplot (Systat Software, Inc. San Jose CA).
Purine measurements were made from 3 independent tissue culture plates for each case, and evaluated by the Kruskal-Wallis test for non-parametric measures, with p < 0.05 as the criterion for statistical significance. Purinosomes among patients groups also were compared suing the Kruskal-Wallis test for non-parametric measures, with p < 0.05 as the criterion for statistical significance.
Results
Fibroblast cultures
Dermal fibroblast cultures were prepared for 21 subjects with LND, 9 with HND, 6 with HRH, and 21 healthy controls. Most cultures had a typical spindle-shaped morphology and rapid growth rate. There were no obvious differences in the growth habits or morphologies of cultures from subjects with HGprt deficiency compared with controls, but a few cultures grew distinctly slower with larger soma, suggestive of early senescence.
Hprt enzyme activity
For healthy controls, the mean hypoxanthine recycling activity was 2101.6 ± 490.2 pmol/mg/h (range, 1544.1 to 3297.5 pmol/mg/h; median, 1960.0 pmol/mg/h). For subjects with LND, the mean residual activity was 21.4 ± 17.2 pmol/mg/h, corresponding to 1.0 % of normal. Values ranged between 7.7 to 63.6 with a median of 14.2 pmol/mg/h (Table 1). The lower limit of detection was estimated from 6 subjects with mutations predicted to cause a null protein, such as non-sense mutations, deletions or frame-shifting mutations. In these cases, mean residual activity was 11.3 ± 2.2 pmol/mg/h, corresponding to 0.5% of normal.
Table 1.
Results for HGprt deficient subjects.
| ID | Phenotype | Genotype | Hprt (pmol/mg/h) | Gprt (pmol/mg/h) |
|---|---|---|---|---|
| BF | HRH | c.548T>C | 669.5±56.7 | 1043.8±33.4 |
| JF | HRH | c.548T>C | 123.3±9.1 | 189.3±1.9 |
| KG | HRH | c.582C>G | 185.3±13.3 | 174.7±11.7 |
| LG | HRH | c.582C>G | 47.0±2.1 | 44.7±1.2 |
| MS | HRH | c.239A>T | 396.1±16.4 | 715.4±34.6 |
| RB | HRH | c.601G>A | 94.3±2.2 | 222.1±11.1 |
| AA | HND | c.[128T>G;130G>A] | 335.1±21.6 | 786.2±39.0 |
| BT | HND | c.599G>C | 109.6±6.7 | 219.8±19.6 |
| DD | HND | c.143G>A | 640.6±41.0 | 1264.8±51.1 |
| DM | HND | g.ex2_3dup | 23.2±3.0 | 45.9±2.1 |
| EH | HND | c.500G>T | 31.6±2.4 | 72.7±4.5 |
| JGS | HND | c.212G>T | 115.5±5.4 | 149.4±5.7 |
| JR | HND | c.3G>A | 37.3±3.9 | 67.8±2.3 |
| LW | HND | c.148G>C | 23.7±0.3 | 34.2±1.3 |
| MM | HND | c.27+1G>T | 23.0±1.5 | 27.0±1.6 |
| AE | LND | g.ex1del | 13.5±1.4 | 11.6±0.6 |
| BW | LND | c.611A>G | 12.0±0.8 | 17.6±1.6 |
| CC | LND | c.140A>T | 63.6±3.0 | 153.2±8.3 |
| CH | LND | c.532+5G>A | 21.7±0.7 | 24.2±3.5 |
| DN | LND | coding region normal | 23.8±2.4 | 23.9±2.5 |
| DP | LND | c.508C>T | 13.3±2.6 | 26.7±3.8 |
| DS | LND | not available | 15.0±0.8 | 18.1±2.6 |
| ES | LND | c.580G>A | 14.2±0.3 | 22.5±1.2 |
| FD | LND | c.580G>C | 14.1±2.5 | 13.4±1.0 |
| GB | LND | c.428_432delinsAGCAAA | 16.0±1.5 | 21.8±4.0 |
| HE | LND | g.ex1del | 11.7±0.6 | 25.6±1.2 |
| JH | LND | c.532+5G>A | 14.2±0.4 | 21.9±2.6 |
| LH | LND | c.151C>T | 7.7±1.2 | 12.4±0.7 |
| LR | LND | c.27+1G>T | 13.0±0.8 | 19.8±1.2 |
| MC | LND | c.140A>G | 55.6±4.8 | 143.9±2.7 |
| MC2 | LND | c.140A>G | 62.3±4.0 | 152.7±13.7 |
| PB | LND | g.ex4del | 9.9±1.1 | 13.5±2.1 |
| TH | LND | c.151C>T | 11.9±0.8 | 13.8±1.3 |
| TS | LND | c.373_374dupTT | 14.5±0.8 | 25.4±3.0 |
| WM | LND | e3(146–147)delTTinsC | 10.7±0.6 | 23.5±1.7 |
| ZL | LND | not available | 31.6±2.9 | 65.4±3.1 |
The attenuated variant cases had residual Hprt activity intermediate between controls and LND. Those with HRH had a mean of 252.6 ± 237.9 pmol/mg/h corresponding to 12.0% of control (range, 47.0 to 669.5; median, 154.3 pmol/mg/h). Those with HND had a mean of 148.9 ± 210.0 pmol/mg/h corresponding to 7.1% of control (range, 23.0 to 640.6; median, 37.3 pmol/mg/h) (Table 1). The Kruskal-Wallis test for non-parametric measures revealed highly significant differences among the subject subgroups (p<0.001). There was no overlap among the subjects with HGprt deficiency and the normal controls. However, there were some overlapping values among the patient groups (Figure 1). For example, one case with HRH had Hprt activity that fell in the same range as those for HND. Five cases with HND also had Hprt activity that overlapped with those for LND. Four of these cases were clinically indistinguishable from LND, except for the absence of self-injury.
Figure 1.
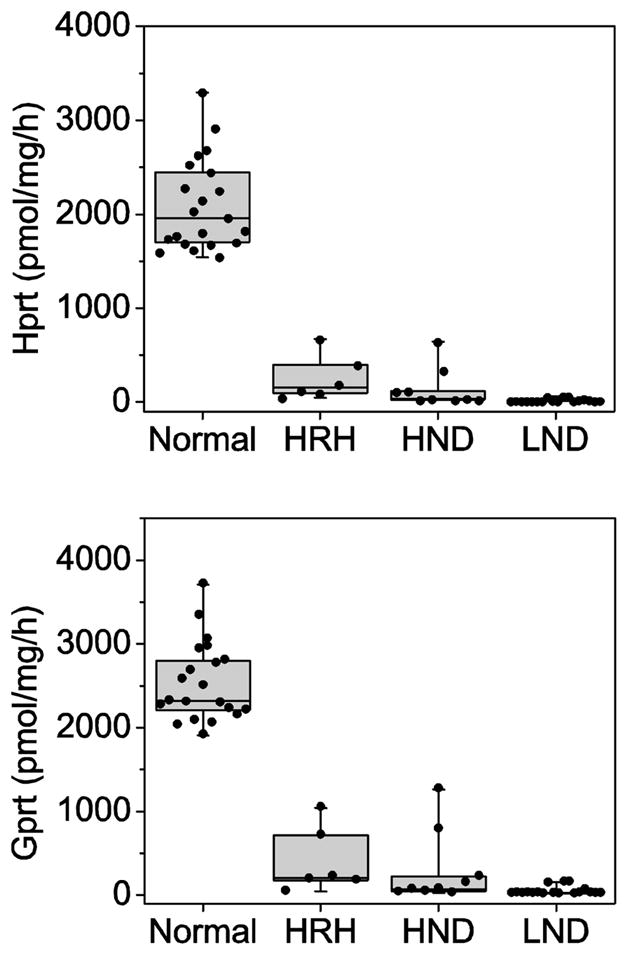
Enzyme activity and clinical severity. The enzyme activities for Hprt and Gprt are presented as box-whisker plots. The middle horizontal line in each box shows the median. The upper and lower limits of box define the upper and lower quartiles of the data. The whiskers span the entire data range. Each dot represents a single case, which was determined in quadruplicate.
Gprt enzyme activity
For healthy controls, the mean guanine recycling activity was 2530.7 ± 471.9 pmol/mg/h (range, 1908.7 to 3709.7; median, 2318.1 pmol/mg/h). For subjects with LND, the mean residual activity was 40.5 ± 47.1 pmol/mg/h, corresponding to 1.6 % of normal. Values ranged between 11.6 to 153.2 with a median of 22.5 pmol/mg/h (Table 1). The mean residual activity of 6 cases will null mutations was 17.3 ± 6.9 pmol/mg/h, corresponding to 0.7% of normal.
The attenuated variant cases had residual Hprt activity intermediate between controls and LND. Those with HRH had a mean residual activity of 398.3 ± 391.7 pmol/mg/h corresponding to 15.7% of control (range, 44.7 to 1043.8; median, 205.7 pmol/mg/h). Those with HND had a mean residual activity of 296.4 ± 434.7 pmol/mg/h corresponding to 11.7% of control (range, 27.0 to 1264.8; median of 72.7 pmol/mg/h) (Table 1). The Kruskal-Wallis test again revealed highly significant differences among the groups (p<0.001). Once again, there was no overlap among the subjects with HGprt deficiency and the normal controls, but there was some overlap among the patient groups (Figure 1).
Correlations between Hprt and Gprt
To identify any cases with skewed loss of activity toward one purine substrate, we calculated correlations between Hprt and Gprt activities. For all subjects combined, residual Hprt and Gprt activities were highly correlated (R = 0.97; Figure 2). A strong correlation was present even when the subjects with HGprt deficiency (R = 0.98) or normal controls (R = 0.81) were examined as separate groups to avoid statistical artifacts associated with bimodal distribution of results. Only a few cases showed unequal loss of Hprt or Gprt activity.
Figure 2.
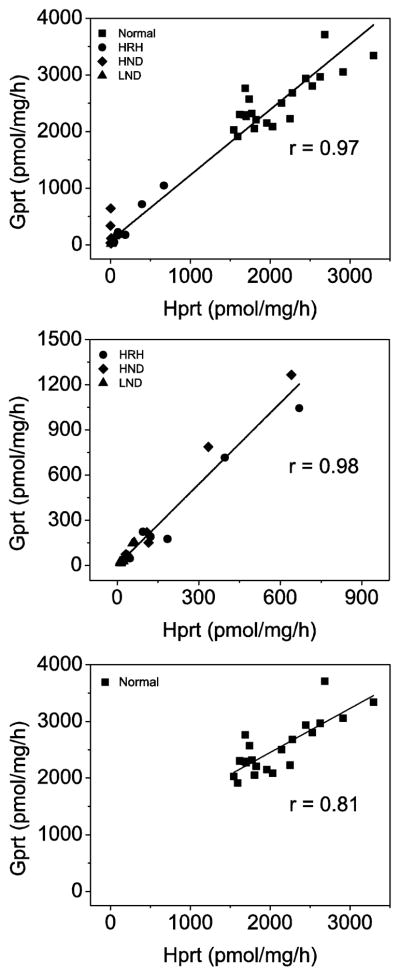
Correlation of Hprt and Gprt activities. Each case was determined in quadruplicate and shown as a separate symbol. The groups are normal controls (squares), LND (triangles), HND (diamonds), and HRH (circles). The line shows the empirically-derived correlation of Hprt to Gprt by linear regression.
Purine levels
The failure of purine recycling in HGprt deficient fibroblasts should impact cellular purine levels, but prior studies have been inconsistent with decreases [19] increases [20] or no changes [21, 22]. These discrepancies may reflect the relatively small numbers of cases studied, or culture conditions under which the cells were studied.
In our fibroblasts, the major intracellular purines were ATP and GTP, followed by ADP, GDP and AMP. Other purine metabolites were below limits of detection including GMP, inosine, guanosine, and adenosine. The Kruskal-Wallis test indicated that there was no statistically difference among healthy controls and patient subgroups (p > 0.05) for intracellular purines (Table 3).
Table 3.
Summary of extracellular and intracellular purine nucleotides level.
| Phenotype | LND | HND | HRH | normal |
|---|---|---|---|---|
| Intracellular purines (nmol/mg protein) | ||||
| AMP | 0.39 ± 0.24 | 0.64 ± 0.92 | 0.63 ± 0.56 | 0.56 ± 0.45 |
| GDP | 0.61 ± 0.16 | 0.73 ± 0.36 | 0.81 ± 0.20 | 0.75 ± 0.22 |
| ADP | 3.34 ± 0.78 | 3.94 ± 1.87 | 4.05 ± 1.15 | 4.14 ± 1.28 |
| GTP | 8.09 ± 1.40 | 8.97 ± 1.53 | 8.92 ± 1.59 | 7.85 ± 2.00 |
| ATP | 24.38 ± 3.54 | 26.70 ± 4.17 | 25.98 ± 3.76 | 25.71 ± 5.17 |
|
| ||||
| Extracellular purines (μmol/mg protein) | ||||
| Hypoxanthine | 0.51 ± 0.12 | 0.62 ± 0.26 | 0.49 ± 0.19 | 0.23 ± 0.10 |
| Xanthine | 0.42 ± 0.10 | 0.43 ± 0.19 | 0.44 ± 0.13 | 0.34 ± 0.09 |
| Uric acid | 0.36 ± 0.11 | 0.39 ± 0.19 | 0.37 ± 0.11 | 0.27 ± 0.13 |
| Adenine | 0.21 ± 0.05 | 0.25 ± 0.09 | 0.21 ± 0.07 | 0.17 ± 0.04 |
The major purines detected in the extracellular medium were free purine bases. Compared with controls, the patient fibroblasts as a group showed increases in hypoxanthine (+130%), xanthine (+24%), uric acid (+37%), and adenine (+29%). Guanine was below limits of detection, most likely because it is rapidly metabolized to xanthine. There were no statistically significant differences among patient subgroups. The normal intracellular purines combined with increases in extracellular purines implies that reduced purine salvage results in wasting of purines that is compensated by an increase in purine synthesis. The lack of significant differences between patients with complete or partial HGprt deficiency argues that this compensation is similar regardless of the degree of HGprt deficiency.
Purinosome formation
We next examined purinosomes, multi-protein aggregates that form when there is increased demand for purine synthesis. Formylglycinamidine synthetase (FGAMS) catalyzes the 4th enzymatic step in the de novo synthetic pathway and is an established marker for purinosomes [13]. A cDNA construct encoding GFP-tagged FGAMS was transiently transfected into fibroblast cultures and purinosomes were quantified by live cell fluorescence microscopy. In fibroblast cultures from healthy controls, transfected cells displayed a diffuse cytoplasmic distribution of fluorescence similar to other cells grown under purine-rich conditions (Figure 3A). Only 5% of the cells exhibited cytoplasmic clustering of fluorescence with a shape and distribution similar to the purinosomes previously observed in other cells cultured under purine-depleted condition. In contrast, approximately 30% of fibroblasts from LND and its variants exhibited cytoplasmic clustering suggestive of purinosomes (Figure 3B). The differences in the percentages of cells with purinosomes between controls and patients were statistically significant by the Kruskal-Wallis test (p<0.05), although there were no significant differences among the patient subgroups (Figure 4). These results suggest purine synthesis through de novo pathway is activated to a similar degree by complete or partial HGprt deficiency, consistent with the relatively similar increase in purine metabolites wasted among the patient groups (Table 3).
Figure 3.
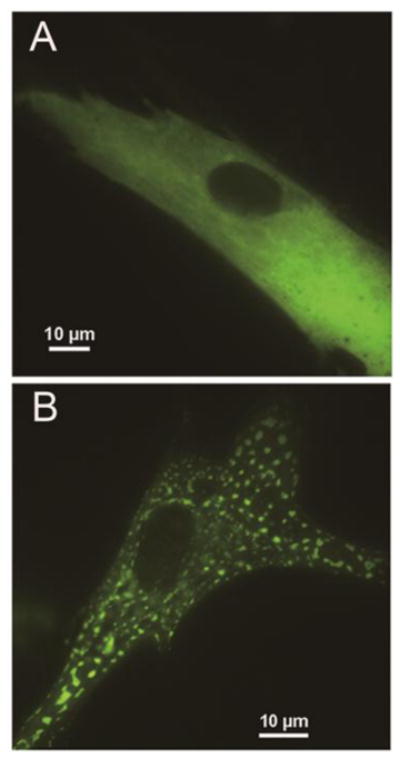
Purinosomes in fibroblasts. (A) Diffuse fluorescence in the control fibroblast cells transfected with FGAMS-GFP. (B) Representative images of purinosomes formed in LND fibroblast cells. FGAMS-GFP is used as a purinosome marker. Representative images of diffuse fluorescence in the control cells transfected with FGAMS-GFP (A) were clearly distinct from those of the HGprt-deficient patients (B)
Figure 4.

Quantification of purinosomes in fibroblasts from controls and HGprt deficient patients. Five LND subjects (PB, DP, CC, TS, and TH), four HND subjects (JGS, BT, LW, and DD), three HRH subjects (RB, LG, and BF), and six controls (MG, CH2, JS, SK, AR, and AK) were evaluated. The ratio of cells containing purinosome is presented as box-whisker plots for the controls and each patient subgroup. Purinosomes were quantified by calculating the ratio of cells forming fluorescent cytoplasmic clustering over cells expressing diffuse fluorescent staining. The middle horizontal line in each box shows the median, and the quartiles of each clinical group are shown as the upper and lower limits of box.
Discussion
More than 600 clinically relevant HPRT1 mutations have been reported, with varying influence on residual HGprt enzyme function and overall severity of the clinical syndrome [1, 23]. The current studies confirm a strong relationship between the severity of the clinical syndrome and residual enzyme activity, regardless of the nature of the mutation. Although reduced HGprt activity appears to have little impact on intracellular purine nucleotides, purine metabolites released into the extracellular environment are increased. This constant loss of purines to the extracellular space with normal intracellular purines implies a constant demand for synthesis of new purines via the de novo pathway. This increased demand is consistent with the increase in purinosomes in fibroblasts from the HGprt-deficient subjects.
Comparisons between different HGprt enzyme assays
We previously examined residual HGprt activities for some of the same cases studied here using a cell-free assay that involved introducing the mutation into a normal HPRT1 cDNA by site directed mutagenesis, cloning the cDNA into a bacterial expression vector, expressing the protein in E. coli, purifying the mutant protein, and testing its residual activity towards hypoxanthine or guanine [24]. These prior studies focused on point mutations, because early stop codons and frame-shifting mutations lead to marked distortion of protein structure and cannot be evaluated using the cell-free assay. A comparison of the results from the prior the cell-free assay and the current live cell assay is shown in Table 2. To aid more direct comparisons, residual activities were normalized by expressing them as a percent of the corresponding control group.
Table 2.
Comparisons of live cell and in vitro assays for HGprt.
| Mutation | Live cell assay | Engineered protein assay | |||||
|---|---|---|---|---|---|---|---|
| velocity (% of normal) | velocity (% of normal) | Km of PRPP (fold of normal) | Stability after 72 h | ||||
| Hprt | Gprt | Hprt | Gprt | Hprt | Gprt | % of starting | |
|
|
|
||||||
| c.[128T>G;130 G>A] | 17.1 | 33.9 | 46.5 | 59.8 | 1.3 | 1.3 | 12 |
| c.140A>T | 2.8 | 6.2 | 75.3 | 70.4 | 3.7 | 22.5 | 32 |
| c.140A>T | 3.2 | 6.6 | 75.3 | 70.4 | 3.7 | 22.5 | 32 |
| c.143G>A | 32.7 | 54.6 | 69.9 | 107 | 2.1 | 1.6 | 49 |
| c.148G>C | 1.2 | 1.5 | NA | NA | NA | NA | NA |
| c.212G>T | 5.9 | 6.4 | 42.3 | 0.2 | 153 | 14.2 | 0 |
| c.239A>T | 20.2 | 30.9 | 53.9 | 21.7 | 3.5 | 7.2 | 16 |
| c.580G>A | 0.7 | 1.0 | NA | NA | NA | NA | NA |
| c.582C>G | 9.5 | 7.5 | 69 | 5.6 | 125.2 | 242 | 43 |
| c.582C>G | 2.4 | 1.9 | 69 | 5.6 | 125.2 | 242 | 43 |
| c.599G>C | 5.6 | 9.5 | 19.6 | 15.7 | 24 | 13.3 | 53 |
| c.601G>A | 4.8 | 9.6 | 20.6 | 7.3 | 20.6 | 28.4 | NA |
The kinetic parameters of Hprt or Gprt were normalized to the native enzyme in both live cell assay and in vitro protein assay. Data for the in vitro protein assay were derived from our prior report [8]. NA = not available.
Results from the cell-free assay generally showed significantly higher activities than the live cell assay (Table 2). For example, the mutant c.140A>T (p.glu47gly) showed more than 70% residual activity in the cell-free assay (as measured by enzyme apparent velocity), but less than 4% residual activity in the live cell assay. The most likely explanation for this discrepancy is that the c.140A>T mutant also has poor structural stability [24]. This finding suggests that low residual activity in the live cell assay for this mutant may reflect rapid loss of enzyme integrity in living cells, in comparison with freshly engineered protein tested in vitro.
Another illustrative example is the mutant c.582C>G (p.asp194glu), which showed nearly 70% activity in the cell free assay but only 2.4–9.5% residual activity in the live cell assay. The c.582C>G mutant also has markedly lowered affinity for PRPP [24], suggesting that the discrepancy is due to varying concentrations of available PRPP assays. Thus the high concentrations of PRPP in the cell free assay can drive maximal enzyme velocity much faster in comparison to the much lower amounts of PRPP endogenously available in a living fibroblast. It also is important to note that residual enzyme activity varied from 2.4–9.5% in the live cell assay from two brothers carrying the same mutation (KG and LG, Tables 1–2). This could reflect measurement error in the live cell assay, or the quality of fibroblast cultures. We noticed that cultures that grow slowly with large cells tended to have significantly lower HGprt activity than more rapidly growing cultures. This observation suggests that some caution is needed when interpreting results from the live cell assay.
Intracellular purine pools
The lack of HGprt-mediated purine salvage might be expected to result in intracellular purine deficiency. However, results from prior studies have yielded inconsistent results [16]. Some studies reported reduced purine levels [19], some reported increases [20], and others showed no significant changes [21, 22]. On the other hand, increases in extracellular purine metabolites are more consistently found in HGprt-deficient cells [16]. The normal intracellular purine levels combined with increases in extracellular purine metabolites implies a continual loss of purines from the cell with tight control of intracellular levels that must be achieved by a compensatory increase in purine synthesis. Indeed, many prior studies have shown an increase in de novo purine synthesis in HGprt-deficient cells [16], and the high frequency of purinosomes found in fibroblasts in the current study supports this view.
The observation that purinosome frequency is elevated in HGprt-deficient fibroblasts regardless of disease severity argues that the increase in purine synthesis is not responsible for differences in disease severity. Instead, the relatively similar increases in purinosomes across the spectrum of HGprt deficiency implies a threshold effect, where even a small decrement in intracellular purines triggers a maximal increase in purine synthesis. The relatively normal intracellular purine pools argue that the increase in purine synthesis is sufficient to compensate for the loss of purine recycling. However, there may be circumstances where an unusually high demand for purines exceeds the ability of the de novo pathway to compensate. For example, the synthesis of new DNA during the S1 phase of the cell cycle consumes large amounts of purines, and could lead to transient purine deficiency. Another circumstance could involve neurons that release purines as neurotransmitters such as adenosine, guanosine, and their related nucleotides [25, 26]. These neurons may be particularly vulnerable to purine deficiency during periods of high activity.
The proposal that variable increases in de novo purine synthesis do not substantially contribute to disease severity is consistent with prior studies showing that uric acid overproduction and its consequences vary minimally across the spectrum of disease [4]. They also are consistent with observations that uric acid itself does not contribute to the pathogenesis of the neurobehavioral features of HGprt deficiency. Thus levels of uric acid among patients who have HRH without neurological or behavioral problems are not substantially different from those with LND who have significant neurobehavioral problems. In addition, treatment of patients with LND with allopurinol to control uric acid levels even from birth has no influence on the evolution of neurobehavioral features [27].
Conclusion
These studies confirm that there is a strong relationship between residual HGprt enzyme activity and the overall severity of disease in LND and its variants. This relationship is evident when measuring either residual hypoxanthine or guanine recycling, which appear to be highly correlated. The enzyme-phenotype relationship appears to be stronger when using the live fibroblast assay that more closely recapitulates the in vivo environment, compared with other purely in vitro based assays [24]. Despite loss of purine recycling, there are no significant decrements in intracellular purines, presumably because of increased synthesis of purines by the alternative de novo pathway. However, changes in these potentially compensatory pathways do not appear to be related to overall disease severity. Thus residual HGprt enzyme activity appears to be the major determinant of clinical severity in LND and its variants.
Highlights.
Residual hypoxanthine or guanine recycling correlates with disease severity
The fibroblast assay provides better relationship to disease than other in assays
Increased purinosomes suggest increased purine synthesis in patient fibroblasts
Increased purine synthesis does not correlate with disease severity
Residual HGprt is the major determinant of severity in LND and its variants
Acknowledgments
These studies were supported by the Lesch-Nyhan Syndrome Children’s Research Foundation and grants HD 053312 and GM024129 from the National Institutes of Health.
Footnotes
Publisher's Disclaimer: This is a PDF file of an unedited manuscript that has been accepted for publication. As a service to our customers we are providing this early version of the manuscript. The manuscript will undergo copyediting, typesetting, and review of the resulting proof before it is published in its final citable form. Please note that during the production process errors may be discovered which could a3ect the content, and all legal disclaimers that apply to the journal pertain.
References
- 1.Jinnah HA, DeGregorio L, Harris JC, Nyhan WL, O'Neill JP. The spectrum of inherited mutations causing HPRT deficiency: 75 new cases and a review of 196 previously reported cases. Mutat Res. 2000;463:309–326. doi: 10.1016/s1383-5742(00)00052-1. [DOI] [PubMed] [Google Scholar]
- 2.Fu R, Chen CJ, Jinnah HA. Genotypic and phenotypic spectrum in attenuated variants of Lesch-Nyhan disease. Mol Genet Metab. 2014;112:280–285. doi: 10.1016/j.ymgme.2014.05.012. [DOI] [PMC free article] [PubMed] [Google Scholar]
- 3.Torres RJ, Puig JG, Jinnah HA. Update on the phenotypic spectrum of Lesch-Nyhan disease and its attenuated variants. Curr Rheumatol Rep. 2011;14:189–194. doi: 10.1007/s11926-011-0231-5. [DOI] [PMC free article] [PubMed] [Google Scholar]
- 4.Jinnah HA, Ceballos-Picot I, Torres RJ, Visser JE, Schretlen D, Verdu A, Larovere LE, Chen CJ, Cossu A, Wu CH, Sampat R, Change SJ, de Kremer RD, Nyhan WL, Harris JC, Reich SG, Puig JG. Attenuated variants of Lesch-Nyhan disease. Brain. 2010;133:671–689. doi: 10.1093/brain/awq013. [DOI] [PMC free article] [PubMed] [Google Scholar]
- 5.Schretlen DS, Harris JC, Park KS, Jinnah HA, Ojeda del Pozo N. Neurocognitive functioning in Lesch-Nyhan disease and partial hypoxanthine-guanine phosphoribosyltransferase deficiency. J Int Neuropsychol Soc. 2001;7:805–812. doi: 10.1017/s135561770177703x. [DOI] [PubMed] [Google Scholar]
- 6.Matthews WS, Solan A, Barabas G. Cognitive functioning in Lesch-Nyhan syndrome. Dev Med Child Neurol. 1995;37:715–722. doi: 10.1111/j.1469-8749.1995.tb15017.x. [DOI] [PubMed] [Google Scholar]
- 7.Anderson LT, Ernst M, Davis SV. Cognitive abilities of patients with Lesch-Nyhan disease. J Autism Dev Disord. 1992;22:189–203. doi: 10.1007/BF01058150. [DOI] [PubMed] [Google Scholar]
- 8.Anderson LT, Ernst M. Self-injury in Lesch-Nyhan disease. J Autism Dev Disord. 1994;24:67–81. doi: 10.1007/BF02172213. [DOI] [PubMed] [Google Scholar]
- 9.Nyhan WL. Behavior in the Lesch-Nyhan syndrome. J Autism Child Schizophren. 1976;6:235–252. doi: 10.1007/BF01543464. [DOI] [PubMed] [Google Scholar]
- 10.Schretlen DS, Ward J, Meyer SM, Yun J, Puig JG, Nyhan WL, Jinnah HA, Harris JC. Behavioral aspects of Lesch-Nyhan disease and it variants. Dev Med Child Neurol. 2005;47:673–677. doi: 10.1017/S0012162205001374. [DOI] [PubMed] [Google Scholar]
- 11.Page T, Nyhan WL. The spectrum of HPRT deficiency: an update. Adv Exp Med Biol. 1989;253A:129–133. doi: 10.1007/978-1-4684-5673-8_20. [DOI] [PubMed] [Google Scholar]
- 12.Page T, Bakay B, Nissinen E, Nyhan WL. Hypoxanthine-guanine phosphoribosyltranferase variants: correlation of clinical phenotype with enzyme activity. J Inherit Metab Dis. 1981;4:203–206. doi: 10.1007/BF02263652. [DOI] [PubMed] [Google Scholar]
- 13.An S, Kumar R, Sheets ED, Benkovic SJ. Reversible compartmentalization of de novo purine biosynthetic complexes in living cells. Science. 2008;320:103–106. doi: 10.1126/science.1152241. [DOI] [PubMed] [Google Scholar]
- 14.Jinnah HA, Visser JE, Harris JC, Verdu A, Larovere L, Ceballos-Picot I, Neychev V, Torres RJ, Dulac O, Desguerre I, Schretlen DJ, Robey KL, Barabas G, Bloem BR, Nyhan WL, Kremer R, EGE, Puig JG, Reich SG. Delineation of the motor disorder of Lesch-Nyhan disease. Brain. 2006;129:1201–1217. doi: 10.1093/brain/awl056. [DOI] [PMC free article] [PubMed] [Google Scholar]
- 15.Wood AW, Becker MA, Minna JD, Seegmiller JE. Purine metabolism in normal and thioguanine-resistant neuroblastoma. Proc Natl Acad Sci (USA) 1973;70:3880–3883. doi: 10.1073/pnas.70.12.3880. [DOI] [PMC free article] [PubMed] [Google Scholar]
- 16.Shirley TL, Lewers JC, Egami K, Majumdar A, Kelly M, Ceballos-Picot I, Seidman MM, Jinnah HA. A human neuronal tissue culture model for Lesch-Nyhan disease. J Neurochem. 2007;101:841–853. doi: 10.1111/j.1471-4159.2007.04472.x. [DOI] [PubMed] [Google Scholar]
- 17.Gottle M, Burhenne H, Sutcliffe D, Jinnah HA. Purine metabolism during neuronal differentiation: the relevance of purine synthesis and recycling. Journal of neurochemistry. 2013;127:805–818. doi: 10.1111/jnc.12366. [DOI] [PMC free article] [PubMed] [Google Scholar]
- 18.Lewers JC, Ceballos-Picot I, Shirley TL, Mockel L, Egami K, Jinnah HA. Consequences of impaired purine recycling in dopaminergic neurons. Neuroscience. 2008;152:761–772. doi: 10.1016/j.neuroscience.2007.10.065. [DOI] [PMC free article] [PubMed] [Google Scholar]
- 19.Fairbanks LD, Jacomelli G, Micheli V, Slade T, Simmonds HA. Severe pyridine nucleotide depletion in fibroblasts from Lesch-Nyhan patients. Biochem J. 2002;366:265–272. doi: 10.1042/BJ20020148. [DOI] [PMC free article] [PubMed] [Google Scholar]
- 20.Hussain SP, Duley JA, Connolly GP. Purine and pyrimidine levels in cultured skin fibroblasts from control and Lesch-Nyhan fibroblasts. Cell Molec Biol Lett. 1999;4:377. [Google Scholar]
- 21.Rosenbloom FM, Henderson JF, Caldwell IC, Kelley WN, Seegmiller JE. Biochemical bases of accelerated purine biosynthesis de novo in human fibroblasts lacking hypoxanthine-guanine phosphoribosyltransferase. J Biol Chem. 1968;243:1166–1173. [PubMed] [Google Scholar]
- 22.Nuki G, Astrin K, Brenton D, Cruikshank M, Lever J, Seegmiller JE. Purine and pyrimidine nucleotide concentrations in cells with decreased hypoxanthine-guanine-phosphoribosyltransferase (HGPRT) activity. Adv Exp Med Biol. 1977;76A:326–340. doi: 10.1007/978-1-4613-4223-6_41. [DOI] [PubMed] [Google Scholar]
- 23.Fu R, Ceballos-Picot I, Torres RJ, Larovere LE, Yamada Y, Nguyen KV, Hegde M, Visser JE, Schretlen DJ, Nyhan WL, Puig JG, O'Neill PJ, Jinnah HA, Lesch-Nyhan G Disease International Study. Genotype-phenotype correlations in neurogenetics: Lesch-Nyhan disease as a model disorder. Brain : a journal of neurology. 2014;137:1282–1303. doi: 10.1093/brain/awt202. [DOI] [PMC free article] [PubMed] [Google Scholar]
- 24.Fu R, Jinnah HA. Genotype-phenotype correlations in Lesch-Nyhan disease: moving beyond the gene. J Biol Chem. 2012;287:2997–3008. doi: 10.1074/jbc.M111.317701. [DOI] [PMC free article] [PubMed] [Google Scholar]
- 25.Abbracchio MP, Burnstock G, Verkhratsky A, Zimmermann H. Purinergic signalling in the nervous system: an overview. Trends Neurosci. 2009;32:19–29. doi: 10.1016/j.tins.2008.10.001. [DOI] [PubMed] [Google Scholar]
- 26.Burnstock G, Krugel U, Abbracchio MP, Illes P. Purinergic signalling: from normal behaviour to pathological brain function. Progress in neurobiology. 2011;95:229–274. doi: 10.1016/j.pneurobio.2011.08.006. [DOI] [PubMed] [Google Scholar]
- 27.Marks JF, Baum J, Keele DK, Kay JL, MacFarlen A. Lesch-Nyhan syndrome treated from the early neonatal period. Pediatr. 1968;42:357–359. [PubMed] [Google Scholar]