Figure 3.

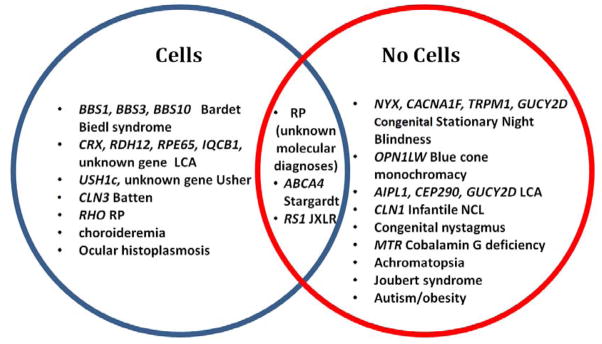
Venn diagram of patient diagnoses with genotypes, between cell and no cell populations. Patients with diagnoses of cone-rod dystrophy, retinal dystrophy, cone dystrophy, and RP were included under RP in this diagram.

Venn diagram of patient diagnoses with genotypes, between cell and no cell populations. Patients with diagnoses of cone-rod dystrophy, retinal dystrophy, cone dystrophy, and RP were included under RP in this diagram.