

Abstract
OBJECTIVE
We sought to determine a microRNA (miRNA) profile of surgically staged endometrial cancers.
STUDY DESIGN
RNA was extracted from archival primary endometrial cancers, and an miRNA profile was established using a microarray and confirmed with real-time polymerase chain reaction. Targets of differentially expressed miRNAs were explored using real-time polymerase chain reaction and Western blot in endometrial cell lines.
RESULTS
Endometrial cancer has an miRNA profile distinct from normal endometrium, even in patients with stage IA grade 1 tumors. This miRNA cancer profile was able to correctly assign a specimen as a malignancy with a sensitivity of 92%. Overexpressed miRNAs were predicted to target PTEN, and transfection of cell lines with these miRNAs led to down-regulation of PTEN expression. In advanced disease, an miRNA pattern distinct from early-stage disease was seen, and overexpression of mir-199c predicted improved cancer survival in this population.
CONCLUSION
Endometrial cancer has a distinct miRNA profile, and miRNAs can be used as a predictive biomarker.
Keywords: biomarker, endometrial cancer, microRNA
Endometrial cancer is the most common malignancy of the female genital tract, with an estimated 42,160 cases expected in 2009 and 7780 deaths due to the disease.1 Surgery is typically curative, with the majority of women presenting with early-stage disease. Nonendometrioid (type II) endometrial cancers, however, tend to present at more advanced stages, are more aggressive, and are associated with different molecular fingerprints.2
There is emerging research about the role of microRNAs (miRNAs) in a variety of pathologic conditions, including both solid and hematologic malignancies. miRNAs are short, 22- to 25-nucleotide noncoding sequences of RNA. These sequences control gene expression either by translational repression or degradation of the messenger RNA transcript. These miRNAs may be up-regulated or down-regulated in various tumor types, thus displaying their roles as potential tumor suppressors or oncogenes. The target of the miRNA is the 3’UTR (untranslated region) of the messenger RNA. Early studies with Caenorhabditis elegans showed that a great number of these sequences are highly conserved across all species, demonstrating the important roles that miRNAs play in cellular differentiation, proliferation, and cell cycle control.3 Extensive work has thus far been accomplished with leukemias, lymphomas, and a variety of solid tumors.4,5 High-risk sub-types of leukemia are able to be identified by miRNA profiles, and targeted, personalized treatment can be accomplished.6 The miRNA fingerprint of gynecologic malignancies is in its infancy; to date, limited data existed describing miRNAs in endometrial cancer.7-10 Here, we present a comprehensive analysis of the miRNA profile of surgically staged early and advanced endometrial cancers and investigate targets associated with differentially expressed miRNAs and their value as predictive biomarkers.
Materials and Methods
Patients
Following approval from the Cancer Institutional Review Board of The Ohio State University College of Medicine, Columbus, OH, all patients with primary stage I endometrioid endometrial cancers and stages III and IV endometrioid and nonendometrioid endometrial cancers surgically managed by the Division of Gynecologic Oncology, Department of Obstetrics and Gynecology at The Ohio State University Medical Center, Columbus, OH, from January 1997– July 2003, were identified from a clinical database. Patients who underwent comprehensive surgical staging (including extrafascial or radical hysterectomy, bilateral salpingo-oophorectomy, and bilateral pelvic and paraaortic lymphadenectomy) were selected for analysis. In general, patients with uterine-confined disease who are comprehensively staged do not undergo any adjuvant therapy. Data regarding patient demographics, operative findings, tumor pathology, and survival were recorded from the source data.
miRNA microarray
The 2-mm archived paraffin-embedded tissue cores were obtained from primary surgical specimens. Although microdis-section was not used, cases were selected that had adequate material for macroscopic dissection to assure >75% neoplastic cellularity. The cores were deparaffinized in 1 mL of xylene and heated at 50°C for 3 minutes. RNA extraction was performed using specified instructions with the RecoverAll kit (Ambion, Austin, TX). RNA concentrations were measured using the NanoDrop-1000 (NanoDrop Technologies Inc, Wilmington, DE) and were generally between 10 ng–5 μ,g of RNA. Due to the duration of time between primary surgery and RNA extraction, this RNA was often degraded but still usable for miRNA analysis. In brief, 5 μ,g of total RNA were reverse transcribed using biotin-labeled random octamer oligonucleotide primer. The biotin-labeled complementary DNA targets were hybridized to the miRNA chip (OSUCCC [Ohio State University Comprehensive Cancer Center] chip v.3) that contains the oligo probes generated and derived from 326 human and 249 mouse miRNA genes printed in duplicate. After hybridization, the chips were processed for signal detection and amplification using streptavidin Alexa-647 (Invitrogen, Carlsbad, CA) conjugate. The processed array slides were scanned on a microarray scanner (Axon 4000B; Axon Instruments, Sunnyvale, CA). The microarray data were extracted by GenePix Pro software (Axon Instruments) and exported as a *.gpr data file. For the analysis of the stages III and IV cancers, 20 unselected stage I endometrial cancers and all of the advanced-stage cancers were screened using the OSUCCC chip v.4 array (which expands the number of miRNAs from v.3).
Statistical analysis
Microarray images were analyzed using GenePix Pro 6.0 software. Average values of the replicate spots of each miRNA were background subtracted, normalized, and further analyzed. Normalization was performed using a global median. The miRNAs identified as having statistically significant differential expression were measured as present in at least as many samples as the smallest class in the dataset (25%). Absent calls were thresholded to 4.5 (log2 scale) before statistical analysis, representing the average minimum intensity level detectable in the system. More than 95% of blank probes (negative controls) fall below the threshold value of 4.5. MiRNAs differentially expressed at a 2-fold level were considered to be significant.
miRNA signatures were determined by the class prediction (biometric research branch) method.11 Six methods of prediction were used: compound covariate predictor, diagonal linear discriminate analysis, nearest neighbor (using k = 1 and 3), nearest centroid, and support vector machines. The compound covariate predictor and support vector machines are only implemented for the case when the phenotype variable contains only 2 class labels, whereas the diagonal linear discriminate analysis, k-nearest neighbor, and nearest centroid may be used even when the phenotype variable contains >2 class labels. The class prediction analysis was also performed on paired samples. The criterion for inclusion of a gene in the predictor was a P value less than a specified threshold value. For the 2-classes prediction problem, a specified limit on the univariable misclassification rate was used instead of the parametric P value. The output contains the result of the permutation test on the cross-validated misclassification rate, and a listing of genes that comprise the predictor, with parametric P values for each gene and the coefficient of variation-support percent (percent of times when the gene was used in the predictor for a leave-one-out cross-validation procedure).
The ability to classify a specimen into a class was assessed by calculating the sensitivity (the probability for a sample to be predicted to be in its correct class) and positive predictive value (the probability that a sample predicted to be in a class is actually in that class). To determine the association of specific miRNAs with survival, Kaplan-Meier survival analysis was performed. The 2 populations were compared with the log-rank test, and P < .05 was considered to be a statistically significant difference in survival.
DNA mismatch repair
DNA mismatch repair (MMR) status was determined using a tissue microarray stained with antibodies against the MMR gene protein products MLH1, MSH2, MSH6, and PMS2.
Targeting of PTEN by mir-200c
Targets of specific miRNAs were investigated using bioinformatics technology. “Confirmed” targets are those targets that have been experimentally confirmed and reported, while “predicted” targets are those based on sequence similarity without experimental confirmation. Confirmed targets were examined on http://diana.cslab.ece.ntua.gr. Predicted targets were examined with http://microrna.sanger.ac.uk/sequences. RL95-2 and KLE endometrial cancer cell lines (kindly provided by Paul J. Goodfellow, PhD, Washington University School of Medicine, St. Louis, MO) were grown in culture and harvested. RL95-2 cells were grown in Dulbecco’s modified Eagle Medium/10% fetal bovine serum/antibiotic. KLE cells were grown in Ham’s F12/10% FBS/antibiotic. The cells were grown to 90% confluence, at which time they were washed with phosphate-buffered saline (PBS), trypsinized, and centrifuged. Cell pellets were frozen at − 80°C until RNA or protein extraction was performed.
For transfections, cell lines were grown to 90% confluence, at which time they were trypsinized and resuspended in 30 mL of PBS. A cell counter was used to determine viable cells/mL. Approximately 2 × 10⁶ cells were plated and grown in media devoid of antibiotic. Twenty-four hours later the transfections of the cells with the specific miRNAs were performed using lipofectamine (Ambion) according to the manufacturer’s instructions. Cells were harvested at 24, 48, and 72 hours and the protein extracted. Western blotting was performed utilizing antibodies to both PTEN and a standard housekeeping gene.
miRNA Northern blots
For Northern blot analysis, 5 μg of total RNA was separated on a 15% denaturing polyacrylamide gel. The gels were washed and stained with ethidium bromide for 5 minutes. The presence of RNA was confirmed using ultraviolet illumination. Gels were then washed and the RNA was electrotransferred to Hybond-N+ membranes (Amersham Biosciences, Buckinghamshire, UK) overnight. Oligonucleotide probes complementary to mir-200c were labeled with γ-adenosine triphosphate. Hybridization to the membrane was performed at 42°C overnight and the membrane was then washed in 2X saline-sodium phosphate-ethylene diaminetetraacetic acid/0.1% sodium dodecyl sulfate (SDS) and 0.5X saline-sodium phosphate-ethylene diaminetetraacetic acid/0.1% SDS for 15 minutes each. The membrane was then exposed to a phosphor-screen (GE Healthcare Life Sciences, Piscataway, NJ) overnight. Imaging was performed on the Typhoon 9410 variable mode imager (GE Healthcare Life Sciences).
Quantitative real-time polymerase chain reaction
The single tube TaqMan miRNA assays were used to detect and quantify mature miRNAs on real-time (RT) polymerase chain reaction (PCR) instruments (Applied Biosystems, Foster City, CA). All reagents, primers, and probes were obtained from Applied Biosystems. RNU44 was used to normalize all RNA samples. Reverse transcriptase reactions and RT-PCR were performed according to the manufacturer’s protocols, except 7.5 and 10 μ,L were used for the RT and PCR reactions, respectively. RNA concentrations were determined with a Nano-Drop. A total of 1 ng RNA per sample was used for the assays. All RT reactions, including no-template controls and RT minus controls, were run in a GeneAmp PCR 9700 Thermocycler (Applied Bio-systems). Gene expression levels were quantified using the ABI Prism 7900HT sequence detection system (Applied Bio-systems). Comparative RT-PCR was performed in triplicate, including no-template controls. Relative expression was calculated using the comparative Ct method.
Gene expression
All reagents, primers, and probes were obtained from Applied Biosystems. Glyceraldehyde 3-phosphate dehydrogenase was used to normalize all RNA samples. Reverse transcriptase reactions and RT-PCR were performed according to the manufacturer’s protocols. RNA concentrations were determined with a NanoDrop. A total of 150 ng RNA per sample was used for the assays. All RT reactions, including no-template controls and RT minus controls, were run in a GeneAmp PCR 9700 Thermocycler. Gene expression levels were quantified using the ABI Prism 7900HT sequence detection system. Comparative RT-PCR was performed in triplicate, including no-template controls. Relative expression was calculated using the comparative Ct method.
Western blot
Protein was extracted from the endometrial cancer cell lines using the cell lysis buffer according to the manufacturer’s specified instructions. In all, 50 μg of total protein was mixed with electrophoresis sample buffer (125 mmol/L Tris-hydrochloric acid, 2% SDS, 5% glycerol, .003% bromophenol blue, and 1% beta-mercaptoethanol). The samples were heated to 100°C for 10 minutes. The samples were loaded into a gel and1L of running buffer was added to the apparatus. The gel electrophoresed at 100 V until the protein band was approximately 1 cm from the bottom of the gel. The gel was subsequently transferred to the filter using a blotting apparatus. The filter was incubated with mouse monoclonal antibodies for PTEN overnight (1:1000; Santa Cruz Biotechnology, Inc., Santa Cruz, CA). The filter was subsequently washed with Tween/PBS for 25, 5, and 5 minutes. The secondary antibody was diluted per manufacturer’s instructions in Tween/PBS/1 g nonfat dry milk. The filter was incubated for 1.5 hours at room temperature. The antibody solution was decanted and the filter was washed with Tween/PBS for 25, 5, and 5 minutes. The washing solution was decanted, the development solution (electrochemiluminescence) was added, and the tray was agitated for 1 minute. The filter was dried between 2 pieces of 3-mm paper and exposed to x-ray film (Denville Scientific, Metuchen, NJ) for approximately 2 minutes and developed.
Results
Subjects
Of the 478 patients available for study in the divisional endometrial cancer database, 141 were selected who were surgically staged and had adequate archival material for RNA extraction. Of these patients, 121 had stage I disease (surgical stage IA, IB, and IC disease comprising 37%, 43%, and 20%, respectively, of the overall stage I group) (Table 1); all had endometrioid histology. Of the 20 patients with advanced disease, 10 (50%) had stage III and 10 (50%) had stage IV disease. In the group of patients with advanced disease, 7 were endometrioid and 13 serous adenocarcinomas (Table 1). Twenty unmatched endometrial samples (10 premenopausal unselected for menstrual day and 10 postmenopausal) served as the unaffected control population.
TABLE 1.
Characteristics of 141 cases
| Tumor stage | n |
|---|---|
| Stage I endometrioid | 121 |
|
| |
| Stage IA grade 1 | 59 |
|
| |
| Stage IA grade 2 | 4 |
|
| |
| Stage IA grade 3 | 0 |
|
| |
| Stage IB grade 1 | 24 |
|
| |
| Stage IB grade 2 | 11 |
|
| |
| Stage IB grade 3 | 1 |
|
| |
| Stage IC grade 1 | 7 |
|
| |
| Stage IC grade 2 | 12 |
|
| |
| Stage IC grade 3 | 3 |
|
| |
| Stage II | 0 |
|
| |
| Stage III | 10 |
|
| |
| Stage III endometrioid | 3 |
|
| |
| Stage III serous | 7 |
|
| |
| Stage IV | 10 |
|
| |
| Stage IV endometrioid | 4 |
|
| |
| Stage IV serous | 6 |
|
| |
Cohn. Comprehensive miRNA profiling of surgically staged endometrial cancer. Am J Obstet Gynecol 2010.
Expression profiling–stage I endometrioid cancers vs controls
When comparing stage I endometrioid cancers to normal controls, we identified 7 miRNAs that were overexpressed and 8 that were underexpressed in the cancer group (Figure 1 and Table 2). By utilizing the 6 prediction methods described in the “Materials and Methods” section, a cluster of miRNAs was found that could accurately classify a sample as cancer or control with a sensitivity (the probability for a tumor sample to be correctly predicted as tumor) of 92.2% and a positive predictive value (the probability that a sample predicted as tumor actually belongs to that group) of 97%.
FIGURE 1. Heatmap of microRNA expression.

Hierarchical clustering of endometrial cancers (T) vs control endometrium (N) demonstrating up-regulated (green) and down-regulated (red ) microRNAs (miRNAs). Insert : differential pattern of miRNAexpression between Tand N.
Cohn. Comprehensive miRNA profiling of surgically staged endometrial cancer. Am J Obstet Gynecol 2010.
TABLE 2.
Differential microRNA expression in endometrial cancers
| mlRNA | stage I vs control |
Stage IA grade 1 vs control |
|---|---|---|
| mir-516 | 0.491 | |
|
| ||
| let-7a | 0.451 | 0.43 |
|
| ||
| mir-424 | 0.366 | 0.391 |
|
| ||
| mir-496 | 0.354 | 0.34 |
|
| ||
| mir-409 | 0.499 | 0.475 |
|
| ||
| mir-451 | 0.374 | 0.371 |
|
| ||
| mir-431 | 0.486 | |
|
| ||
| mir-516 | 0.492 | |
|
| ||
| mir-503 | 0.48 | 0.457 |
|
| ||
| mir-369 | 0.484 | |
|
| ||
| mir-032 | 0.492 | |
|
| ||
| mir-033b | 0.496 | |
|
| ||
| mir-425 | 2.11 | 2.017 |
|
| ||
| mir-181c | 2.047 | |
|
| ||
| mir-l9b | 2.058 | |
|
| ||
| mir-009 | 2.084 | |
|
| ||
| mir-205 | 2.202 | 2.296 |
|
| ||
| mir-423 | 2.35 | |
|
| ||
| mir-223 | 2.318 | 2.238 |
|
| ||
| mir-183 | 2.508 | 2.548 |
|
| ||
| mir-146 | 2.663 | 2.464 |
|
| ||
| mir-200c | 3.407 | 3.224 |
|
| ||
Relativs expression ratios or differentially expressed microRNAs in stage I endomentioid endometrial cancers compared with controls, as well as to stage IA grade 1 endometrial cancers (p < .001).
miRNA, microRNA.
Cohn. Comprehensive miRNA profiling of surgically staged endometraial cancer. Am J Obstet Gynecol 2010.
Northern blot analysis confirmed the microarray data. Overexpression of mir-200c (which was seen in endometrial cancers on the microarray) was confirmed in 5 unselected stage I endometrial cancer specimens when compared with 5 normal endometrial specimens. Additionally, quantitative RT-PCR confirmed the microarray and Northern blot analysis, demonstrating increased expression of mir-200c (as well as mir-183, -205, -223, and -425) when compared with normal endometrial specimens (Figure 2).
FIGURE 2. Differential expression of microRNA by RT-PCR.
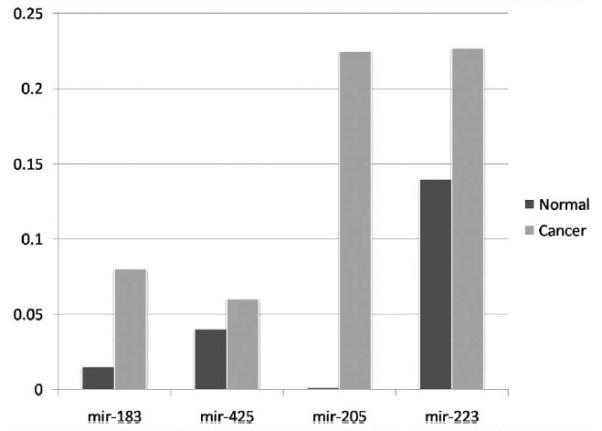
2^ (delta Ct) values for selected microRNAs (miRNAs) (-183, -425, -295, and -223) in endometrial cancers (lighter bars) compared with controls (darker bars), all demonstrating increased miRNA expression in cases. Similar results were seen for mir-200c.
Cohn. Comprehensive miRNA profiling of surgically staged endometrial cancer. Am J Obstet Gynecol 2010.
Expression profiling–stage IA grade 1 vs controls
Even in patients with the earliest confirmed malignancy (surgical stage IA grade 1 endometrioid cancers), we identified a panel of 19 miRNAs with at least 2-fold differences in expression compared with the normal controls (Table 2). Importantly, 12 of these deregulated miRNAs were commonly shared between the stage IA grade 1 and the overall stage I groups (rather than the stage IA grade 1 group segregating with the normal controls) (Table 2).
Expression profiling–intact vs defective DNA MMR
In an effort to further elucidate the biology of endometrial cancer, we studied the miRNA patterns of specimens with and without defective DNA MMR. Of a subset of 115 stage I endometrioid cancers studied, 38 (33%) lacked expression of 2:1 of the DNA MMR proteins and were classified as having defective DNA MMR. Compared with the tumors with an intact DNA MMR system, we identified 6 miRNAs (mir-029a, -126, -1-2, -143, -125b, and -133) that had at least a 2-fold reduction in expression in tumors with defective DNA MMR (P < .001) (Table 3). Importantly, 3 of these underexpressed miRNAs target the DNA MMR genes MLH1 or MSH2. Furthermore, 2 of the miRNAs are known to target DNMT3A, the gene known to regulate epigenetic modulation, which is the main mechanism of DNA MMR in sporadic endometrial cancer. Interestingly, there were no significantly overexpressed miRNAs between these populations and no overlap between the underexpressed miRNAs in the defective MMR group and the overall stage I endometrial cancer group.
TABLE 3.
Differential microRNA expression stratified by mismatch repair status
| miRNA | MSS vs MSI-H |
Target |
|---|---|---|
| mir-29a | 0.457 | MSH2, DNMT3A |
|
| ||
| mir-126a | 0.494 | MSH2 |
|
| ||
| mir-1(2) | 0.422 | MLH1 |
|
| ||
| mir-143 | 0.436 | DNTM3A |
|
| ||
| mir-125b | 0.436 | |
|
| ||
| mir-133 | 0.485 | |
|
| ||
Relative expression ratios or differentially expressed microRNAs between endometrioid endometrial cancers with intact DNA mismatch repair system and those with defective DNA mismatch repair (with microsatellite instability. MSI-H; all comparisons P < .001).
miRNA, microRNA; MSS, mismatch repair status.
Cohn. Comprehensive miRNA profiling of surgically staged endometrial cancer. Am J Obstet Gynecol 2010.
Targets of deregulated miRNAs
In the group of miRNAs overexpressed in stage I endometrioid endometrial cancers, it is predicted that mir-200c and mir-183 target PTEN (which is altered in 40–60% of endometrial cancers). Using quantitative RT-PCR, increased levels of mir-183 were seen in cells with lower PTEN expression, suggesting a relationship between mir-183 and its predicted target, PTEN (Figure 3). Following transfection of the endometrial cancer cell line KLE with mir-183, Western blotting demonstrated a progressive decrease in PTEN protein expression following transfection, further arguing for the targeting of PTEN by mir-183 in endometrial cancer (data not shown). Investigation of the targeting of PTEN by mir-200c in the endometrial cancer cell line RL95-2 demonstrated similar results (data not shown), confirming the targeting of PTEN by miRNAs in endometrial cancer.
FIGURE 3. Expression of PTEN and mir-183 in endometrial cancer cells.
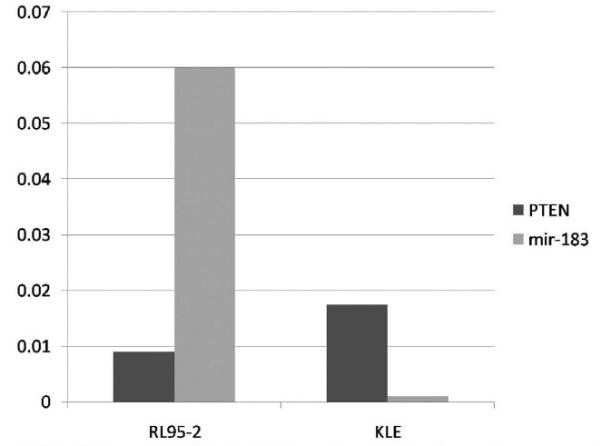
2^ (delta Ct) differences in PTEN and mir-183 expression at baseline, demonstrating presence of PTENinbothcell lines, andlowmir-183expressioninKLEcells. At 72hoursafter transfectionof these cell lines with mir-183, decreased PTEN protein expression was noted by Western blot. Identical results were shown after transfection with mir-200c (data not shown). Negative controls (mock and scramble) demonstrated no change in PTENexpression.
Cohn. Comprehensive miRNA profiling of surgically staged endometrial cancer. Am J Obstet Gynecol 2010.
miRNA expression in advanced endometrial cancers and patient survival
Given the relatively poor outcome of women diagnosed with advanced endometrial cancer, we then set out to characterize the expression of miRNAs in stages III and IV endometrial cancer and to determine whether miRNAs could serve as a biomarker predictive of patient outcome. First, we characterized the miRNA profile of stage I vs 20 stages III and IV cancers and demonstrated that an miRNA profile could correctly differentiate between stage I and advanced-stage disease with a sensitivity of 94.5%. Within this profile, 11 up-regulated (Table 4) and 7 down-regulated miRNAs were identified that showed >3-fold differential expression (P > .001) compared with stage I endometrioid cancers. Importantly, mir-149, which demonstrated <4-fold relative overexpression compared with early-stage cancers, is known to target TP53, the most common genetic alteration in advanced endometrial cancer.
TABLE 4.
Differential microRNA expression in advanced stage cancers
| miRNA | Stages III/IV vs I |
|---|---|
| mir-145a | 3.945 |
|
| |
| let-7a | 3 |
|
| |
| let-7c | 3.07 |
|
| |
| mir-10b | 3.186 |
|
| |
| mir-123 | 3.004 |
|
| |
| mir-26a | 3.6 |
|
| |
| mir-125b1 | 3.655 |
|
| |
| mir-125b2 | 3.89 |
|
| |
| mir-143 | 4.199 |
|
| |
| mir-133a | 8.87 |
|
| |
| mir-26a1 | 3.6 |
|
| |
Relative expression ratios of differentially (>3-fold) overexpressed microRNAs in stages III and IV endometrial cancers compared with stage I endometrioid endometrial cancers (P < .001).
miRNA, microRNA
Cohn. Comprehensive miRNA profiling of surgically staged endometrial cancer. Am J Obstet Gynecol 2010.
When patients with advanced disease were stratified by their outcome (presence or absence, recurrence, or death from disease), mir-199a was more commonly overexpressed in the subset of patients who did not experience recurrence or death from disease (despite not being differentially expressed compared with controls). Both median progression-free survival (13.3 vs 26.7 months; P = .048) (Figure 4, A) and median overall survival (20 vs 40 months; P = .0068) (Figure 4, B) were significantly improved when mir-199a was overexpressed.
FIGURE 4. Expression of mir-199a predicts cancer outcome.

Survival comparison for mir-199a-5p, demonstrating A, significantly improved median progression-free(13.3 vs26.7 months; P = .048)and B, overall (20 vs40 months; P = .0068)survival whenthis microRNAis overexpressed.
Cohn. Comprehensive miRNA profiling of surgically staged endometrial cancer. Am J Obstet Gynecol 2010.
Comment
We offer a comprehensive analysis of the role of miRNAs and their targets in endometrial carcinogenesis. We have demonstrated an endometrial cancer miRNA profile that is distinct from normal endometrium and shown that this pattern holds up even in the case of very early malignancy. We have also shown a distinct pattern of miRNAs in advanced disease and demonstrated that miRNAs can dometrial cancer outcomes.
Importantly, let-7a, an miRNA notably underexpressed in a number of solid tumors, was underexpressed in endometrial cancers compared with normal controls. There are a number of interesting confirmed and predicted targets associated with let-7a, including KRAS (confirmed) and HMGA2 (predicted). HMGA2 is an embryonic gene, the expression of which is correlated with cell tumorigenicity.12 The underexpression of let-7 in addition to the reexpression of HMGA2 appears to differentiate not only between normal tissue and cancer but also between early and advanced stages. The common alteration of KRAS in early endometrial cancer is also interesting and presents biologic relevance to the underexpression of let-7a in this disease.
Although most patients with endometrial cancer are diagnosed early in the disease course, there are still many patients who are diagnosed late and who will die of their disease. In patients with stages III and IV disease, we demonstrate a distinct miRNA profile, as well as the ability of a single miRNA to predict patient outcomes. We are continuing to identify targets of the differentially expressed miRNAs in advanced disease in hopes of exploiting these markers as pre-dictive or therapeutic targets. Our identification of a significantly overexpressed miRNA that targets TP53 (the most common genetic alteration in advanced endometrial cancer) is interesting and deserves continued investigation. We believe the finding of a very distinct miRNA profile in tumors with defective DNA MMR is intriguing; while MMR genes may themselves be targeted by miRNAs, the underexpressed miRNAs common to all endometrial cancers may have a role in malignant transformation by targeting common oncogenes. In fact, predicted targets of the underexpressed miRNAs have been shown to target the known MMR genes MLH1 and MSH2 as well as DNMT3A, which is known to be responsible for methylation. Thus, underexpression of miRNAs targeting such a gene responsible for methylation may lead to increased epigenetic silencing, thereby leading to defective DNA MMR, as has previously been shown in colorectal cancer.
The finding of 2 miRNAs in endometrial cancer that target the commonly mutated tumor suppressor gene PTEN is also exciting and may open the door for miRNA-based cancer therapies in endometrial cancer. It is interesting, however, that our results are different from those of others, who demonstrated that deletion of PTEN in a mouse model was associated with decreased expression of mir-199 and mir-101.8 The finding of a specific miRNA associated with cancer outcomes in advanced endometrial cancer also provides evidence that these noncoding RNAs can serve as prognostic cancer biomarkers. Continued investigation of these miRNAs will be important to further elucidate endometrial cancer biology.
There are, however, limitations of our research. While a pathologist marked the primary tumor specimens prior to the procurement of cores, there is the chance of contamination with normal tissue, necrotic tissue, and potentially atypical endometrial hyperplasia (a biologic precursor to endometrial cancer). Our rationale for explicitly investigating stage IA grade 1 endometrioid endometrial cancers separately was to see whether this early invasive disease (which can be difficult to distinguish from atypical endometrial hyperplasia) has a pattern that segregates with more cancer or controls; the fact that stage IA grade 1 cancers do in fact segregate with malignancy (rather than normal) may lead to the use of miRNA technology to identify patients with atypical hyperplasia who are at risk for having or developing cancer that can be referred to physicians with expertise in surgical staging.13,14 Our study benefits from the fact that patients were comprehensively surgically staged, minimizing the risk of stage migration that could bias the results. Additionally, the use of the techniques of RT-PCR and Northern blot to confirm the microarray data leads to confidence in our results.
In summary, we believe that miRNA research, while in its early stages in endometrial cancer, holds great promise. We have demonstrated the ability of miRNAs to identify a cancer phenotype, predict survival, and target commonly altered genes in endometrial cancer. We hope that this work leads to continued investigation of miRNAs as predictive and therapeutic targets in women with endometrial cancer with the hopes of improving patient outcomes.
Footnotes
Presented at the 28th Annual Meeting of the American Gynecological and Obstetrical Society, Chicago, IL, Sept. 10-12, 2009.
REFERENCES
- 1.Jemal A, Siegel R, Ward E, Hao Y, Xu J, Thun MJ. Cancer statistics, 2009. CA Cancer J Clin. 2009;59:225–49. doi: 10.3322/caac.20006. [DOI] [PubMed] [Google Scholar]
- 2.Bokhman JV. Two pathogenetic types of endometrial carcinoma. Gynecol Oncol. 1983;15:10–7. doi: 10.1016/0090-8258(83)90111-7. [DOI] [PubMed] [Google Scholar]
- 3.Jannot G, Simard MJ. Tumor-related microRNAs functions in Caenorhabditis elegans. Oncogene. 2006;25:6197–201. doi: 10.1038/sj.onc.1209921. [DOI] [PubMed] [Google Scholar]
- 4.Bloomston M, Frankel WL, Petrocca F, et al. MicroRNA expression patterns to differentiate pancreatic adenocarcinoma from normal pancreas and chronic pancreatitis. JAMA. 2007;297:1901–8. doi: 10.1001/jama.297.17.1901. [DOI] [PubMed] [Google Scholar]
- 5.Iorio MV, Visone R, Di Leva G, et al. MicroRNA signatures in human ovarian cancer. Cancer Res. 2007;67:8699–707. doi: 10.1158/0008-5472.CAN-07-1936. [DOI] [PubMed] [Google Scholar]
- 6.Calin GA, Croce CM. Genomics of chronic lymphocytic leukemia microRNAs as new players with clinical significance. Semin Oncol. 2006;33:167–73. doi: 10.1053/j.seminoncol.2006.01.010. [DOI] [PubMed] [Google Scholar]
- 7.Boren T, Xiong Y, Hakam A, et al. MicroRNAs and their target messenger RNAs associated with endometrial carcinogenesis. Gynecol Oncol. 2008;110:206–15. doi: 10.1016/j.ygyno.2008.03.023. [DOI] [PubMed] [Google Scholar]
- 8.Daikoku T, Hirota Y, Tranguch S, et al. Conditional loss of uterine Pten unfailingly and rapidly induces endometrial cancer in mice. Cancer Res. 2008;68:5619–27. doi: 10.1158/0008-5472.CAN-08-1274. [DOI] [PMC free article] [PubMed] [Google Scholar]
- 9.Chung TK, Cheung TH, Huen NY, et al. Dysregulated microRNAs and their predicted targets associated with endometrioid endometrial adenocarcinoma in Hong Kong women. Int J Cancer. 2009;124:1358–65. doi: 10.1002/ijc.24071. [DOI] [PMC free article] [PubMed] [Google Scholar]
- 10.Wu W, Lin Z, Zhuang Z, Liang X. Expression profile of mammalian microRNAs in endometrioid adenocarcinoma. Eur J Cancer Prev. 2009;18:50–5. doi: 10.1097/CEJ.0b013e328305a07a. [DOI] [PubMed] [Google Scholar]
- 11.Liu CG, Calin GA, Volinia S. Croce CM. MicroRNA expression profiling using microarrays. Nat Protoc. 2008;3:563–78. doi: 10.1038/nprot.2008.14. [DOI] [PubMed] [Google Scholar]
- 12.Park SM, Shell S, Radjabi AR, et al. Let-7 prevents early cancer progression by suppressing expression of the embryonic gene HMGA2. Cell Cycle. 2007;6:2585–90. doi: 10.4161/cc.6.21.4845. [DOI] [PubMed] [Google Scholar]
- 13.Trimble CL, Kauderer J, Zaino R, et al. Concurrent endometrial carcinoma in women with a biopsy diagnosis of atypical endometrial hyperplasia: a Gynecologic Oncology Group study. Cancer. 2006;106:812–9. doi: 10.1002/cncr.21650. [DOI] [PubMed] [Google Scholar]
- 14.Zaino RJ, Kauderer J, Trimble CL, et al. Reproducibility of the diagnosis of atypical endometrial hyperplasia: a Gynecologic Oncology Group study. Cancer. 2006;106:804–11. doi: 10.1002/cncr.21649. [DOI] [PubMed] [Google Scholar]