Abstract
Clear cell renal cell carcinoma (ccRCC) is the predominant subtype of renal cell carcinoma (RCC). It is one of the most therapy-resistant carcinomas, responding very poorly or not at all to radiotherapy, hormonal therapy and chemotherapy. A more comprehensive understanding of the deregulated pathways in ccRCC can lead to the development of new therapies and prognostic markers. We performed a meta- analysis of 5 publicly available gene expression datasets and identified a list of co- deregulated genes, for which we performed extensive bioinformatic analysis coupled with experimental validation on the mRNA level. Gene ontology enrichment showed that many proteins are involved in response to hypoxia/oxygen levels and positive regulation of the VEGFR signaling pathway. KEGG analysis revealed that metabolic pathways are mostly altered in ccRCC. Similarly, Ingenuity Pathway Analysis showed that the antigen presentation, inositol metabolism, pentose phosphate, glycolysis/gluconeogenesis and fructose/mannose metabolism pathways are altered in the disease. Cellular growth, proliferation and carbohydrate metabolism, were among the top molecular and cellular functions of the co-deregulated genes. qRT-PCR validated the deregulated expression of several genes in Caki-2 and ACHN cell lines and in a cohort of ccRCC tissues. NNMT and NR3C1 increased expression was evident in ccRCC biopsies from patients using immunohistochemistry. ROC curves evaluated the diagnostic performance of the top deregulated genes in each dataset. We show that metabolic pathways are mostly deregulated in ccRCC and we highlight those being most responsible in its formation. We suggest that these genes are candidate predictive markers of the disease.
Keywords: clear-cell renal cell carcinoma, oncomine, gene expression, metabolic pathways, pathway analysis, gene networks
INTRODUCTION
Renal-cell carcinoma (RCC) is the most common kidney neoplasm, comprising 3% of all adult malignancies [1]. Its incidence has increased steadily over the past 20 years in the United States and Europe; 35,000 new cases and 12,000 deaths now occur annually in the United States alone. If detected in early stages, it is potentially curable by surgical resection; however, to date there is no curative treatment for metastatic RCC. Clear cell renal cell carcinoma (ccRCC) represents the most common subtype (83%) of RCC [2]. The most striking phenotypic feature of ccRCC is its clear cell morphology, which has been linked to lipid and glycogen accumulation [3]. Moreover, ccRCC is one of the most therapy-resistant carcinomas, responding very poorly or not at all to radiotherapy, hormonal therapy and chemotherapy. All these facts emphasize the importance of developing early diagnostic markers for this particular RCC subtype.
Meta-analysis consists of statistical techniques to combine results from several studies in order to increase the statistical power and reproducibility compared with any single study [4]. Microarray gene expression profiling has been used in the past by various groups [5-13] to distinguish the various histological subtypes of RCC and consequently to identify novel tumor markers. The general procedure identifies markers in accordance with average differential expression level (fold change) and/or some level of significance as measured by the t-test. All these publicly available microarray expression datasets provide a rich resource for genome-wide information on RCC and provide the ideal opportunity to perform a meta-analysis study using a large number of cases.
The Oncomine database [14] is an online collection of microarray expression data from various cancer-related sources. We hypothesized that a meta-analysis of several gene expression datasets of ccRCC can give a potentially significant list of co-deregulated genes (co-DEGs) in ccRCC, which is important to define pathways in which the genes of interest are involved. To increase the likelihood of revealing truly significant deregulated genes, which should have higher potentials to be used as novel markers for the disease, we analyzed their expression profile over 5 independent studies, greatly increasing the significance of results.
RESULTS
Identification of candidate ccRCC markers for network analysis
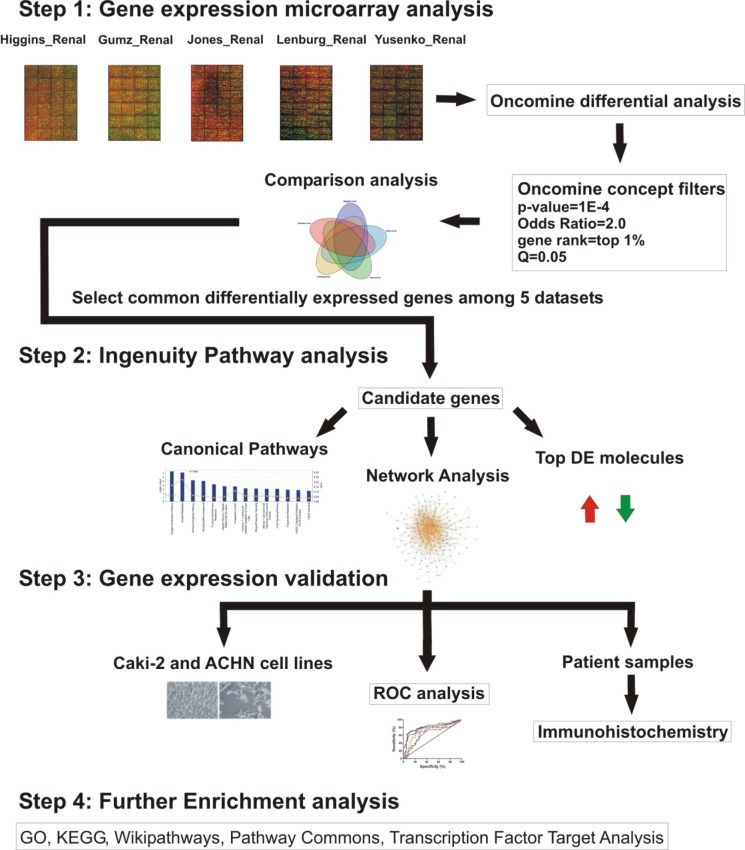
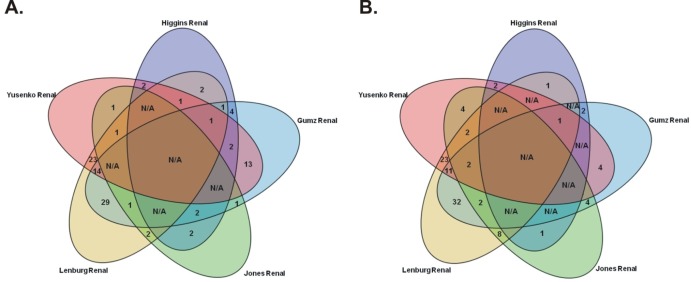
The workflow of our study is summarized in Figure 1. Data mining of five microarray datasets from the Oncomine repository for co- deregulated genes in ccRCC vs. their non-tumor kidney tissue, led to the identification of a list of 93 up- and 76 down-regulated genes, respectively. These genes belonged simultaneously within the top 1% of the up- or down-regulated genes, in at least two datasets, with a p<1E-4 and fold change>2 (Table S1). None of the DEGs belonged simultaneously to the top 1% of the up-regulated genes, in all 5 datasets. The most co- up-regulated gene among 4 datasets was BTN3A3. Twenty genes were co-up-regulated among 3 datasets and 93 genes were co-up-regulated between 2 datasets, respectively (Figure 2.A). A similar approach was performed in order to identify the genes that belonged to the top 1% of the down-regulated genes, simultaneously in all 5 datasets. KCNJ1 and TMPRSS2 were the top co-down-regulated genes, exhibiting low levels of expression in 4 datasets. Fifteen and 81 genes were co-down-regulated in 3 and 2 datasets, respectively (Figure 2.B).
Figure 1. Workflow of the study.
Initially, five Oncomine microarray datasets were compared and the co-deregulated genes (co-DEGs) among them were retrieved. The co-DEGs were further enquired regarding their use as candidate markers for ccRCC. Next, the canonical pathways in which these co-DEGs are implicated were identified, as well as the networks that they form, and the top deregulated molecules among them. Following, validation of the deregulated expression levels of these genes was performed both in clear cell renal cell carcinoma cell lines, as well as in a cohort of ccRCC patients. Immunohistochemistry was performed in biopsies from the patient cohort for the top deregulated genes. ROC analysis was used to evaluate the discriminatory potential of the candidate biomarker genes. Further enrichment analysis was finally performed for the co-deregulated genes.
Figure 2. The Venn diagrams depict the co-upregulated (A) and co-downregulated (B) genes in ccRCC vs. their non-tumor kidney tissue, among Oncomine datasets “Higgins Renal”, “Yusenko Renal”, “Lenburg Renal”,”Jones Renal” and “Gumz Renal”.
Ingenuity Pathway Analysis (IPA) for the top1% of the co-deregulated genes
Canonical Pathways
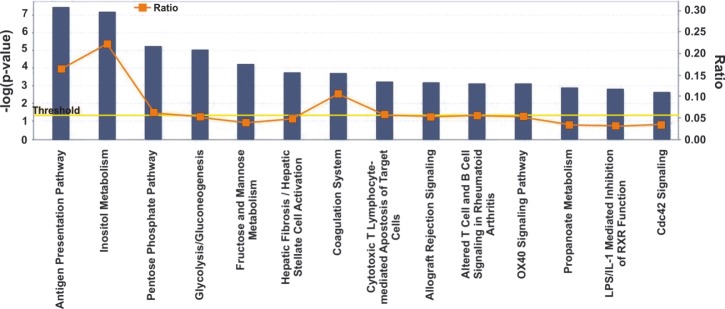
Overall, the majority of our deregulated pathways were related to metabolic processes. Specifically, IPA was focused on the following five canonical pathways: The antigen presentation pathway (p=3.71E-08; Ratio, 0.163), containing HLA-DMB, HLA-DPA1, HLA- DPB1, HLA-DRA, PSMBB, PSMB9 and TAPBP (up-regulated); the inositol metabolism (p=7E-08; Ratio, 0.222), containing ALDOA, ALDOC (up-regulated), ALDH6A1 and ALDOB (down-regulated); the pentose phosphate pathway (p=5.49E-06; Ratio, 0.062), containing ALDOA, ALDOC, PFKP (up-regulated), ALDOB and FBP1 (down-regulated); glycolysis/gluconeogenesis (p=9.03E-06; Ratio, 0.053), containing ALDOA, ALDOC, ENO2, LDHA, PFKP (up-regulated), ALDOB and FBP1 (down-regulated); and fructose and mannose metabolism (p=6.02E-05; Ratio, 0.037), containing ALDOA, ALDOC, PFKP (up-regulated), ALDOB and FBP1 (down- regulated) (Figure 3).
Figure 3. Ingenuity Pathway Analysis (IPA) revealed the top canonical pathways of the top 1% deregulated genes in ccRCC vs. the normal tissue samples, among the 5 Oncomine datasets.
Correlation between ccRCC and other diseases
To detect any possible correlation between ccRCC and other diseases at the genomic level, we compared the DEGs between ccRCC and other disease gene sets. Comparisons were made with the existing genomic data provided by the software. As expected, ccRCC was highly associated with cancer (p=2.35E-11 - 3.13E-03; 77 molecules); inflammatory response (p=2.86E-11 - 3.00E-03; 44 molecules); renal and urological disease (p=3.95E-10 - 3.00E-03; 32 molecules); reproductive system disease (p=4.39E-09 - 3.00E-03; 46 molecules) and respiratory disease (p=4.69E-09 - 3.02E-03; 31 molecules).
Furthermore, IPA identified that the top co-DEGs among the 5 datasets participate in the following molecular and cellular functions: cell-to-cell signaling and interaction (p=1.56E-09 - 3.00E-03; 42 molecules); cellular function and maintenance (p=3.13E-08 - 2.97E- 03; 48 molecules); molecular transport (p=3.13E-08 - 3.00E-03; 51 molecules); cellular growth and proliferation (p=5.01E-08 - 2.85E-03; 59 molecules) and carbohydrate metabolism (p=7.00E-08 - 2.37E-03; 31 molecules). The top 10 up- and down-regulated molecules in ccRCC vs. the normal tissue are depicted in Table 1.
Table 1. Detailed information about the 5 public expression datasets of clear cell renal carcinoma (ccRCC) that were used in the present study.
| Dataset | Platform | GEO Dataset Accession # | Number of ccRCC samples | Number of normal samples | Citation |
|---|---|---|---|---|---|
| Gumz Renal | Affymetrix HU133A & HU133B | GSE6344 | 20 | 20 | Clin Cancer Res. 2007 Aug 15;13(16):4740-9 |
| Higgins Renal | Affymetrix HU133A | GSE4125 | 23 | 3 | Am J Pathol. 2003 Mar;162(3):925-32 |
| Jones Renal | Affymetrix HU133A | GSE15641 | 32 | 23 | Clin Cancer Res. 2005 Aug 15;11(16):5730-9 |
| Lenburg Renal | Affymetrix HU133A & HU133B | GSE781 | 24 | 10 | BMC Cancer. 2003 Nov 27;3:31 |
| Yusenko Renal | Affymetrix HU133A & HU133B | GSE6280 | 6 | 12 | Int J Biol Sci. 2009 Jul 29;5(6):517-27 |
Top Transcription Factors
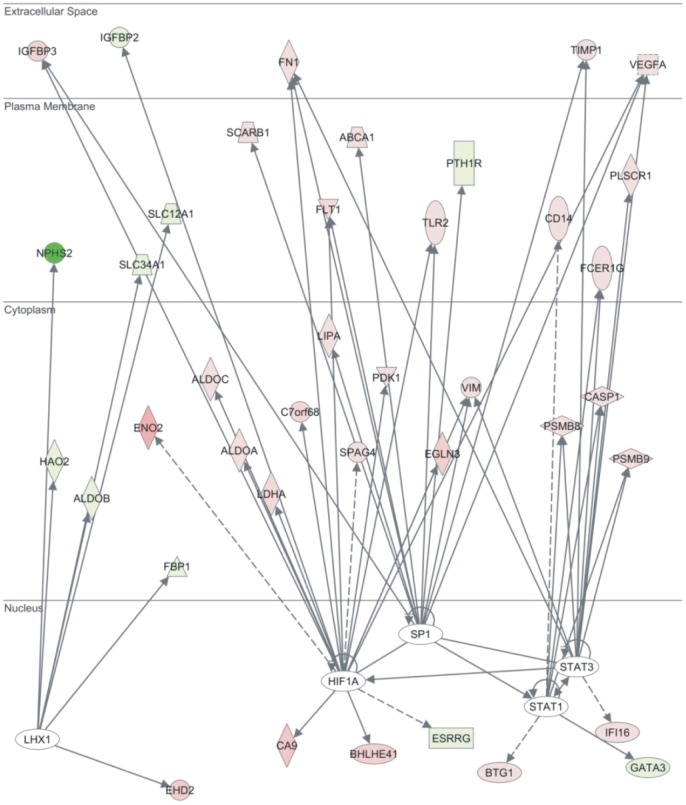
HIF1A, STAT1, STAT3, SP1 and LHX1 were the most significant Transcription Factors implicated in the disease, based on the z-score regulation. HIF1A, STAT1, STAT3 and SP1 were predicted to be activated (HIF1A: z-score = 2.444; overlap p= 5.68E-12; STAT1: z-score = 2.260; overlap p= 1.77E-03; STAT3: z-score = 2.125; overlap p= 4.60E-04; SP1: z-score = 2.103; overlap p= 9.34E-04). On the other hand, LHX1 was predicted to be inhibited (z-score = −2.509; overlap p= 2.13E-06). Specifically, 12 out of the 18 HIF1A target molecules, were identified to have expression direction consistent with the activation of HIF1A (VEGFA, TLR2, PDK1, LDHA, IGFBP3, FLT1, ESRRG, EGLN3, CA9, C7orf68, ALDOC and ALDOA, activated; IGFBP2, inhibited). All STAT1 target genes exhibited expressional direction consistent with the activation of STAT1 (PSMB9, PSMB8, FCER1G, CD14, CASP1 and BTG1, activated; GATA3, inhibited). Six out of the 10 STAT3 target genes had expressional direction consistent with the activation of STAT3 (VIM, VEGFA, TIMP1, PSMB9, PSMB8 and IFI16, activated). Most SP1 target genes (7 out of 11) showed expressional direction consistent with the activation of SP1 (VEGFA, TLR2, SCARB1, LIPA, FN1, FLT1 and ABCA1, activated). Also, the majority of the LHX1 target genes (6 out of 7) had expressional direction consistent with the inhibition of LHX1 (SLC34A1, SLC12A1, NPHS2, HAO2, FBP1 and ALDOB, activated; EHD2, activated) (Figure 4).
Figure 4. Ingenuity Pathway Analysis (IPA) revealed HIF1A, STAT1, STAT3, SP1 and LHX1 among the top Transcription Factors of the top 1% deregulated genes in ccRCC vs. the normal tissue samples, among the 5 Oncomine datasets.
Gene Networks
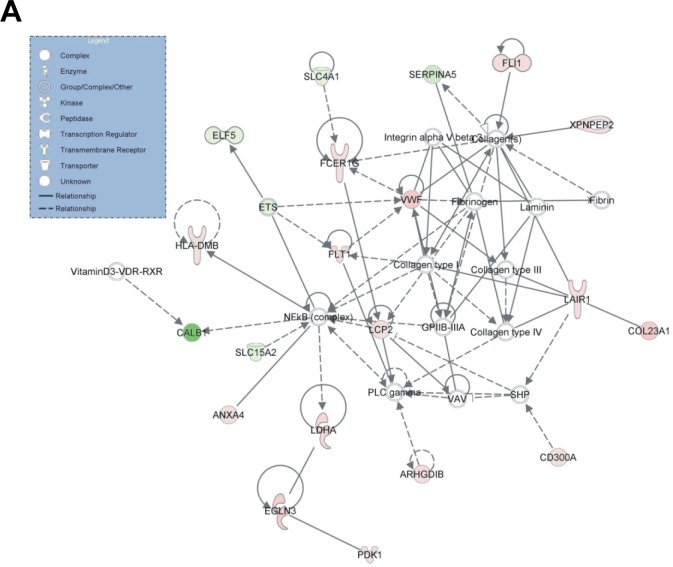
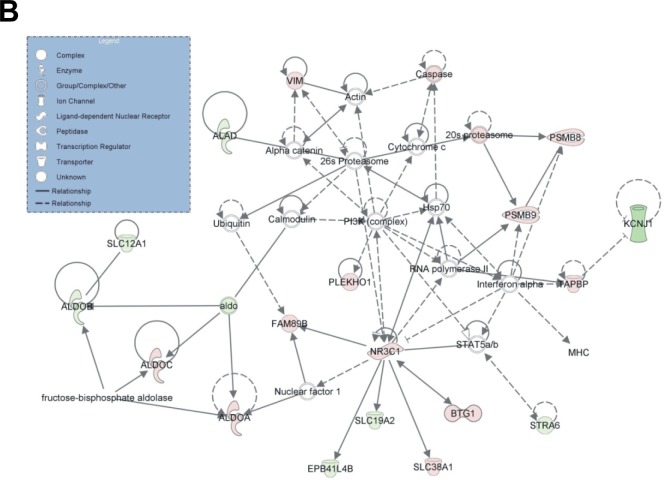
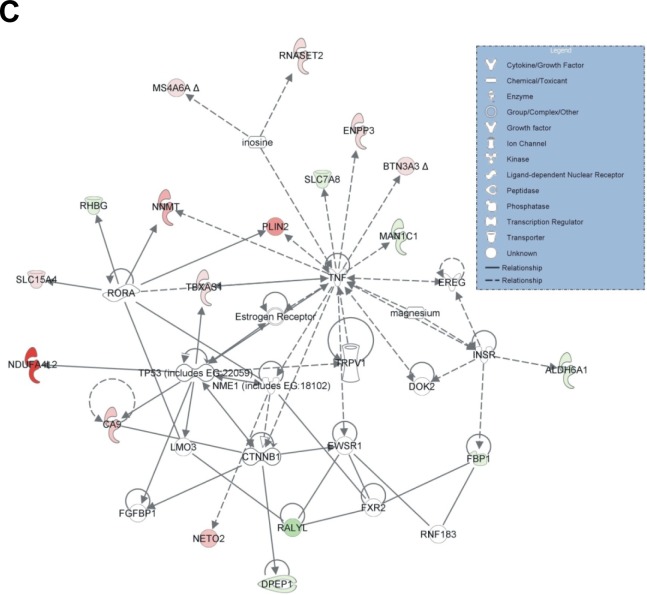
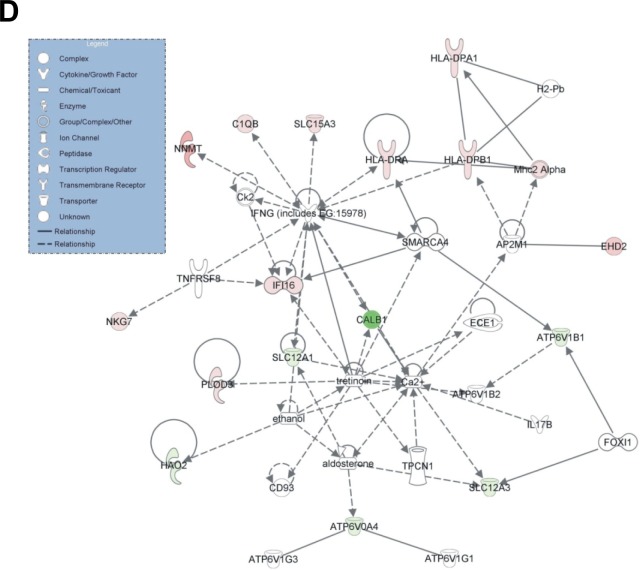
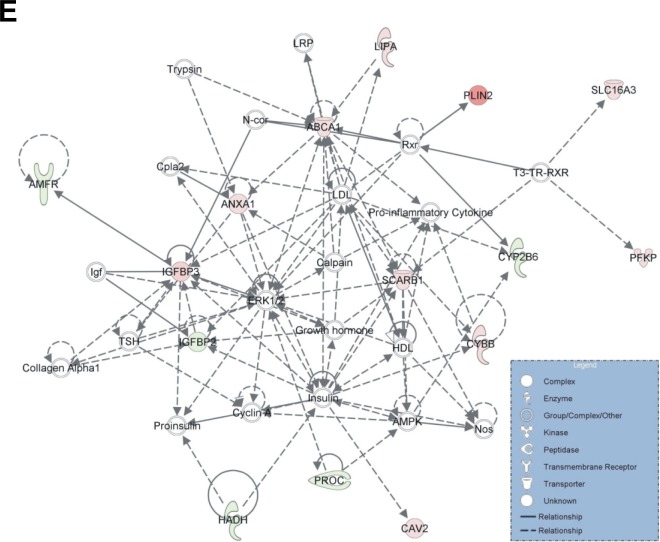
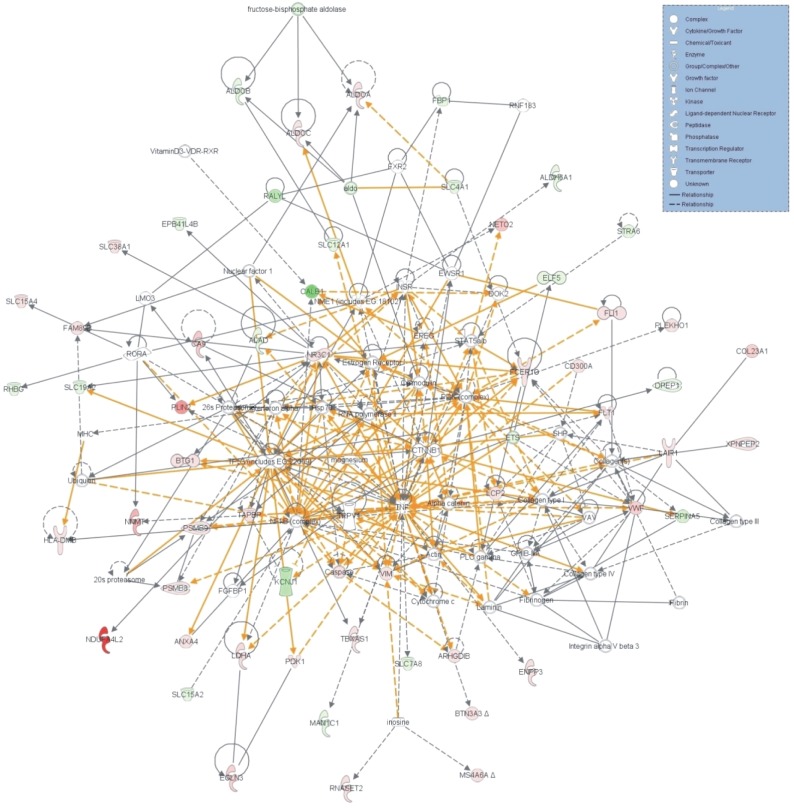
IPA identified 10 gene networks, with scores ranging from 18 to 35, of which the top 5 were associated with: 1) Hematological system development and function, cell- to-cell signaling and interaction, reproductive system development and function (score=35) (Figure 5.A); 2) Carbohydrate metabolism, cell death, endocrine system disorders (score=33) (Figure 5.B); 3) Carbohydrate metabolism, small molecule biochemistry, cellular development (score=30) (Figure 5.C); 4) Molecular transport, renal and urological disease, cellular function and maintenance (score=28) (Figure 5.D); 5) Lipid metabolism, small molecule biochemistry, molecular transport (score=26) (Figure 5.E). The merged top 3 gene networks (score≥30) are depicted in (Figure 6).
Figure 5. The genes forming the top 5 gene networks as identified by IPA (score>25), participate in: A) Hematological system development and function, cell-to-cell signaling and interaction, reproductive system development and function (score=35); B) Carbohydrate metabolism, cell death, endocrine system disorders (score=33); C) Carbohydrate metabolism, small molecule biochemistry, cellular development (score=30); D) Molecular transport, renal and urological disease, cellular function and maintenance (score=28) and E) Lipid metabolism, small molecule biochemistry, molecular transport (score=26).
Figure 6. Merge of the top 3 gene networks as revealed by IPA.
Diagnostic performance
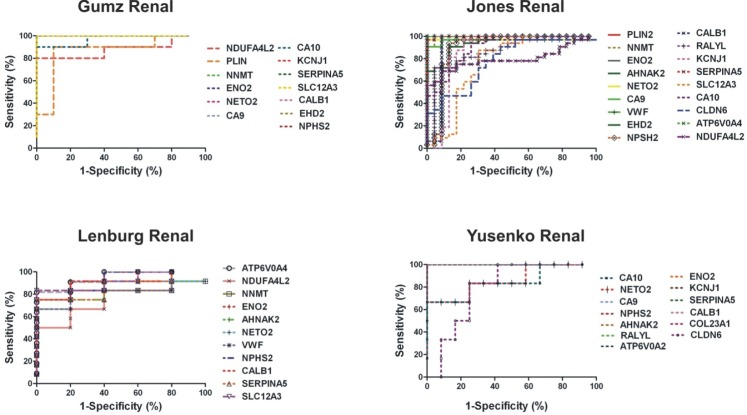
A ROC test was performed for the top 20 DEGs in ccRCC using the extracted MAS5-calculated signal intensity values of each gene from each GEO datasets (Table 2). The best discriminatory genes (AUC>0.75 and p<0.05) between ccRCC and the normal tissue in each dataset are depicted in Figure 7.
Table 2. Primer pairs used for the amplification of the top up/down-regulated and co-up/down-regulated genes, length of each PCR product and annealing temperature of each pair.
| Gene | Forward | Reverse | Amplicon size (bp) | Annealing Tm (°C) |
|---|---|---|---|---|
| Top down-regulated genes | ||||
| NDUFA4L2 | 5′-CCTGAGCCCCAATGACCAATA-3′ | 5′-TCTGGCCGGTCCTTCTTCA-3′ | 75 | 57 |
| PLIN2 | 5′-ATGGCATCCGTTGCAGTTGAT-3′ | 5′-GGACATGAGGTCATACGTGGAG-3′ | 90 | 57 |
| NNMT | 5′-ATATTCTGCCTAGACGGTGTGA-3′ | 5′-TCAGTGACGACGATCTCCTTAAA-3′ | 113 | 60 |
| ENO2 | 5′-ACAAACAGCGTTACTTAGGCAA-3′ | 5′-TTCTCAGTCCCATCCAACTCC-3′ | 148 | 60 |
| AHNAK2 | 5′-GTGCAGAAACGGAAGATGACC-3′ | 5′-GCCTCAGTCGTGTATTCGTAGA-3′ | 106 | 57 |
| NETO2 | 5′-GGACTGGGATTTCGAGCAAAA-3′ | 5′-AGAGCGCACTATTCCATCAGC-3′ | 126 | 56 |
| CA9 | 5′-TTTGCCAGAGTTGACGAGGC-3′ | 5′-GCTCATAGGCACTGTTTTCTTCC-3′ | 97 | 58 |
| VWF | 5′-CCGATGCAGCCTTTTCGGA-3′ | 5′-TCTGGAAGTCCCCAATAATCGAG-3′ | 134 | 60 |
| COL23A1 | 5′-TCCATCCGAATGTGTCTGCC-3′ | 5′-GTAGCCATCTCGTCCTGATTG-3′ | 103 | 58 |
| EHD2 | 5′-TCCGCAAACTCAACCCTTTC-3′ | 5′-TCTCCAGGACCTGATTAGGGA-3′ | 78 | 58 |
| NPHS2 | 5′-ACCAAATCCTCCGGCTTAGG-3′ | 5′-CAACCTTTACGCAGAACCAGA-3′ | 106 | 57 |
| Top up-regulated genes | ||||
| CALB1 | 5′-AACTTTTGTGGATCAGTATGGGC-3′ | 5′-GGTAATACGTGAGCCAACTCTAC-3′ | 72 | 56 |
| RALYL | 5′-GAGTGAGCGACATGCAAGAG-3′ | 5′-GTCAAAGACATAACCGCCAACA-3′ | 193 | 57 |
| KCNJ1 | 5′-CATCCTGGGCCCTGACAAA-3′ | 5′-AAGCGAGTGACGACCCATTTC-3′ | 202 | 58 |
| KNG1 | 5′-CTAAGACGGTTGGCTCTGACA-3′ | 5′-TGCCGTGCATTCTCCAGTG-3′ | 140 | 58 |
| SERPINA5 | 5′-AAAGCAAACGAAGGGCAAGATT-3′ | 5′-CTCTTGGGTGCCTTTGTGGTT-3′ | 130 | 58 |
| CLDN8 | 5′-CTTGGTGGTGTTGGAATGGTG-3′ | 5′-TCACGCAATTCATCCACAGTC-3′ | 130 | 57 |
| SLC12A3 | 5′-CTCCACCAATGGCAAGGTCAA-3′ | 5′-GGATGTCGTTAATGGGGTCCA-3′ | 206 | 56 |
| CA10 | 5′-TCATCGTCTGCATATCAGCTCA-3′ | 5′-GTTCACCAATCCCCAGAAAGAAG-3′ | 119 | 56 |
| ATP6V0A4 | 5′-CTCCCACGGGAAATGATTACC-3′ | 5′-CGTCTCAAAGAAGTCTTGGGTT-3′ | 156 | 60 |
| ACTB | 5′-CCAGCACAATGAAGATCAAGATCA-3′ | 5′-TAGTCCGCCTAGAAGCATTTGC-3′ | 172 | 60 |
| RPL13A | 5′-CCTGGAGGAGAAGAGGAAAGAGA-3′ | 5′-TTGAGGACCTCTGTGTATTTGTCAA-3′ | 101 | 60 |
| GAPDH | 5′-GGAAGGTGAAGGTCGGAGTCA-3′ | 5′-GTCATTGATGCCAACAATATCCACT-3′ | 127 | 60 |
| Co-Up-regulated among four datasets | ||||
| BTN3A3 | 5′-AACCACCATTCTTCAGTGGG-3′ | 5′-GAAGGAAAGCCAGGGAACTT-3′ | 146 | 60 |
| Co-up-regulated among three datasets | ||||
| PDIA5 | 5′-AGTGGAGAAAGGAGCCAGC-3′ | 5′-TGCAGAGGACAGCCATGA-3′ | 110 | 60 |
| BHLHE41 | 5′-GGGACATCTGGAGAAAGCTG-3′ | 5′-ATCCAAGTCGGACTGAATGG-3′ | 148 | 60 |
| SLC12A1 | 5′-TGAGATTCACGAGCAACTCGC-3′ | 5′-CCCATCACCGTTAGCAACTCT-3′ | 76 | 60 |
| VEGFA | 5′-ATGACGAGGGCCTGGAGTGTG-3′ | 5′-CCTATGTGCTGGCCTTGGTGAG-3′ | 91 | 60 |
| CYBB | 5′-TCGAAATCTGCTGTCCTTCC-3′ | 5′-AATCATCCATGCCACCATTT-3′ | 109 | 60 |
| ARHGDIB | 5′-GACTGGGGTGAAAGTGGATAAAG-3′ | 5′-TCGTCGGTGAAGAAGGACTTG-3′ | 150 | 60 |
| NKG7 | 5′-TCCAGACCTTCTTCTCCTGG-3′ | 5′-GCCTTCTGCTCACAAGGTTT-3′ | 134 | 60 |
| ATP2B4 | 5′-CTAGCTTGGTTGCCACACTG-3′ | 5′-GAGCTTCCTGGATACCGATG-3′ | 150 | 60 |
| CAV1 | 5′-CGAGAAGCAAGTGTACGACG-3′ | 5′-TCCCTTCTGGTTCTGCAATC-3′ | 122 | 60 |
| EGLN3 | 5′-AGCTTCCTCCTGTCCCTCAT-3′ | 5′-CTGTTCCATTTCCCGGATAG-3′ | 118 | 60 |
| IGFBP3 | 5′-AACGCTAGTGCCGTCAGC-3′ | 5′-GACGGGCTCTCCACACTG-3′ | 113 | 60 |
| LAIR1 | 5′-GGCCTAGTGCTCTGCCTG-3′ | 5′-ACACGAAAGTCACATGGCTC-3′ | 118 | 60 |
| NR3C1 | 5′-TTCCCTGGTCGAACAGTTTT-3′ | 5′-AGAGTTTGGGAGGTGGTCCT-3′ | 115 | 60 |
| PFKP | 5′-GTGCGCATGGGTATCTACG-3′ | 5′-ACTTGCAGGATGCTGGAGAC-3′ | 125 | 60 |
| RNASET | 5′-GTACTTTGGCAGAAGCCTGG-3′ | 5′-CCATATACTCTGGCAAGGGC-3′ | 132 | 60 |
| Co-down-regulated among four datasets | ||||
| TMPRSS2 | 5′-GGACAGTGTGCACCTCAAAGAC-3′ | 5′-TCCCACGAGGAAGGTCCC-3′ | 71 | 60 |
Figure 7. ROC analysis of the top 20 DEGs in ccRCC vs. the normal kidney using each datasets extracted MAS5- calculated signal intensity values.
Of them, the DEGs with a p<0.01 and an AUC>0.8 were selected as successful distinguishing markers between ccRCC and the normal kidney tissues.In the “Gumz Renal” dataset, NDUFA4L2, PLIN2, NNMT, ENO2, CA9, CA10, KCNJ1, SERPINA5, SLC12A3, CALB1, EHD2 and NPHS2 showed a median AUC=1.00 and p<0.01. In the “Jones Renal” dataset, PLIN2, NNMT, ENO2, AHNAK2, NETO2, CA9, VWF, EHD2, NPHS2, CALB1, RALYL, KCNJ1, SERPINA5, SLC12A3, CA10, CLDN6, ATP6V0A4 and NDUFA4L2 had median AUC=0.969 (p<0.001) and in the “Lenburg Renal” dataset, NDUFA4, NNMT, ENO2, AHNAK2, NETO2, VWF, NPHS2, CALB1, SERPINA5, SLC12A3 and ATP6V0A4 exhibited median AUC=0.90 (p<0.001). In the Yusenko dataset, CA10, NETO2, CA9, NPHS2, AHNAK2, RALYL, ATP6V0A4, ENO2, KCNJ1, SERPINA5, CALB1, COL23A1 and CLDN6 had median AUC values of 1.000 (p<0.01).
Validation of the DEGs in ccRCC cell lines and a ccRCC patient cohort
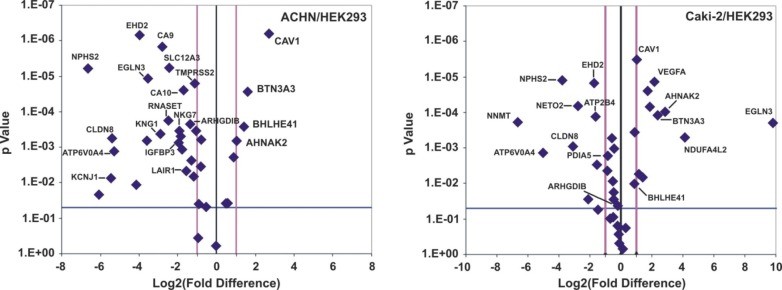
In order to validate the DEGs we used two ccRCC cell lines (ACHN and Caki-2) and the HEK-293 cells were used as a control. We also validated the DEGs in a cohort of 10 ccRCC freshly frozen patient samples. The significantly reduced expression levels of ARHGDIB, NKG7, IGFBP3, LAIR1, RNASET, TMPRSS2 and EGLN3 and the significantly high expression of AHNAK2 were validated in the ACHN vs. HEK-293 cells. Furthermore, PDIA5, ARHGDIB and ATP2B4 down-regulation EGLN3 along with NDUFA4L2 and AHNAK2 up-regulation was validated in the Caki-2 vs. HEK-293 cells (Figure 8).
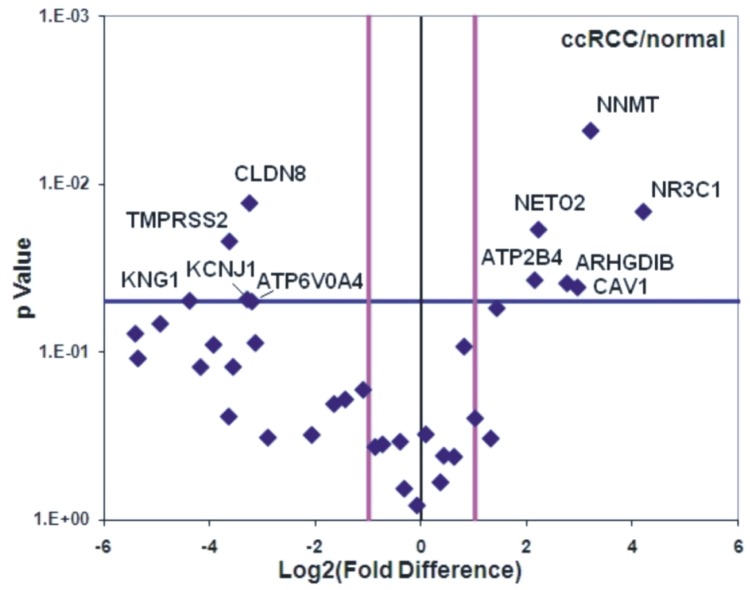
Figure 8. The Volcano-plots depict the DEGs in ACHN and Caki-2 cell lines compared to the HEK-293 cells.
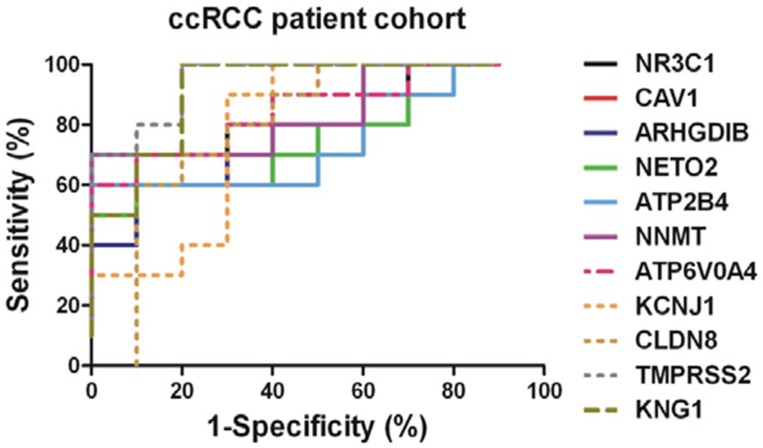
In the patient cohort, ATP6V0A4, KCNJ1, CLDN8, TMPRSS2 and KNG1 were significantly reduced, whereas NNMT, NR3C1, CAV1, ARHGDIB, NETO2 and ATP2B4 mRNA levels were significantly elevated in ccRCC (Figure 9). The normalized expression values of the latter revealed good discriminatory ability between ccRCC and normal kidney (Figure 10 and Table 3).
Figure 9. The Volcano-plot depicts the DEGs in a cohort of 10 ccRCC patient samples compared to the adjacent normal kidney samples.
Figure 10. ROC analysis of the validated DEGs in the cohort of the ccRCC patients.
Table 3. Top 10 up- and top 10 down-regulated genes in ccRCC versus the normal kidney tissue.
Fold change difference and statistical significance are depicted
| Top 10 up-regulated molecules | Fold change up-regulation | p-value |
| NDUFA4L2 | 53.935 | <0.01 |
| PLIN2 | 27.86 | <0.01 |
| NNMT | 20.86 | <0.01 |
| ENO2 | 19.973 | <0.01 |
| AHNAK2 | 16.622 | <0.01 |
| NETO2 | 15.808 | <0.01 |
| CA9 | 14.483 | <0.01 |
| VWF | 13.061 | <0.01 |
| COL23A1 | 12.752 | <0.01 |
| EHD2 | 12.696 | <0.01 |
| Top 10 down-regulated molecules | Fold change down-regulation | p-value |
| ATP6V0A4 | −19.699 | <0.01 |
| CA10 | −21.452 | <0.01 |
| SLC12A3 | −23.667 | <0.01 |
| CLDN8 | −27.113 | <0.01 |
| SERPINA5 | −35.449 | <0.01 |
| KNG1 | −38.45 | <0.01 |
| KCNJ1 | −50.79 | <0.01 |
| RALYL | −53.576 | <0.01 |
| CALB1 | −103.68 | <0.01 |
| NPHS2 | −159.107 | <0.01 |
Upregulation of NNMT and NR3C1 expression in renal biopsies
Immunohistochemical (IHC) staining of NNMT and NR3C1 proteins was examined in FFPE biopsy samples of 24 confirmed ccRCC patients. Both NNMT and NR3C1 expression was increased in the kidney sections of these patients as compared to biopsies from non-cancerous kidney tissue (Figure 11).
Figure 11. Kidney biopsies from normal kidney (control) and ccRCC patients were stained with anti-NNMT and anti-NR3C1 antibodies.
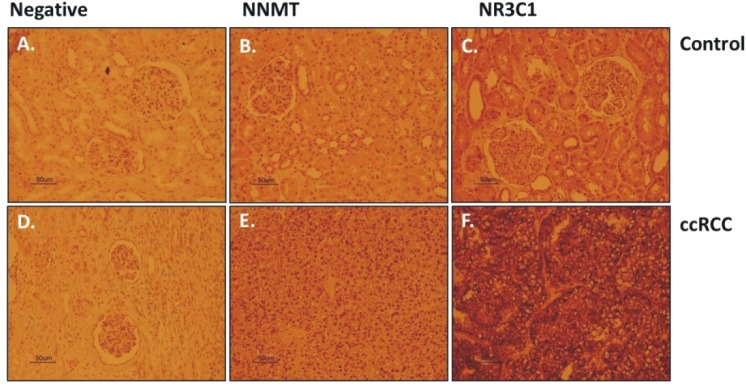
In the patients with confirmed ccRCC, serial sections showed stronger NNMT and NR3C1 immunoreactivity as compared to the controls.
Further Enrichment analyses
GO enrichment for the top DEGs revealed genes that participate in biological processes such as response to organic substance (adjP=0.0002), response to chemical stimulus (adjP=0.0055), excretion (adjP=0.0067), regulation of epithelial cell proliferation (adjP=0.0067), response to hormone stimulus (adjP=0.0067), response to steroid hormone stimulus (adjP=0.0067), response to oxygen levels (adjP=0.0081), response to endogenous stimulus (adjP=0.0081), response to hypoxia (adjP=0.0081) and epithelial cell proliferation (adjP=0.0081). GO enrichment for the co-upregulated and the co-downregulated genes was also performed (Table S2). Among the most important biological processes of the up-regulated genes, response to hypoxia/oxygen levels (EGLN3, VEGFA, CASP1, FLT1 and CA9) and positive regulation of the vascular endothelial growth factor receptor signaling pathway (VEGFA and FLT1) could be discriminated.
KEGG enrichment was also performed to identify the pathways in which the top DEGs participate (Table S3). Among the co-upregulated genes, CSF2RB, VEGFA, FLT1 and CSF1R participate in the Cytokine- cytokine receptor interaction pathway (adjP=0.0003); VWF, VEGFA and FLT1 are related to the Focal adhesion pathway (adjP=0.0018) and EGLN3 and VEGFA participate in the Renal cell carcinoma pathway (adjP=0.0020). Among the co-downregulated genes, ADH6, ALAD, ALDH6A1, FBP1, MAN1C1, CYP2B6, ABAT, HAO2, ALDOB, INPP5J, PIPOX and ATP6V1B1 participate in Metabolic pathways (adjP=1.78e-08); ADH6, ALDOB and FBP1 are related to Glycolysis/Gluconeogenesis (adjP=0.0003); ALDOB and FBP1 are related to the Fructose and mannose metabolism pathway (adjP=0.0017) and the pentose phosphate pathway (adjP=0.0017). Furthermore, ABAT and ALDH6A1 participate in the Propanoate metabolism pathway (adjP=0.0017) and the Valine, leucine and isoleucine degradation pathway (adjP=0.0023). Other metabolic pathways were also deregulated, such as the Metabolism of xenobiotics by cytochrome P450; the Retinol metabolism and the Drug metabolism - cytochrome P450 pathways (CYP2B6 and ADH6, adjP=0.0034).
Likewise, Wikipathways (Table S4) and Pathway Commons (Table S5) enrichment analysis were performed for the top deregulated genes, as well as for the co-up- and co-downregulated ones. Enrichment analysis for the targets of the co-upregulated and co-downregulated transcription factors was finally performed, using as data source the MSigDB (Table S6). The transcription factors E12 (adjP=1.78e-06), NFAT (adjP=1.50e-05), SP1 (adjP=0.0030) and FOXO4 (adjP=2.28e-05) regulated the highest number of the current 169 co-downregulated genes (12, 8, 9 and 9 genes, respectively), whereas PAX4 (adjP=0.0019) and GATA1 (adjP=0.0009) regulated the highest number of the co-upregulated genes (6 and 4, respectively).
DISCUSSION
In the present study, we performed a meta-analysis in order to identify deregulated genes in ccRCC compared to the normal kidney and to measure their discriminatory capability between the two tissues. For this purpose, we extracted data from five Oncomine datasets and analyzed them, accordingly. A list of co-deregulated genes among the five microarray datasets was identified and IPA revealed the canonical pathways in which they are implicated, as well as the networks that they form and their associated functions. The deregulated expression pattern of these genes was validated in two ccRCC cell lines and in a cohort of ccRCC patients. We also attempted to gain a better understanding of the molecular pathways/mechanisms involved in ccRCC, through comprehensive bioinformatics analyses.
Knowledge of gene regulatory networks is considered to be of crucial importance for the understanding of diseases such as cancer, as it may lead to new therapeutic approaches. Our investigation revealed that the top 1% of the co-DEGs take part in the Antigen Presentation pathway, the Inositol Metabolism pathway, the Pentose Phosphate pathway, in Glycolysis/Gluconeogenesis, as well as in the Metabolism of Fructose and Mannose. Similar observations corroborating our results were recently reported by others [15-19]. White et al. [15] used three independent algorithms and also showed that the aforementioned pathways are among the top deregulated pathways in metastatic RCC.
In the current study, we found that there was a significant overlap (77 genes) between genes deregulated in ccRCC and those reported to be deregulated in other cancers, suggesting that different cancer types share common pathways. Furthermore, 32 of them play a significant role in renal and urological diseases. The most significant molecular and cellular functions of these co-DEGs involved cell-to-cell signaling, cellular function and maintenance, molecular transport, cellular growth and proliferation.
Our analysis revealed that the antigen presentation pathway was the most altered pathway in ccRCC and BTN3A3 was the most up-regulated gene among all five ccRCC datasets. The butyrophilin (BTN) genes are a group of major histocompatibility complex (MHC)-associated genes that encode type I membrane proteins with 2 extracellular immunoglobulin (Ig) domains and an intracellular B30.2 (PRYSPRY) domain. Autoantibodies that are produced against tumor-associated antigens attract a growing interest for cancer detection, differential diagnostics and prognosis. In line with our analysis, BTN3A3 antigen and its cognate autoantibody was recently suggested as a valuable target for further analysis as potential cancer biomarker [20].
Extensive data in the literature show that cancer cells reprogram their metabolism and shift from aerobic to anaerobic respiration even in the presence of oxygen. This theory was initially proposed by Warburg over 50 years ago [21] and has been recently refreshed [9,22-25]. Reversal of the Warburg effect has also been explored as a novel treatment for cancer [26]. Now considered a hallmark of cancer, metabolic reprogramming of cells results in an unusually high rate of glycolysis and lactate production even in the presence of oxygen. Both our IPA and KEGG enrichments supported that the majority of the deregulated pathways in ccRCC are related to metabolic processes. Glycolysis was among the top deregulated pathways among the five datasets. Our observations are in line with the increasing evidence for the role of altered metabolism in the pathogenesis of renal cancer [2,15,22,27-29]. Our data are also consistent with reports from other cancers, such as metastatic cervical carcinoma and head and neck cancers [30-32]. In these works the authors reported increased glycolysis as measured by high levels of lactate in these tumours. In metastasis, it has been hypothesized that the glycolytic phenotype arises as a result of transient hypoxic episodes that occur while cells travel to distant sites through the bloodstream [33]. Ultimately, cells that are able to perform glycolysis and are resistant to hypoxia, will be selectively favored for survival and growth and result in successful metastasis [33]. Another proposed explanation for the shift to glycolysis is that cancer cells may have damage to their mitochondria through acquired mutations, or may even shut down their mitochondria being the powerhouse of the cell and helps regulate apoptosis. In our meta-analysis, the platelet isoform of phosphofructokinase (PFKP) (ATP D-fructose- 6-phosphate-1-phosphotransferase) was among the most co-upregulated genes among all ccRCC datasets. Of specific note is that our data show that PFKP participates in almost all of the major deregulated canonical pathways in the disease: the pentose phosphate pathway, glycolysis/gluconeogenesis and fructose and mannose metabolism pathway. PFK catalyzes the irreversible conversion of fructose-6-phosphate to fructose-1,6-bisphosphate and is a key regulatory enzyme in glycolysis. It has been shown to be abundantly expressed in human tumors and its expression was linked to long-standing observations concerning the apparent coupling of enhanced glycolysis and cell proliferation [34,35].
A comprehensive understanding of the deregulated metabolic pathways in cancer has much potential for the development of novel therapies. For example, the use of glufosfamide (D-19575), a cytotoxic alkylating agent in which isophosphoramide mustard, the cytotoxic metabolite of ifosfamide, is covalently linked to β-D- glucose [8,36], has been studied for its effectiveness as a treatment for cancers alone or in combination with other treatments [37-39]. In addition, the identification of novel pathways involved in tumorigenesis may allow for the discovery of new compounds that can induce synthetic lethality. After the discovery that RCC tumors, like many others, depend on glycolysis, Chan et al. [40] determined this dependence to be, in part, a result of induction of the glucose transporter 1 (GLUT1). They identified a compound that inhibited the uptake of glucose through GLUT1, which resulted in cancer cell death. Because GLUT1 dependence was observed only in cancer cells lacking the von Hippel-Lindau (VHL) gene, treatment with the GLUT1 inhibiting compound selectively killed cancer cells and had no effect on normal kidney cells. Exploitation of this dependence has also been shown to be promising for the treatment of other cancers.
The data from the present study corroborate that kidney cancer cells manipulate more than one molecular mechanisms and a number of biological pathways to achieve their aggressive phenotype. Renal carcinoma is made up of a number of cancers that occur in the kidney, each having a different histology, following a different clinical course, responding differently to therapy and caused by different genes. Here, we highlight that ccRCC is fundamentally a metabolic disorder. Understanding the mechanisms that lead to altered metabolic pathways in this disease should provide the foundation for the development of novel targeted therapies and development of novel biomarkers.
MATERIALS AND METHODS
Data mining and gene expression analysis
The data mining strategy for selecting ccRCC marker genes was based on the Oncomine v4.4.3 cancer microarray platform [14]. Oncomine incorporates more than 628 independent microarray datasets, totaling more than 62,015 microarray experiments and spanning 41 cancer types. It unifies a large compendium of other published cancer microarray data, including Gene Expression Omnibus (GEO) and Stanford Microarray Database (SMD) and uniquely provides differential expression analyses comparing most major types of cancer with their respective normal tissues.
Microarray expression datasets
Clear cell Renal Cell Carcinoma was used in the <profile search> function in the Oncomine database to find the available microarray datasets related to the specific cancer type. The analysis type <cancer vs. normal> was then applied to filter those microarray datasets exploring cancer relative to its non-tumor kidney tissue. Five publicly available datasets of gene expression profiles were chosen in this study. These were Gumz Renal [41], Higgins Renal [7], Jones Renal [8], Lenburg Renal [9] and Yusenko Renal [42]. The datasets were carefully selected with the criterion of using the same platform (Affymetrix HU133A and HU133B) (Table 4).
Table 4. ROC test for each dataset's top 20 DEGs using their extracted MAS5-calculated signal intensity values.
| NDUFA4L2 | PLIN2 | NNMT | ENO2 | AHN AK2 | NETO2 | CA9 | VWF | COL23 A1 | EHD2 | NPHS2 | CALB1 | RALYL | KCNJ1 | KNG1 | SERPINA5 | SLC12A3 | CA10 | CLDN6 | ATP6V0A4 | ||
|---|---|---|---|---|---|---|---|---|---|---|---|---|---|---|---|---|---|---|---|---|---|
| Gumz Renal | AUC | 0.88 | 0.87 | 1.00 | 1.00 | N/A | 1.00 | 1.00 | 0.56 | N/A | 1.00 | 1.00 | 1.00 | N/A | 1.00 | N/A | 1.00 | 1.00 | 0.97 | 0.57 | 0.65 |
| Std. Error | 0.09 | 0.09 | 0.00 | 0.00 | N/A | 0.00 | 0.00 | 0.14 | N/A | 0.00 | 0.00 | 0.00 | N/A | 0.00 | N/A | 0.00 | 0.00 | 0.03 | 0.14 | 0.13 | |
| 95% CI | 0.71-1.05 | 0.69-1.04 | 1.00-1.00 | 1.00-1.00 | N/A | 1.00-1.00 | 1.00-1.00 | 0.29-0.83 | N/A | 1.00-1.00 | 1.00-1.00 | 1.00-1.00 | N/A | 1.00-1.00 | N/A | 1.00-1.00 | 1.00-1.00 | 0.90-1.03 | 0.29-0.84 | 0.39-0.90 | |
| p-value | 0.00 | 0.01 | 0.00 | 0.00 | N/A | 0.00 | 0.00 | 0.65 | N/A | 0.00 | 0.00 | 0.00 | N/A | 0.00 | N/A | 0.00 | 0.00 | 0.00 | 0.60 | 0.26 | |
| Jones Renal | AUC | 0.80 | 1.00 | 1.00 | 1.00 | 1.00 | 0.97 | 0.98 | 1.00 | N/A | 0.95 | 0.90 | 0.92 | 0.86 | 0.86 | N/A | 1.00 | 0.76 | 0.89 | 0.78 | 1.00 |
| Std. Error | 0.06 | 0.00 | 0.01 | 0.00 | 0.00 | 0.03 | 0.02 | 0.00 | N/A | 0.03 | 0.06 | 0.06 | 0.05 | 0.07 | N/A | 0.00 | 0.07 | 0.04 | 0.06 | 0.00 | |
| 95% CI | 0.67-0.92 | 1.00-1.00 | 0.99-1.00 | 1.00-1.00 | 1.00-1.00 | 0.91-1.02 | 0.95-1.01 | 1.00-1.00 | N/A | 0.89-0.99 | 0.79-1.00 | 0.80-1.02 | 0.76-0.97 | 0.73-0.99 | N/A | 0.99-1.00 | 0.61-0.90 | 0.81-0.97 | 0.65-0.90 | 1.00-1.00 | |
| p-value | 0.00 | <0.0001 | <0.0001 | <0.0001 | <0.0001 | <0.0001 | <0.0001 | <0.0001 | N/A | <0.0001 | <0.0001 | <0.0001 | <0.0001 | <0.0001 | N/A | <0.0001 | 0.00 | <0.0001 | 0.00 | <0.0001 | |
| Lenburg Renal | AUC | 0.82 | 0.77 | 0.83 | 0.93 | 0.83 | 0.87 | 0.75 | 0.83 | 0.80 | 0.68 | 0.92 | 0.90 | 0.80 | 0.73 | N/A | 0.87 | 0.92 | 0.53 | 0.67 | 0.95 |
| Std. Error | 0.11 | 0.16 | 0.10 | 0.06 | 0.10 | 0.09 | 0.13 | 0.10 | 0.11 | 0.16 | 0.07 | 0.08 | 0.11 | 0.14 | N/A | 0.09 | 0.07 | 0.14 | 0.14 | 0.05 | |
| 95% CI | 0.59-1.03 | 0.44-1.08 | 0.63-1.03 | 0.81-1.05 | 0.63-1.03 | 0.68-1.05 | 0.50-0.99 | 0.63-1.03 | 0.58-1.01 | 0.36-0.99 | 0.78-1.05 | 0.74-1.05 | 0.58-1.01 | 0.45-1.00 | N/A | 0.69-1.04 | 0.78-1.05 | 0.25-0.81 | 0.39-0.93 | 0.83-1.05 | |
| p-value | 0.05 | 0.09 | 0.04 | 0.01 | 0.04 | 0.02 | 0.11 | 0.04 | 0.06 | 0.25 | 0.01 | 0.01 | 0.06 | 0.14 | N/A | 0.02 | 0.01 | 0.83 | 0.29 | 0.01 | |
| Yusenko Renal | AUC | 0.51 | 0.67 | 0.89 | 1.00 | 1.00 | 0.86 | 1.00 | 0.61 | 1.00 | 0.89 | 1.00 | 1.00 | 1.00 | 1.00 | N/A | 1.00 | 0.78 | 0.85 | 0.79 | 1.00 |
| Std. Error | 0.16 | 0.27 | 0.12 | 0.00 | 0.00 | 0.10 | 0.00 | 0.16 | 0.00 | 0.12 | 0.00 | 0.00 | 0.00 | 0.00 | N/A | 0.00 | 0.11 | 0.11 | 0.11 | 0.00 | |
| 95% CI | 0.19-0.83 | 0.13-1.20 | 0.64-1.13 | 1.00-1.00 | 1.00-1.00 | 0.66-1.05 | 1.00-1.00 | 0.29-0.93 | 1.00-1.00 | 0.64-1.13 | 1.00-1.00 | 1.00-1.00 | 1.00-1.00 | 1.00-1.00 | N/A | 1.00-1.00 | 0.55-0.99 | 0.63-1.06 | 0.58-1.00 | 1.00-1.00 | |
| p-value | 0.93 | 0.44 | 0.07 | 0.02 | 0.02 | 0.01 | 0.02 | 0.45 | 0.02 | 0.07 | 0.02 | 0.02 | 0.02 | 0.02 | N/A | 0.02 | 0.06 | 0.02 | 0.05 | 0.02 |
Gene selection procedure
Concept filters in the Oncomine database were used to identify the differentially expressed genes in ccRCC vs. the normal kidney tissue, using the following parameters: p-value=1E-4; Odds Ratio=2.0 and gene rank=top 1%. Next, a corrected Q value threshold (Q≤0.05) was used to filter and retrieve those DEGs with a high confidence. This filtering approach yielded 53 up- and 53 down-regulated genes from the “Higgins Renal”, 126 up- and 126 down- regulated genes from the “Gumz Renal”, 126 up- and 126 down-regulated genes from the “Jones Renal”, 177 up- and 177 down-regulated genes from the “Lenburg Renal” and 195 up- and 195 down-regulated genes from the “Yusenko Renal” datasets, respectively. Then, the co-DEGs among the five microarray datasets were selected as candidate genes for downstream network analysis and their expression levels was further validated in ccRCC cell lines as well as in a cohort of 10 ccRCC patient samples. The median fold change (±SD) value among the datasets was calculated and scored (Table S1).
Pathway analysis of the co-deregulated genes
DEGs were investigated for network interrelation by Ingenuity Pathway Analysis, version 7 (IPA; Ingenuity Systems, USA). IPA scans the set of input genes to identify networks by using Ingenuity Pathways Knowledge Base for interactions between identified “Focus Genes.” In this study, the DEGs between ccRCC and normal tissue samples and hypothetical interacting genes stored in the knowledge base in IPA software, were used to generate a set of networks with a maximum network size of 35 genes/proteins. Networks were displayed graphically as genes/gene products (“nodes”) and the biological relationships between the nodes (“edges”). All edges are from canonical information stored in the Ingenuity Pathways Knowledge Base. Networks of these genes were generated by IPA based on their connectivity, each ranked by a score. This score indicates the likelihood of the Focus Genes in a network from Ingenuity's knowledge base being found together due to random chance. It is based on the hypergeometric distribution, calculated with the right- tailed Fisher's Exact Test, and corresponds to the negative log of this p-value. A score of 1.5 was set as the cutoff for identifying gene networks. Furthermore, we used IPA in order to identify the top 1% of the deregulated genes and the top canonical pathways in which they participate. Also, IPA was used to reveal the top molecular and cellular functions, as well as the top biological functions of the co-DEGs. Of these genes, the top 10 deregulated molecules were scored.
Gene expression validation in ccRCC cell lines
The human ccRCC cell lines Caki-2 and ACHN (kindly provided by Dr Nicoletta Gagliano [43]) were used. Cells were cultured in RPMI-1640 medium supplemented with 10% fetal bovine serum (FBS), 2 mmol/l glutamine, antibiotics (100 U/ml penicillin, 0.1 mg/ml streptomycin) and amphotericin B (2.5 μg/ml). Cells were incubated at 37°C at 5% CO2 in 75 cm2 flasks. The non-cancerous Human Embryonic Kidney cell line (HEK-293) was used as control. Total RNA was isolated from cells at 80% confluency using the Total RNA isolation NucleoSpin RNA II kit (Macherey-Nagel, Duren) and 400 ng were reverse transcribed to cDNA using the ProtoScript M-MuLV first-strand cDNA synthesis kit (New England Biolabs, Ipswich, MA). Real-time PCRs for the validation of the expression profile of the top or co-DEGs were performed in triplicate 20μl reactions on a ViiA™; 7 Real-Time PCR System using SYBR®; Green Fast Master Mix (Applied Biosystems). The primer pairs were designed to span at least one intron in order to avoid amplification of the contaminating genomic DNA along with cDNA. Their sequence and the corresponding PCR product sizes are listed in Table 5. Relative mRNA levels were calculated by the ΔCt method [44,45] using ACTB, GAPDH and RPL13A as reference genes. The expression levels of the most deregulated genes were measured in the Caki-2 and ACHN cell lines and compared to the corresponding levels in the HEK-293 cells. The correct size of the PCR products was confirmed by electrophoresis on a 2% agarose gel stained with ethidium bromide. Purity of the amplified products was assessed by melting curve analysis.
Table 5. ROC test for the ccRCC patient cohort using the normalized expression (2^-ΔCt) values.
| NR3C1 | CAV1 | ARHGDIB | NETO2 | ATP2B4 | NNMT | ATP6V0A4 | KCNJ1 | CLDN8 | TMPRSS2 | KNG1 | |
|---|---|---|---|---|---|---|---|---|---|---|---|
| AUC | 0.79 | 0.84 | 0.77 | 0.75 | 0.75 | 0.84 | 0.85 | 0.79 | 0.80 | 0.95 | 0.92 |
| Std. Error | 0.10 | 0.09 | 0.10 | 0.11 | 0.11 | 0.09 | 0.09 | 0.11 | 0.10 | 0.04 | 0.06 |
| 95% CI | 0.58-0.99 | 0.65-1.02 | 0.55-0.98 | 0.52-0.97 | 0.52-0.97 | 0.65-1.02 | 0.67-1.02 | 0.57-1.00 | 0.58-1.01 | 0.86-1.03 | 0.79-1.04 |
| p-value | 0.03 | 0.01 | 0.04 | 0.06 | 0.06 | 0.01 | 0.01 | 0.02 | 0.02 | <0.0001 | 0.00 |
Gene expression validation in a cohort of ccRCC patient samples
Tissue samples were obtained from kidney specimens from 10 patients with sporadic ccRCC who underwent a radical tumour nephrectomy. Immediately after resection, the samples were stored at −80°C. Histological classification was performed according to the WHO and staging according to the UICC-TNM classification (2002). Nuclear grade was scored according to the Fuhrman classification system [46]. Informed consent was obtained from all patients and the study protocol was approved by the Ethics Committee of the Asklipieio General Hospital, Athens. A matched normal kidney biopsy was also collected from each patient. Total RNA was isolated from ccRCC and normal kidney samples using the TRIzol®; Reagent and further purified using the RNeasy minikit (Qiagen, Hilden, Germany). RNA yield and quality were determined with a NanoDrop 1000 Spectrophotometer. cDNA synthesis and qRT-PCR was performed in triplicate 10 μL reaction volumes on a 384-plate format of a ViiA™ 7 Real-Time PCR System using the Fast SYBR Green Master Mix (Applied Biosystems, Foster City, CA), as previously described [47-49].
Immunohistochemistry (IHC)
Formalin-fixed and paraffin embedded (FFPE) kidney tissue samples from patients with ccRCC were retrieved from the archives of the Asklipieio General Hospital, Athens. All patients in this study underwent a radical tumour nephrectomy. Paraffin sections from each specimen were reviewed by a pathologist, were histologically classified according to the WHO classification and staged according to the UICC-TNM classification (2009). Nuclear grade was scored according to the Fuhrman classification system [46]. Informed consent was obtained from all patients. Kidney specimens were collected between 2007 and 2011. Twenty-two ccRCC and 22 normal kidney tissue (parenchyma) samples were enrolled for IHC. For ccRCC and normal kidney staining experiments, 10μm sections were cut and mount on slides coated with suitable tissue adhesive. Then sections were de-paraffinized using xylene and re- hydrated through washes in graded alcohols. Endogenous peroxidase was neutralized using 0.5% v/v hydrogen peroxide/methanol for 10 minutes. Slides were washed with water. Retrieval was carried out using 0.01M citrate retrieval solution (pH 6.0). Sections were subsequently washed with TBS and blocked for 10 minutes using 3% BSA in PBS. Sections were incubated with primary polyclonal antibodies anti-NNMT (PA5-11143) and anti- NR3C1 (PA1-511A) (NNMT, 1:50 dilution; NR3C1, 1:200 dilution) overnight at 4°C. Slides were then washed and incubated with DAKO REAL EnVision, HRP Rabbit/Mouse (ENV). Subsequently, slides were incubated with 3, 3′-diaminobenzidine (DAB) washed thoroughly in running tap water and counterstained with hematoxylin before being dehydrated and mounted. Haematoxylin and eosin (H&E) staining and IHC for several routinely used ccRCC-specific markers such as AE1/AE3 keratins, Vimentin, Ki67, p53 and S-100 was also performed for all sections.
Diagnostic performance of the top 20 deregulated genes
We performed a Receiver Operating Characteristic (ROC) curves analysis to evaluate the diagnostic performance of the top 20 deregulated genes in each microarray dataset. The MAS5-calculated Signal intensity values extracted from each dataset were used for the analysis. Sensitivity and specificity scores defining the area under the curve (AUC) were used for each candidate gene in order to discriminate between those individuals with ccRCC and those without the disease [50]. ROC curves were constructed using GraphPad Prism v.5 software (San Diego, CA).
Further Enrichment Analysis
The DEGs were further explored for the pathways in which they participate, using the WebGestalt web-tool (http://bioinfo.vanderbilt.edu/webgestalt), as previously reported [44,51]. Specifically, we applied Gene Ontology (GO), KEGG pathways, Wikipathways and Pathway Commons Analysis. Since the knowledge of common transcriptional regulatory networks could potentially lead to the key treatment for ccRCC, our attention was also focused on the transcription factors (TFs) that regulate the co-DEGs in ccRCC. We performed Transcription Factor Target Analysis. The hypergeometric test, with Bonferroni correction was used for enrichment evaluation analysis. The R function adjP was used in order to adjust the nominal p values of the large number of categories at the same time. The significance level for the adjusted p-value was set at 0.01 and the number of minimum genes for a category was set at 2.
Statistical Analysis
Differences in gene expression levels between ccRCC and normal kidney tissues were explored using the paired t-test. Numerical values were expressed as the mean±standard deviation (SD). Statistical significance was set at the 95% confidence level (p<0.05). The statistical package GraphPad Prism v.5 (La Jolla, CA) was used for calculations.
SUPPLEMENTARY TABLES
Acknowledgments
The authors would like to thank Dr Nicoletta Gagliano for providing the cell lines. Part of this work was presented orally during the 50th ERA EDTA Congress. May 18-21, 2013, Istanbul, Turkey and as a poster during the 22nd IUBMB & 37th FEBS Congress. From Single Molecules to Systems Biology. September 4-9, 2012, Sevilla, Spain.
Footnotes
Funding:
This project was funded by the Cyprus Research Promotion Foundation, New Infrastructure/∑TPATH;/0308/24 (co-funding by the EU Structural Funds) to CD.
REFERENCES
- 1.Jemal A, Siegel R, Ward E, Hao Y, Xu J, Thun MJ. Cancer statistics, 2009. CA: a cancer journal for clinicians. 2009;59:225–249. doi: 10.3322/caac.20006. [DOI] [PubMed] [Google Scholar]
- 2.Cheville JC, Lohse CM, Zincke H, Weaver AL, Blute ML. Comparisons of outcome and prognostic features among histologic subtypes of renal cell carcinoma. The American journal of surgical pathology. 2003;27:612–624. doi: 10.1097/00000478-200305000-00005. [DOI] [PubMed] [Google Scholar]
- 3.Rezende RB, Drachenberg CB, Kumar D, Blanchaert R, Ord RA, Ioffe OB, Papadimitriou JC. Differential diagnosis between monomorphic clear cell adenocarcinoma of salivary glands and renal (clear) cell carcinoma. The American journal of surgical pathology. 1999;23:1532–1538. doi: 10.1097/00000478-199912000-00011. [DOI] [PubMed] [Google Scholar]
- 4.Hong F, Breitling R. A comparison of meta-analysis methods for detecting differentially expressed genes in microarray experiments. Bioinformatics (Oxford, England) 2008;24:374–382. doi: 10.1093/bioinformatics/btm620. [DOI] [PubMed] [Google Scholar]
- 5.Boer JM, Huber WK, Sultmann H, Wilmer F, von Heydebreck A, Haas S, Korn B, Gunawan B, Vente A, Fuzesi L, Vingron M, Poustka A. Identification and classification of differentially expressed genes in renal cell carcinoma by expression profiling on a global human 31,500-element cdna array. Genome research. 2001;11:1861–1870. doi: 10.1101/gr.184501. [DOI] [PMC free article] [PubMed] [Google Scholar]
- 6.Gieseg MA, Cody T, Man MZ, Madore SJ, Rubin MA, Kaldjian EP. Expression profiling of human renal carcinomas with functional taxonomic analysis. BMC bioinformatics. 2002;3:26. doi: 10.1186/1471-2105-3-26. [DOI] [PMC free article] [PubMed] [Google Scholar]
- 7.Higgins JP, Shinghal R, Gill H, Reese JH, Terris M, Cohen RJ, Fero M, Pollack JR, van de Rijn M, Brooks JD. Gene expression patterns in renal cell carcinoma assessed by complementary DNA microarray. The American journal of pathology. 2003;162:925–932. doi: 10.1016/S0002-9440(10)63887-4. [DOI] [PMC free article] [PubMed] [Google Scholar]
- 8.Jones J, Otu H, Spentzos D, Kolia S, Inan M, Beecken WD, Fellbaum C, Gu X, Joseph M, Pantuck AJ, Jonas D, Libermann TA. Gene signatures of progression and metastasis in renal cell cancer. Clin Cancer Res. 2005;11:5730–5739. doi: 10.1158/1078-0432.CCR-04-2225. [DOI] [PubMed] [Google Scholar]
- 9.Lenburg ME, Liou LS, Gerry NP, Frampton GM, Cohen HT, Christman MF. Previously unidentified changes in renal cell carcinoma gene expression identified by parametric analysis of microarray data. BMC cancer. 2003;3:31. doi: 10.1186/1471-2407-3-31. [DOI] [PMC free article] [PubMed] [Google Scholar]
- 10.Sultmann H, von Heydebreck A, Huber W, Kuner R, Buness A, Vogt M, Gunawan B, Vingron M, Fuzesi L, Poustka A. Gene expression in kidney cancer is associated with cytogenetic abnormalities, metastasis formation, and patient survival. Clin Cancer Res. 2005;11:646–655. [PubMed] [Google Scholar]
- 11.Takahashi M, Sugimura J, Yang X, Vogelzang N, Teh BS, Furge K, Teh BT. Gene expression profiling of renal cell carcinoma and its implications in diagnosis, prognosis, and therapeutics. Advances in cancer research. 2003;89:157–181. doi: 10.1016/s0065-230x(03)01005-4. [DOI] [PubMed] [Google Scholar]
- 12.Yamazaki K, Sakamoto M, Ohta T, Kanai Y, Ohki M, Hirohashi S. Overexpression of kit in chromophobe renal cell carcinoma. Oncogene. 2003;22:847–852. doi: 10.1038/sj.onc.1206153. [DOI] [PubMed] [Google Scholar]
- 13.Young AN, Amin MB, Moreno CS, Lim SD, Cohen C, Petros JA, Marshall FF, Neish AS. Expression profiling of renal epithelial neoplasms: A method for tumor classification and discovery of diagnostic molecular markers. The American journal of pathology. 2001;158:1639–1651. doi: 10.1016/S0002-9440(10)64120-X. [DOI] [PMC free article] [PubMed] [Google Scholar]
- 14.Rhodes DR, Kalyana-Sundaram S, Mahavisno V, Varambally R, Yu J, Briggs BB, Barrette TR, Anstet MJ, Kincead-Beal C, Kulkarni P, Varambally S, Ghosh D, Chinnaiyan AM. Oncomine 3.0: Genes, pathways, and networks in a collection of 18,000 cancer gene expression profiles. Neoplasia. 2007;9:166–180. doi: 10.1593/neo.07112. [DOI] [PMC free article] [PubMed] [Google Scholar]
- 15.White NM, Newsted DW, Masui O, Romaschin AD, Siu KW, Yousef GM. Identification and validation of dysregulated metabolic pathways in metastatic renal cell carcinoma. Tumour Biol. 2013 doi: 10.1007/s13277-013-1245-6. [DOI] [PubMed] [Google Scholar]
- 16.Langbein S, Frederiks WM, zur Hausen A, Popa J, Lehmann J, Weiss C, Alken P, Coy JF. Metastasis is promoted by a bioenergetic switch: New targets for progressive renal cell cancer. International journal of cancer. 2008;122:2422–2428. doi: 10.1002/ijc.23403. [DOI] [PubMed] [Google Scholar]
- 17.Unwin RD, Craven RA, Harnden P, Hanrahan S, Totty N, Knowles M, Eardley I, Selby PJ, Banks RE. Proteomic changes in renal cancer and co-ordinate demonstration of both the glycolytic and mitochondrial aspects of the warburg effect. Proteomics. 2003;3:1620–1632. doi: 10.1002/pmic.200300464. [DOI] [PubMed] [Google Scholar]
- 18.Nagaprashantha LD, Talamantes T, Singhal J, Guo J, Vatsyayan R, Rauniyar N, Awasthi S, Singhal SS, Prokai L. Proteomic analysis of signaling network regulation in renal cell carcinomas with differential hypoxia-inducible factor-2alpha expression. PloS one. 2013;8:e71654. doi: 10.1371/journal.pone.0071654. [DOI] [PMC free article] [PubMed] [Google Scholar]
- 19.Maruschke M, Reuter D, Koczan D, Hakenberg OW, Thiesen HJ. Gene expression analysis in clear cell renal cell carcinoma using gene set enrichment analysis for biostatistical management. BJU international. 2011;108:E29–35. doi: 10.1111/j.1464-410X.2010.09794.x. [DOI] [PubMed] [Google Scholar]
- 20.Kiyamova R, Garifulin O, Gryshkova V, Kostianets O, Shyian M, Gout I, Filonenko V. Preliminary study of thyroid and colon cancers-associated antigens and their cognate autoantibodies as potential cancer biomarkers. Biomarkers. 2012;17:362–371. doi: 10.3109/1354750X.2012.677476. [DOI] [PubMed] [Google Scholar]
- 21.Warburg O, Wind F, Negelein E. The metabolism of tumors in the body. The Journal of general physiology. 1927;8:519–530. doi: 10.1085/jgp.8.6.519. [DOI] [PMC free article] [PubMed] [Google Scholar]
- 22.Linehan WM, Srinivasan R, Schmidt LS. The genetic basis of kidney cancer: A metabolic disease. Nature reviews. 2010;7:277–285. doi: 10.1038/nrurol.2010.47. [DOI] [PMC free article] [PubMed] [Google Scholar]
- 23.Wu CA, Chao Y, Shiah SG, Lin WW. Nutrient deprivation induces the warburg effect through ros/ampk-dependent activation of pyruvate dehydrogenase kinase. Biochimica et biophysica acta. 1833:1147–1156. doi: 10.1016/j.bbamcr.2013.01.025. [DOI] [PubMed] [Google Scholar]
- 24.San Martin A, Ceballo S, Ruminot I, Lerchundi R, Frommer WB, Barros LF. A genetically encoded fret lactate sensor and its use to detect the warburg effect in single cancer cells. PloS one. 2013;8:e57712. doi: 10.1371/journal.pone.0057712. [DOI] [PMC free article] [PubMed] [Google Scholar]
- 25.Buppajarntham S, Junpaparp P, Kue APP. Warburg effect associated with transformed lymphoplasmacytic lymphoma to diffuse large b-cell lymphoma. The American journal of emergency medicine. 2013;31(999):e995–996. doi: 10.1016/j.ajem.2013.01.038. [DOI] [PubMed] [Google Scholar]
- 26.Poteet E, Choudhury GR, Winters A, Li W, Ryou MG, Liu R, Tang L, Ghorpade A, Wen Y, Yuan F, Keir ST, Yan H, Bigner DD, Simpkins JW, Yang SH. Reversing the warburg effect as a treatment for glioblastoma. The Journal of biological chemistry. 2013;288:9153–9164. doi: 10.1074/jbc.M112.440354. [DOI] [PMC free article] [PubMed] [Google Scholar]
- 27.Hakimi AA, Pham CG, Hsieh JJ. A clear picture of renal cell carcinoma. Nature genetics. 2013;45:849–850. doi: 10.1038/ng.2708. [DOI] [PubMed] [Google Scholar]
- 28.Sudarshan S, Karam JA, Brugarolas J, Thompson RH, Uzzo R, Rini B, Margulis V, Patard JJ, Escudier B, Linehan WM. Metabolism of kidney cancer: From the lab to clinical practice. European urology. 2013;63:244–251. doi: 10.1016/j.eururo.2012.09.054. [DOI] [PMC free article] [PubMed] [Google Scholar]
- 29.Linehan WM, Bratslavsky G, Pinto PA, Schmidt LS, Neckers L, Bottaro DP, Srinivasan R. Molecular diagnosis and therapy of kidney cancer. Annual review of medicine. 2010;61:329–343. doi: 10.1146/annurev.med.042808.171650. [DOI] [PMC free article] [PubMed] [Google Scholar]
- 30.Brizel DM, Schroeder T, Scher RL, Walenta S, Clough RW, Dewhirst MW, Mueller-Klieser W. Elevated tumor lactate concentrations predict for an increased risk of metastases in head-and-neck cancer. International journal of radiation oncology, biology, physics. 2001;51:349–353. doi: 10.1016/s0360-3016(01)01630-3. [DOI] [PubMed] [Google Scholar]
- 31.Walenta S, Wetterling M, Lehrke M, Schwickert G, Sundfor K, Rofstad EK, Mueller-Klieser W. High lactate levels predict likelihood of metastases, tumor recurrence, and restricted patient survival in human cervical cancers. Cancer research. 2000;60:916–921. [PubMed] [Google Scholar]
- 32.Sandulache VC, Myers JN. Altered metabolism in head and neck squamous cell carcinoma: An opportunity for identification of novel biomarkers and drug targets. Head & neck. 2012;34:282–290. doi: 10.1002/hed.21664. [DOI] [PMC free article] [PubMed] [Google Scholar]
- 33.Gatenby RA, Gillies RJ. Why do cancers have high aerobic glycolysis? Nat Rev Cancer. 2004;4:891–899. doi: 10.1038/nrc1478. [DOI] [PubMed] [Google Scholar]
- 34.Mahlknecht U, Chesney J, Hoelzer D, Bucala R. Cloning and chromosomal characterization of the 6-phosphofructo- 2-kinase/fructose-2,6-bisphosphatase-3 gene (pfkfb3, ipfk2) International journal of oncology. 2003;23:883–891. [PubMed] [Google Scholar]
- 35.Moon JS, Kim HE, Koh E, Park SH, Jin WJ, Park BW, Park SW, Kim KS. Kruppel-like factor 4 (klf4) activates the transcription of the gene for the platelet isoform of phosphofructokinase (pfkp) in breast cancer. The Journal of biological chemistry. 2011;286:23808–23816. doi: 10.1074/jbc.M111.236737. [DOI] [PMC free article] [PubMed] [Google Scholar]
- 36.Mazur L, Opydo-Chanek M, Stojak M. Glufosfamide as a new oxazaphosphorine anticancer agent. Anti-cancer drugs. 2011;22:488–493. doi: 10.1097/CAD.0b013e328345e1e0. [DOI] [PubMed] [Google Scholar]
- 37.Chiorean EG, Dragovich T, Hamm J, Langmuir VK, Kroll S, Jung DT, Colowick AB, Tidmarsh GF, Loehrer PJ. A phase 1 dose-escalation trial of glufosfamide in combination with gemcitabine in solid tumors including pancreatic adenocarcinoma. Cancer chemotherapy and pharmacology. 2008;61:1019–1026. doi: 10.1007/s00280-007-0559-8. [DOI] [PubMed] [Google Scholar]
- 38.Ciuleanu TE, Pavlovsky AV, Bodoky G, Garin AM, Langmuir VK, Kroll S, Tidmarsh GT. A randomised phase iii trial of glufosfamide compared with best supportive care in metastatic pancreatic adenocarcinoma previously treated with gemcitabine. Eur J Cancer. 2009;45:1589–1596. doi: 10.1016/j.ejca.2008.12.022. [DOI] [PubMed] [Google Scholar]
- 39.Shimizu T, Okamoto I, Tamura K, Satoh T, Miyazaki M, Akashi Y, Ozaki T, Fukuoka M, Nakagawa K. Phase i clinical and pharmacokinetic study of the glucose- conjugated cytotoxic agent d-19575 (glufosfamide) in patients with solid tumors. Cancer chemotherapy and pharmacology. 2010;65:243–250. doi: 10.1007/s00280-009-1028-3. [DOI] [PubMed] [Google Scholar]
- 40.Chan DA, Sutphin PD, Nguyen P, Turcotte S, Lai EW, Banh A, Reynolds GE, Chi JT, Wu J, Solow-Cordero DE, Bonnet M, Flanagan JU, Bouley DM, Graves EE, Denny WA, Hay MP, Giaccia AJ. Targeting glut1 and the warburg effect in renal cell carcinoma by chemical synthetic lethality. Science translational medicine. 2011;3:94ra70. doi: 10.1126/scitranslmed.3002394. [DOI] [PMC free article] [PubMed] [Google Scholar]
- 41.Gumz ML, Zou H, Kreinest PA, Childs AC, Belmonte LS, LeGrand SN, Wu KJ, Luxon BA, Sinha M, Parker AS, Sun LZ, Ahlquist DA, Wood CG, Copland JA. Secreted frizzled-related protein 1 loss contributes to tumor phenotype of clear cell renal cell carcinoma. Clin Cancer Res. 2007;13:4740–4749. doi: 10.1158/1078-0432.CCR-07-0143. [DOI] [PubMed] [Google Scholar]
- 42.Yusenko MV, Zubakov D, Kovacs G. Gene expression profiling of chromophobe renal cell carcinomas and renal oncocytomas by affymetrix genechip using pooled and individual tumours. International journal of biological sciences. 2009;5:517–527. doi: 10.7150/ijbs.5.517. [DOI] [PMC free article] [PubMed] [Google Scholar]
- 43.Gagliano N, Pettinari L, Aureli M, Martinelli C, Colombo E, Costa F, Carminati R, Volpari T, Colombo G, Milzani A, Dalle-Donne I, Gioia M. Malignant phenotype of renal cell carcinoma cells is switched by ukrain administration in vitro. Anti-cancer drugs. 2011;22:749–762. doi: 10.1097/CAD.0b013e328346c7f7. [DOI] [PubMed] [Google Scholar]
- 44.Zaravinos A, Lambrou GI, Boulalas I, Delakas D, Spandidos DA. Identification of common differentially expressed genes in urinary bladder cancer. PloS one. 2011;6:e18135. doi: 10.1371/journal.pone.0018135. [DOI] [PMC free article] [PubMed] [Google Scholar]
- 45.Zaravinos A, Kanellou P, Baritaki S, Bonavida B, Spandidos DA. Braf and rkip are significantly decreased in cutaneous squamous cell carcinoma. Cell cycle (Georgetown, Tex) 2009;8:1402–1408. doi: 10.4161/cc.8.9.8308. [DOI] [PubMed] [Google Scholar]
- 46.Fuhrman SA, Lasky LC, Limas C. Prognostic significance of morphologic parameters in renal cell carcinoma. The American journal of surgical pathology. 1982;6:655–663. doi: 10.1097/00000478-198210000-00007. [DOI] [PubMed] [Google Scholar]
- 47.Kanellou P, Zaravinos A, Zioga M, Spandidos DA. Deregulation of the tumour suppressor genes p14(arf), p15(ink4b), p16(ink4a) and p53 in basal cell carcinoma. The British journal of dermatology. 2009;160:1215–1221. doi: 10.1111/j.1365-2133.2009.09079.x. [DOI] [PubMed] [Google Scholar]
- 48.Zaravinos A, Soufla G, Bizakis J, Spandidos DA. Expression analysis of vegfa, fgf2, tgfbeta1, egf and igf1 in human nasal polyposis. Oncology reports. 2008;19:385–391. [PubMed] [Google Scholar]
- 49.Zaravinos A, Chatziioannou M, Lambrou GI, Boulalas I, Delakas D, Spandidos DA. Implication of raf and rkip genes in urinary bladder cancer. Pathol Oncol Res. 2011;17:181–190. doi: 10.1007/s12253-010-9295-1. [DOI] [PubMed] [Google Scholar]
- 50.Pepe MS, Thompson ML. Combining diagnostic test results to increase accuracy. Biostatistics (Oxford, England) 2000;1:123–140. doi: 10.1093/biostatistics/1.2.123. [DOI] [PubMed] [Google Scholar]
- 51.Zhang B, Kirov S, Snoddy J. Webgestalt: An integrated system for exploring gene sets in various biological contexts. Nucleic acids research. 2005;33:W741–748. doi: 10.1093/nar/gki475. [DOI] [PMC free article] [PubMed] [Google Scholar]
Associated Data
This section collects any data citations, data availability statements, or supplementary materials included in this article.


