Abstract
Polyketide natural products constitute a broad class of compounds with diverse structural features and biological activities. Their biosynthetic machinery, represented by type I polyketide synthases, has an architecture in which successive modules catalyze two-carbon linear extensions and keto group processing reactions on intermediates covalently tethered to carrier domains. We employed electron cryo-microscopy to visualize a full-length module and determine sub-nanometer resolution 3D reconstructions that revealed an unexpectedly different architecture compared to the homologous dimeric mammalian fatty acid synthase. A single reaction chamber provides access to all catalytic sites for the intra-module carrier domain. In contrast, the carrier from the preceding module uses a separate entrance outside the reaction chamber to deliver the upstream polyketide intermediate for subsequent extension and modification. This study reveals for the first time the structural basis for both intra-module and inter-module substrate transfer in polyketide synthases, and establishes a new model for molecular dissection of these multifunctional enzyme systems.
Type I modular polyketide synthases (PKSs) are enzyme assembly lines for the synthesis of chemically diverse polyketide natural products that form the basis for nearly one-third of pharmaceuticals1. Accordingly, it is essential to dissect the architecture of the PKS module and to elucidate the molecular basis for selectivity and catalysis in order to enable rational bioengineering efforts for the creation of high-value chemicals and novel drugs.
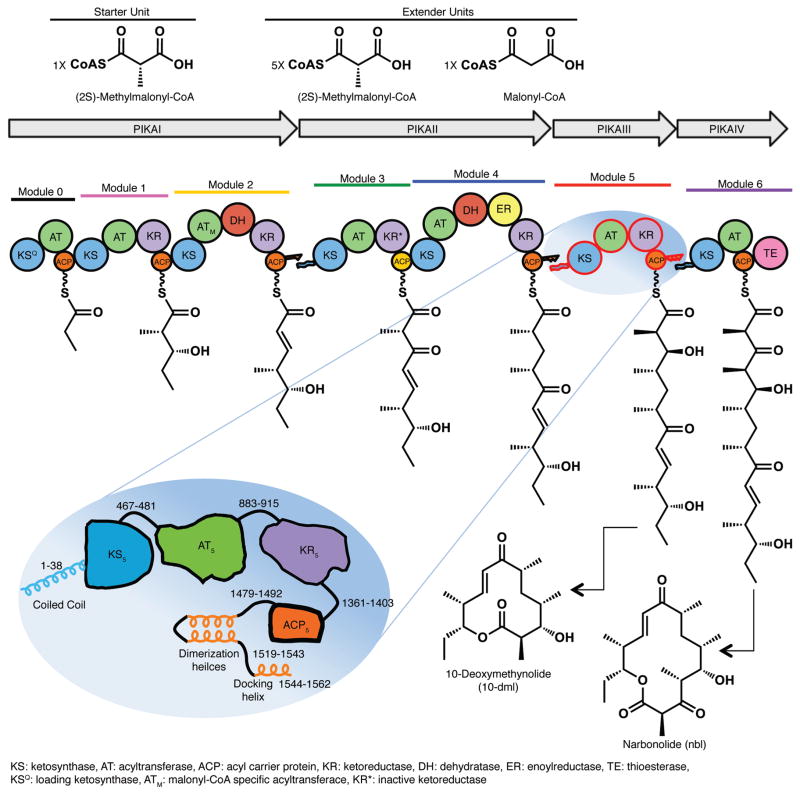
Type I PKS modules act successively in polyketide chain elongation, processing and termination (Fig. 1)2. Each module contains acyl carrier protein (ACP), ketosynthase (KS), and acyltransferase (AT) domains that extend the linear sequence of an intermediate by two carbon atoms. The AT loads the ACP with a building block from a specific acyl-CoA, and the KS catalyzes carbon-carbon bond formation between the intermediate from the upstream module and the acyl-ACP. In addition, modules may also contain domains that successively modify the β-keto group to a hydroxyl (ketoreductase, KR), a double bond (dehydratase, DH), or a single bond (enoylreductase, ER). The ACP employs a phosphopantetheine (Ppant) arm and thioester bond to tether polyketide intermediates and building blocks, and transfers them to respective catalytic domains for loading, extension, and keto group processing or modification. Through direct fusion or a non-covalent docking interaction, the ACP also transfers the fully processed intermediate to the KS in the subsequent module for further extension or to the thioesterase (TE) in the final module for release through hydrolysis or cyclization.
Figure 1.
Modular polyketide synthase for pikromycin. The six modules of the pikromycin PKS, comprised of PikAI-IV polypeptides, sequentially elongate and modify a polyketide intermediate. A polyketide product, either 10-deoxymethynolide (10-dml) from module 5 or narbonolide (nbl) from module 6, is off-loaded by the thioesterase domain (TE) of the final module, PikAIV. Modules are differently colored. Circles represent protein domains (ketosynthase KS, acyltransferase AT, dehydratase DH, enoyl reductase ER, ketoreductase KR and acyl carrier protein ACP; KSQ is a decarboxylase; KR* is inactive), and docking domains are shown as jagged ends. PikAIII schematic: The 1562-amino acid PikAIII polypeptide, selected for this study, is shown with functional domains in contrasting colors, used throughout, and linker peptides identified by residue ranges. The N- and C-terminal docking domains are shown as helices, as are the post-ACP dimerization helices.
Modular PKSs are thought to share a common ancestor with the mammalian fatty acid synthase (FAS)3. However, to achieve perfect fidelity in product formation, the sequential modular PKSs have evolved to be highly ordered in structure and function. The FAS on the other hand acts iteratively within a single multifunctional protein with no inherent ability to deviate from its role to construct saturated fatty acid chains. Whereas the FAS accesses a single ACP, the PKS must ensure that the many ACPs within a multi-module assembly line deliver their respective polyketide intermediates with absolute fidelity to the appropriate modules and catalytic domains. Furthermore, PKSs have evolved through insertion or deletion of catalytic domains to vary significantly in the series of reactions performed within a single module2.
Currently, no high-resolution structure is available for any PKS module, although crystal structures have been reported for various excised PKS catalytic domains, KS-AT di-domains and docking domains4–21. Despite the important insights from these studies, the working model for the PKS module is based on a crystal structure of the porcine FAS22, which poses several limitations due to differences in the oligomeric state and structure of individual catalytic domains as well as substantial differences in linker regions. Thus, obtaining high-resolution information on the overall structure and organization of a complete PKS module is central for understanding polyketide extension, processing and diversification.
Cryo-EM visualization of PikAIII
To investigate the structure of a full-length type I PKS module we applied single particle electron cryo-microscopy (cryo-EM) to visualize pikromycin PKS module 5 (PikAIII) from Streptomyces venezuelae (Fig. 1)23. The mono-module polypeptide, PikAIII, bearing the KS5-AT5-KR5-ACP5 domain architecture (Fig. 1), can be produced in pure, stable form (Extended Data Fig. 1a) and characterized by established biochemical assays24,25.
Cryo-EM 3D reconstructions of PikAIII were obtained in different physiological states. In conditions where more than one PikAIII conformation was observed, we followed a multiple-reference classification approach26,27 to separate cryo-EM projections and calculate independent 3D reconstructions of each conformer. Based on micrograph quality control and inclusion of several thousands of cryo-EM images, we obtained final 3D maps with indicated resolutions of 7.3–9.5 Å (Extended Data Fig. 1–4). The 3D maps revealed secondary structures within PikAIII and allowed precise rigid body fitting of the homologous structures of the KS, AT, KR and ACP domains from the erythromycin synthase (DEBS) 7,11,20, leading to highly accurate pseudo-atomic resolution structures of PikAIII. Thus, herein we describe the first structural snapshots of a full-length PKS module in different functional states.
Overall structure of the PKS module
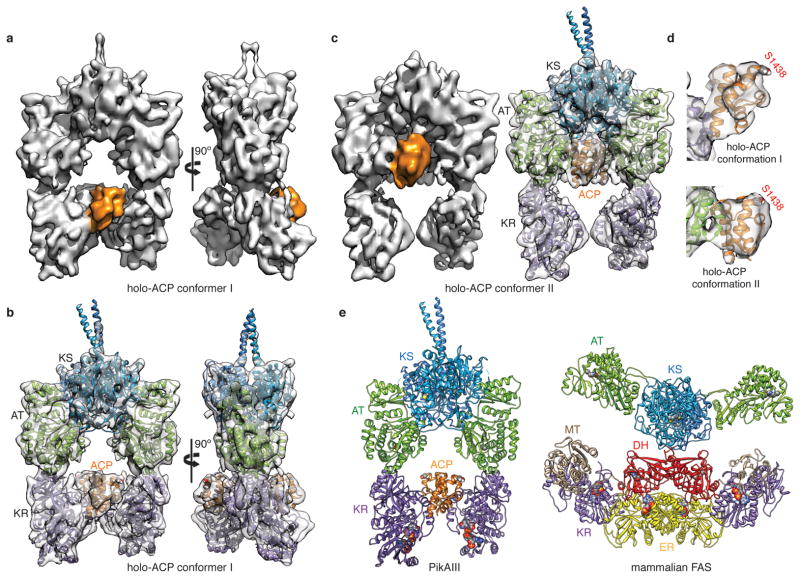
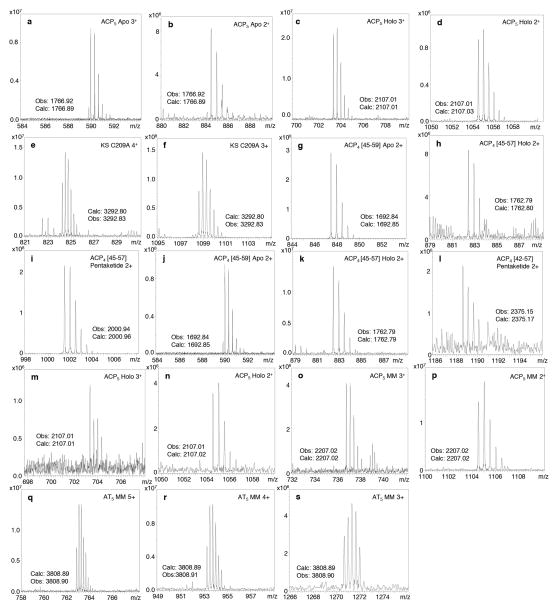
The cryo-EM structure of the 328 kDa (dimeric) PikAIII with the intra-module ACP5 bearing a Ppant arm (holo-PikAIII) (Extended Data Fig. 1b, c and 5a-d) reveals an arch-shaped symmetric dimer with the homodimeric KS5 at the dome supported on either side through a post formed by an AT5 followed by KR5 at the base (Fig. 2a,b,c). The ACP5 domains, which fit unambiguously into their corresponding densities (Fig. 2d), are found to populate two distinct positions in an ~1:1 ratio, one near KR5, and one near AT5 (Fig. 2; Extended Data Fig. 4). In both conformers the remaining domains display identical configurations. Bottom-up liquid chromatography/Fourier transform ion cyclotron resonance mass spectrometry (LC/FT-ICR MS) established that the Ppant arm was present at a high level (Extended Data Fig. 5a-d), suggesting that the distinct ACP5 locations are not attributable to the presence or absence of this post-translational modification. In addition, multiple reference-supervised classification tests could not detect a statistically significant fraction of holo-PikAIII dimers with the two ACP5 domains in non-equivalent positions, i.e. one near the AT5 and the other near the KR5, providing evidence for concerted ACP5 movement.
Figure 2.
Cryo-EM structures of holo-PikAIII. a, Solid rendering and b, transparent representations with modeled structures of the cryo-EM map of holo-PikAIII conformer I. This conformation, in which the ACP5 (orange) is near KR5, is observed in 57% of particle projections. c, Solid rendering (left) and transparent representations with modeled structures (right) of the cryo-EM map of holo-PikAIII conformer II. This conformation, in which ACP5 (orange) is near AT5, is observed in 43% of particle projections. d, Fitting of the ACP structure20 in the corresponding density of both holo-PikAIII conformers reveals that Ser1438 is directed away from any active site. e, Comparison of holo-PikAIII full module and mammalian FAS22. The KS is blue, AT is green, ACP is orange (disordered in FAS), DH is yellow, and ER is red. Active sites are highlighted with spheres.
The KS5-AT5 configuration in the complete PikAIII module resembles an earlier proposed PKS model28 but is strikingly different from the configuration of the excised KS-AT di-domains6,7,21 (Extended Data Fig. 6a) and the mammalian FAS22 (Fig. 2e). In full-length PikAIII each AT is rotated by ~120° relative to its position in the FAS and excised KS-ATs, and forms an extensive interface with KS5 (Extended Data Fig. 7a). In this arrangement, AT5 and the following KR5 domain reside below KS5, creating a single ACP5 reaction chamber in the center of the PikAIII dimer, with the AT and KR active sites facing the chamber. The characteristic long and narrow shape of the PikAIII reaction chamber is likely crucial for excluding ACPs of other modules, thus providing a mechanism to maintain biosynthetic fidelity.
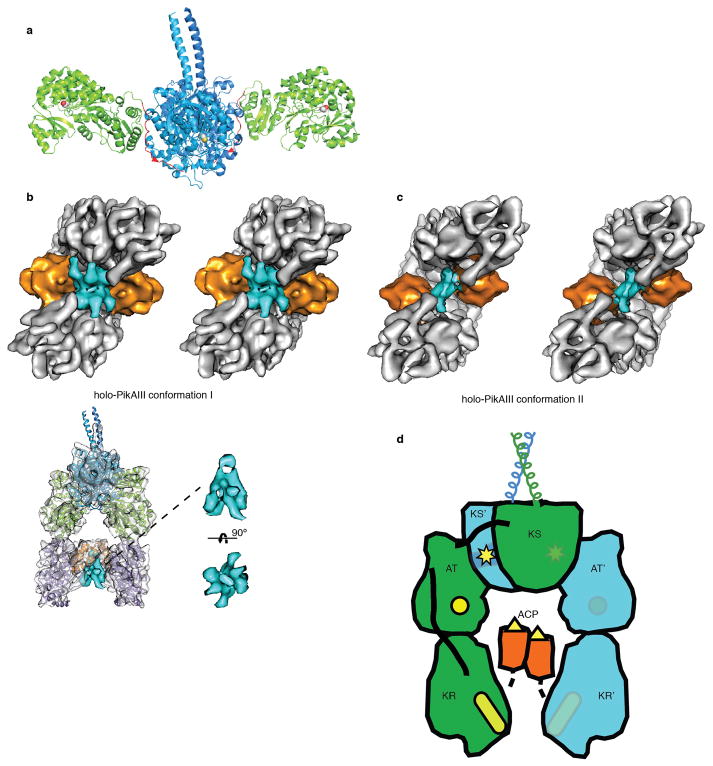
The 3D maps of PikAIII reveal weak density for the post-ACP5 dimerization helices (Extended Data Fig. 6b,c) and no density for the inter-domain connecting loops, either because of insufficient resolution, disorder, or a combination of both. Nevertheless, linker lengths and distance limitations indicate that each AT5-KR5 post includes domains of the same chain, while each AT interfaces with the KS of the opposite polypeptide (Fig. 1 and Extended Data Fig. 6d). The linker from KR5 to ACP5 (43 amino acids) is long enough to facilitate ACP interaction with the KS of either subunit, suggesting that other types of steric constraints may limit each ACP to interact with the KS domain of the opposite monomer, as reported for a DEBS module29,30. Only the KS5-AT5 linker (15 amino acids) is too short, requiring an additional eight amino acids to span the shortest distance between a KS5 C-terminus and an AT5 N-terminus (70 Å). This observation suggests that some amino acids at the AT N-terminus of excised KS-ATs may be part of the KS-AT linker in the full module. While the resolution of the EM maps does not allow us to confirm this hypothesis, several lines of evidence indicate that the KS5-AT5 interaction is associated with structural rearrangements at the domain interface. First, this is the only region of domain clashes between the crystal structures rigidly docked in the 3D maps, and structural rearrangements must occur to alleviate these clashes (Extended Data Fig. 7a,b). Furthermore, the position of AT5 relative to KS5 changes according to the substrate condition of PikAIII, indicating a dynamic KS5-AT5 interface that adapts to different states during the PikAIII catalytic cycle (see accompanying paper by Whicher et al.).
Mutagenesis of PikAIII domain interfaces
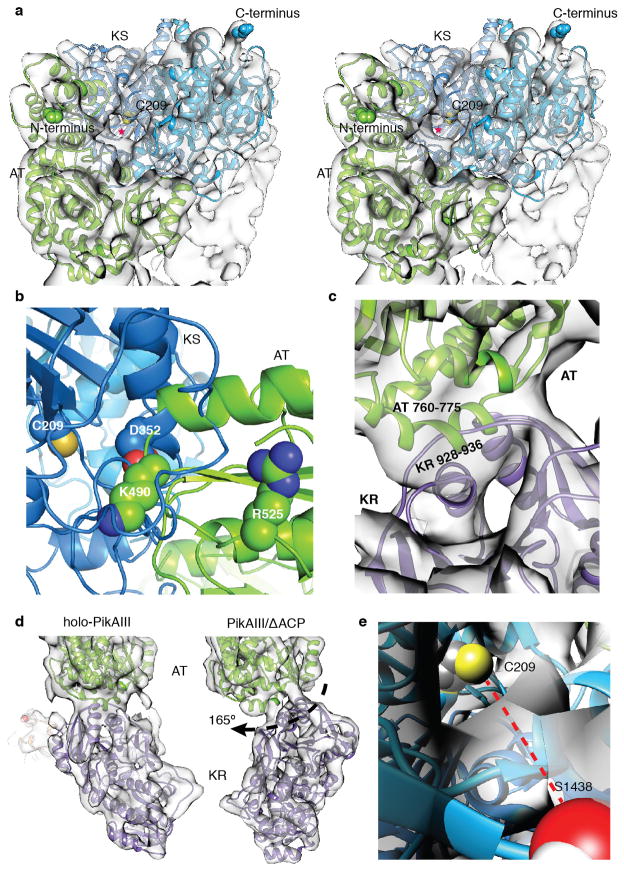
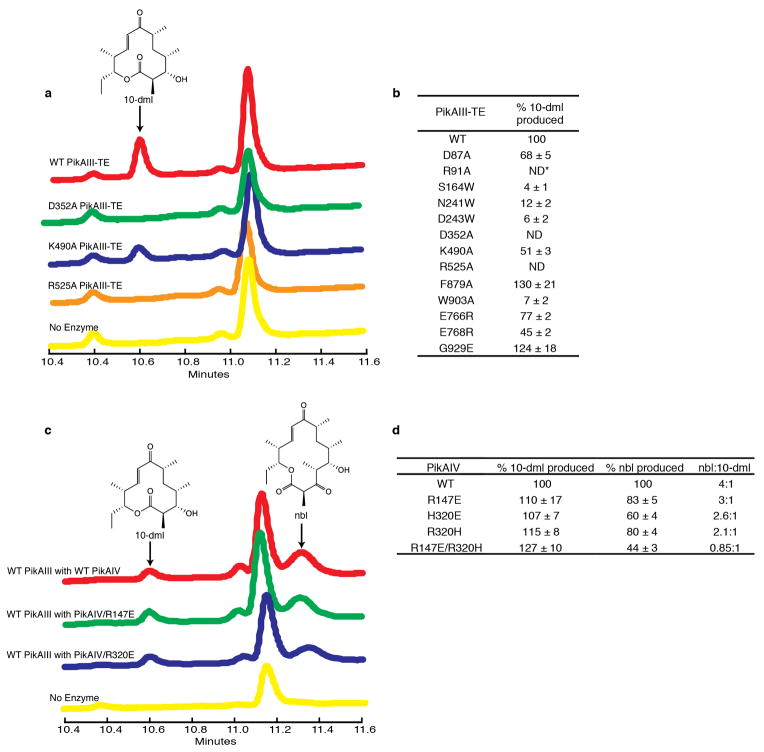
To probe the KS5-AT5 interaction and the associated conformational changes we generated KS5 and AT5 mutants in PikAIII-TE (PikAIII fused to the TE domain of PikAIV)24,25,31 and assessed their ability to generate 10-deoxymethynolide (10-dml) (Extended Data Fig. 8a,b), which is a natural macrolactone product of the Pik PKS24,25. PikAIII AT5 Lys490 and KS5 Asp352 are near one another within the KS5-AT5 clash zone whereas Arg525 is outside the clash zone (Extended Data Fig. 7b). Mutagenesis at these sites highlighted a critical role for Arg525, as also observed in the DEBS system32. The results suggest that conformational changes within AT5 accompany its interaction with KS5, whereby Arg525 is likely crucial to the domain interface while Lys490 is outside the interaction zone. Furthermore, these AT5 amino acids are near the KS5 active site entrance in full-length PikAIII, but far away in the excised KS-AT structures, providing further validation of the cryo-EM structure.
Linker distance limitations suggest that each AT interacts with the KS of the opposite chain but with the KR of the same monomer (Extended Data Fig. 6d). The AT-KR conformation is incompatible with anchoring of the post-AT linker (residues 891 – 903) to the side of a KS monomer (Extended Data Fig. 6a), as observed in crystal structures of excised KS-AT di-domains and mammalian FAS6,7,21,22, consistent with the lack of any corresponding density in the cryo-EM maps. To confirm this finding we mutated conserved Phe897 and Trp903, which make extensive KS contacts in the excised KS-AT crystal structures (Extended Data Fig. 8b). PikAIII W903A and F897A exhibited 7% and 130% of wild type activity, respectively, suggesting that Phe897 does not tether the post-AT5 linker in the position found in the crystal structures, and that Trp903 may have some other important functional role. We probed the AT5-KR5 interface (Extended Data Fig. 7c) with three single-site substitutions, E766R and E768R in AT5 and G929E in KR5. The AT5 mutations reduced activity (77%, E766R; 45%, E768R) compared to wild type, while the KR5 mutation had no effect, indicating that the observed AT5-KR5 interface may not be crucial for PikAIII function (Extended Data Fig. 8b).
KS5 active site entrance for PikAII ACP4
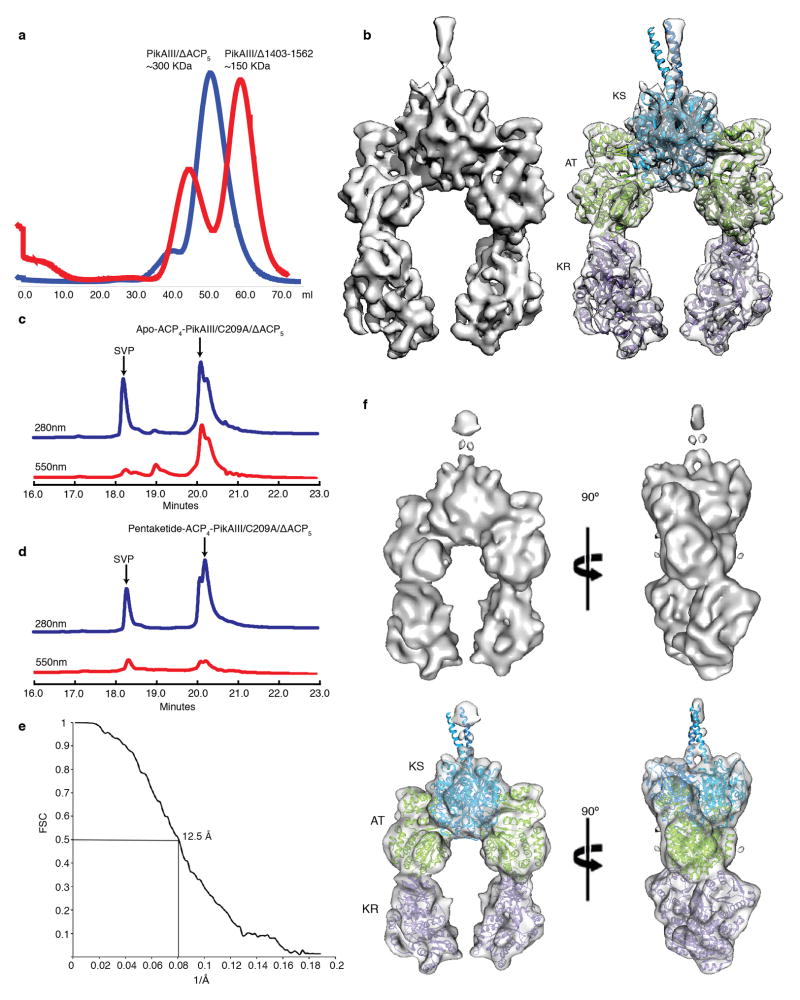
To examine how the upstream ACP4 domain (PikAII module 4, Fig. 1) docks and transfers the pentaketide intermediate to PikAIII KS5, we created a PikAIII lacking ACP5 to allow visualization of the upstream ACP4 without the added complexity of the intra-module ACP. Unexpectedly, we found that a PikAIII lacking ACP5 and its corresponding dimerization helices (PikAIII/Δ1403-1562) was monomeric (Extended Data Fig. 9a), while a PikAIII with an internal ACP deletion (ΔACP5) but including the post-ACP5 sequences (PikAIII/ΔACP5) was dimeric (Extended Data Fig. 9a). This finding suggests that PikAIII dimerization by KS5 is relatively weak and formation of a stable dimer requires the additional avidity provided by the post-ACP dimerization helices. The structure of PikAIII/ΔACP5 at 7.8 Å (Extended Data Fig. 4 and 9b) revealed the same overall architecture of the PikAIII module as shown for holo-PikAIII, but with KR5 domains rotated by 165º about each leg of the PikAIII arch (Extended Data Fig. 7d). Thus, the orientation of the KR5 domains with respect to the AT5 domains appears to be strongly influenced by the presence of the intra-module ACPs.
We next examined a PikAIII/ΔACP5 variant bearing ACP4 fused with a flexible linker to the N-terminal docking domain of KS5. Fusion of the ACP4 was necessary due to the weak affinity of docking domains (Kd of 5 μM)5. The KS5 active site Cys209 was substituted with an alanine (ACP4-PikAIII/C209A/ΔACP5) to prevent intermediate transfer from a pentaketide-loaded ACP4 (Extended Data Fig. 5e,f). Bottom-up LC/FT-ICR MS confirmed pentaketide loading onto the ACP4-PikAIII/C209A/ΔACP5 fusion protein (Extended Data Fig. 5g-l and 9c,d). The structure of pentaketide-ACP4-PikAIII/C209A/ΔACP5 at 8.6 Å revealed ACP4 bound on the top of KS, completely outside the intra-module ACP5 chamber (Fig. 3a). The structure of ACP20 was accurately docked in its corresponding density near the entrance of the KS5 active site channel, revealing that ACP4 Ser3605 is near the KS5 catalytic Cys209 (Fig 3b).
Figure 3.
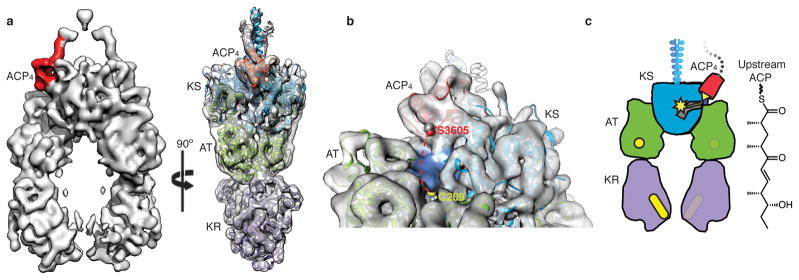
Interaction of upstream ACP with the PKS module. a, Orthogonal views of solid rendering (left) and transparent representation with modeled structures (right) of the cryo-EM map of pentaketide-ACP4-PikAIII/C209A/ΔACP5 at 8.6 Å resolution. b, The position of Ser3605 proximal to the KS active site entrance. Ser3605 (red sphere) and Cys209 (yellow sphere) are 28 Å apart (dashed red line). Loops 1 and 2 of ACP4 (residues 3588-3606 and 3624-3634) contact two helices (residues 284-293 and 316-322) and a loop (residues 140-150) of KS5. c, Cartoon representation of pentaketide-ACP4-PikAIII/C209A/ΔACP5. The upstream ACP (red with yellow serine) carrying the pentaketide intermediate (yellow line) docks to the side entrance of the downstream KS (blue with yellow active site).
To probe the interaction between upstream ACP and downstream KS, we mutagenized the interaction region of PikAIV (module 6) KS6. The well-established PikAIII/PikAIV24,33 assay generates two products, which are formed by transfer of the β-hydroxyhexaketide from PikAIII ACP5 to the PikAIV KS6 (following chain extension to the heptaketide and cyclization to generate narbonolide; nbl) or directly to the PikAIV TE (to generate 10-dml) (Fig. 1 and Extended Data Fig. 8c). Therefore, formation of nbl requires a functional ACP5/KS6 interaction while formation of 10-dml does not33. PikAIV KS6 residues Arg147 and Arg320 are analogous to PikAIII KS5 basic residues at the ACP4/KS5 interface in the cryo-EM reconstructions. Substitutions R147E, R320E, R320H, and R147E/R320H reduced nbl formation to 83%, 60%, 80%, and 44%, respectively, compared to wild type PikAIV, but did not affect 10-dml formation (110%, 107%, 115%, 127%, respectively) (Extended Data Fig. 8d).
Interestingly, no density for the upstream ACP4 was observed in the cryo-EM map of unloaded holo-ACP4-PikAIII/C209A/ΔACP5 (Extended Data Fig. 9e,f). These findings provide strong evidence that the substrate intermediate loaded on upstream ACP4 is a primary driver of docking at the KS5 active site entrance, in addition to protein-protein interactions as identified in the Pik and DEBS systems5,33–35.
KS5 active site entrance for PikAIII ACP5
Next, we probed how the intra-module ACP5 engages the KS5 active site when it carries the ACP5-bound methylmalonyl (MM) extender unit for elongation. To prepare MM-loaded ACP5, we incubated holo-PikAIII with MM-CoA and confirmed the presence of MM-ACP5 and MM-AT5 (Extended Data Fig. 5m-s)36 by bottom-up LC/FT-ICR MS. The cryo-EM structure of MM-PikAIII at 7.3-Å resolution (Fig. 4a) showed the same overall PikAIII conformation. However, MM-ACP5 interacts with a loop (residues 83-92) at the bottom of the KS5 within the ACP5 chamber, further indicating that ACPs localize according to the tethered substrate. Despite the overall high resolution of the MM-PikAIII cryo-EM map, the ACP does not fit its corresponding density with the remarkable accuracy we found in the other states, suggesting significant flexibility. The lack of ACP positional rigidity is expected, considering the flexibility of loops at this site in the KS-AT crystal structures6,7,21. Nevertheless, the conformation that provides the highest cross-correlation between the ACP5 model and the EM density is consistent with previous ACP mutagenesis data6,34,35 and places the ACP5 Ser1438 below the KS5 active site at a distance of 25 Å (Extended Data Fig. 7e). To confirm this interaction we produced single-site loop substitutions, which abolished macrolactone formation (R91A) or decreased it (D87A, 30% reduction) (Extended Data Fig. 8b).
Figure 4.
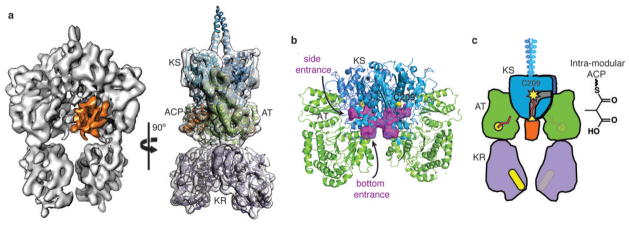
Interaction of intra-module ACP5 with KS5 in methylmalonyl-PikAIII. a, Orthogonal views of solid rendering (left) and transparent representation with modeled structures (right) of the MM-PikAIII cryo-EM map at 7.3-Å resolution. The ACP (orange) has shifted ~20 Å relative to its position in holo-PikAIII conformer II. b, KS active site channels. Internal cavity analysis (purple surface) depicts channels to the active site from both the side and bottom entrances. c, Cartoon representation of MM-PikAIII. AT (green, yellow active site) loading of the MM building block (red) onto the intra-module ACP (orange, yellow serine) positions the carrier domain at the bottom entrance of KS (blue, yellow active site) for decarboxylative condensation, remote from the KR domain (purple, yellow active site).
The ACP5 location in MM-PikAIII is far from the previously established KS5 active site entrance, suggesting the existence of a second entrance at the bottom of KS5. Indeed we find that KS domains of modular PKSs display a previously unrecognized active site entrance, which faces the central ACP5 chamber of PikAIII (Fig. 4b) and is surrounded by a loop (163-174 in PikAIII) with low sequence conservation and high flexibility in the KS-AT crystal structures6,7,21. To confirm the functional role of the channel we sought to obstruct it by substituting tryptophan for amino acids surrounding the channel entrance. Consistent with our hypothesis, the single substitutions S164W, N241W, and D243W displayed 4%, 12%, and 6% of wild-type activity, respectively (Extended Data Fig. 8b). Taken together, the MM-PikAIII structure, mutagenesis results, and sequence alignments across many type I modular PKSs reveal a new active site entrance that faces into the KS-AT-KR catalytic chamber. The entrance is used by the intra-module ACP to transfer substrates to and from the KS. In contrast, FAS I and II, as well as type II and III PKSs lack this second entrance22,37–40. Instead, the bottom channel is closed by well-ordered loops and the channel harboring the KS catalytic cysteine has only one entrance.
Conclusion
The PikAIII structure, strikingly different from the more open architecture of mammalian FAS with its two ACP chambers22 (Fig. 2e), reveals nature’s remarkable design of a dimeric type I PKS module with a single chamber that sequesters the active site entrances so they are readily accessible to the intra-module ACP and unlikely to encounter incorrect substrates delivered by other near-neighbor ACPs. This architecture facilitates efficient substrate channeling by providing separate entrances to the KS active site for the ACP carrying an intermediate from the upstream module and for the intra-module ACP that carries the next extender unit and, subsequently, the elongated intermediate (Fig. 3c and 4c). The newly identified intra-module ACP entrance on the KS is almost certainly inaccessible to the upstream ACP, which is docked to the KS coiled-coil. It is less certain whether the intra-module ACP can reach the KS entrance for the upstream ACP, as the linker peptides were not visible in our cryo-EM maps. In addition, the intra-module KS entrance appears to be a unique feature of bacterial type I modular PKSs as it was not observed in iterative type II PKS, ACP-less type III PKS, mammalian FAS, yeast FAS and bacterial type II FAS structures22,37–39,41. This difference is presumably because none of these systems has a need for more than one ACP to engage the KS active site. The dual KS entrances may also facilitate module “skipping” as observed in the Pik and DEBS systems42,43.
The PikAIII dimeric architecture is fundamental to bacterial type I modular PKSs because it creates a single ACP chamber. Thus, why do the structures of excised KS-AT di-domains6,7,21 fail to mimic the structure of the full module? Perhaps the answer lies in the fact that all PKS modules have at least one dimerization element that is C-terminal to the AT domain and is, therefore, missing from excised KS-AT di-domains4,44. Dimerization can occur through a dehydratase domain12,13, post-ACP dimerization helices as in PikAIII4, or a post-AT dimerization domain21,44. With respect to bimodules that are naturally fused, the downstream KS is a dimerization element for the upstream module because the inter-module linker has neither post-ACP dimerization helices nor a pre-KS coiled coil. Furthermore, in PikAIII, the post-ACP dimerization helices are essential to dimer formation (Extended Data Fig. 9a) and exert an outsize influence on the overall module structure, as seen in the large rotation of the KR5 (165º) upon ACP5 deletion (PikAIII/ΔACP5) (Extended Data Fig. 7d) and the in-concert movement of the two ACP5s.
The ACP5 position within the module appears to be dictated by the substrate linked to the phosphopantetheine arm, as indicated by the specific ACP localization in the MM-PikAIII state and in the ACP4-PikAIII fusion loaded with pentaketide. Surfaces of ACP4 and ACP5 that engage the enzyme domains are similar to those involved in formation of other ACP-enzyme complexes45–47. These findings provide the first evidence of an elegant mechanistic solution for ACP transfer whereby the identity of the processed substrate itself, instead of specific protein-protein interactions, is the major determinant of ACP positioning, consistent with observations that natural intermediates are processed more effectively than unnatural substrates24,48. This brilliant design allows for efficient and specific transfer of intermediates and optimal throughput of the assembly line.
Methods
Design of expression constructs
Construction of expression plasmids for PikAIII (pPikAIII) and PikAIV (pPikAIV) was described previously49. All PikAIII constructs were ligated into a pET28b expression plasmid and the PikAIV construct was ligated into a pET24b expression plasmid (Novagen). The expression plasmid for PikAIII lacking the ACP (pPikAIII/ΔACP5) was constructed with overlap PCR. Two PikAIII fragments were amplified from pPikAIII: 1) starts upstream of a natural FseI site and ends at the ACP N-terminus and 2) starts at the ACP C-terminus and ends at the PikAIII C-terminus. These fragments, which contained complementary ends, were put into a second PCR to amplify a fragment lacking the ACP. This fragment was digested with FseI and HindIII and inserted into pPikAIII digested with the same enzymes to produce pPikAIII/ΔACP5. Primers for construction of pPikAIII/ΔACP5 were as follows (bold font indicates overhangs used for ligation into vectors and italics indicate complementary overhangs used for overlap PCR):
PikAIII-FseI_For:
GAGCACCCCGAACGCTGG
PikAIIIΔACP_Rev:
CGGCTCGGCCGGTGCGAGCGACGACTGCCCGGTCGG
PikAIIIΔACP_For:
CCGACCGGGCAGTCGTCGCTCGCACCGGCCGAGCCG
PikAIIIHindIII_Rev:
CAATAAGCTTTCAGGTGTTACGGGGGCC
The expression plasmid for the PikAII module 4 ACP4 with PikAIII/ΔACP5 having an inactivated KS (ACP4-PikAIII/C209A/ΔACP5) was derived from pPikAIII/ΔACP5. The QuikChange Lightning multi-site site directed mutagenesis kit (Stratagene) was used to engineer an MfeI site at the final codon of the PikAIII KS5 docking domain and substitute an Ala for Cys209 (pPikAIII/ΔACP5/MfeI/C209A). A fragment encoding the PikAII module 4 ACP4 was amplified from pLZ7123 and a fragment encoding PikAIII KS5 docking domain was amplified from pPikAIII. These fragments, which contained complementary overhangs encoding an 10-amino acid (Gly3Ser)2 linker, were put into a second PCR to amplify the fusion. This fusion was digested with NdeI and MfeI and inserted into pPikAIII/ΔACP5/MfeI/C209A digested with the same enzymes to make pACP4/PikAIII/C209A/ΔACP5. Primers for construction of pPikAIII/ΔACP5/MfeI/C209A were as follows (bold font indicates overhangs used for ligation into vectors, italics indicate complementary overhangs used for overlap PCR, and underlined text indicates mutated base pairs in the site-directed mutagenesis primers.):
PikAIIIMfe1
ACGCACGCACGAGCCAATTGCGATCGTGGGCATG
M4ACPddNdeI_For
CTGCATATGCTCGGCGGGCGGCTC
M4ACPddPikAIIIKSdd_Rev
GCCTCCACCACTACCTCCCCCACCGAAGTCGGAGTCGCCCAG
PikAIIIKSddM4ACPdd_For
GGAGGTAGTGGTGGAGGCAGTGGGATGGCGAACAACGAAGACAAG
PikAIIIKSddMfe_Rev
CACGATCGCAATTGGCTCGTGCGTGCGTCCCTC
PikAIIIC209A
GCCCTGACCGTGGACACGGCCGCCTCGTCCTCGCTGGTCGCCCTG
Construction of the expression plasmid for PikAIII fused to PikAIV TE (pPikAIII-TE) was described previously31. Mutations of pPikAIII-TE and pPikAIV were made with site directed mutagenesis using the QuikChange Lightning kit. All DNA constructs were confirmed with sequencing. Site directed mutagenesis primers were as follows (underlined text indicates mutated base pairs in the site-directed mutagenesis primers.):
PikAIIID87A
CTGTACGACCCCGACCCGGCCGCGTCCGGCAGGACGTAC
PikAIIIR91A
GACCCGGACGCGTCCGGCGCGACGTACTGCCGGTCCGGC
PikAIIIS164W
TGGCACACCGGCTACACCTGGGGGCAGACCACCGCCGTG
PikAIIIN241W
GGTGTCACGGTCATGCCCTGGGCGGACCTGTTCGTGCAG
PikAIIID243W
GTCACGGTCATGCCCAACGCGTGGCTGTTCGTGCAGTTCAGCCGG
PikAIIID352A
ACGGGCACGCGGCTCGGCGCCCCGATCGAGGCGCAGGCC
PikAIIIK490A
CCGTGGCCGGTGTCCGCGGCGACTCCGGCCGCGCTGGAC
PikAIIIR525A
CGCGCCCTGGTCGACAGCGCTACGGCGATGGAGCACCGC
PikAIIIE766R
CGGCAGGTCGAGATCATCAGGAAGGAGCTGGCCGAGGTC
PikAIIIE768R
GTCGAGATCATCGAGAAGAGGCTGGCCGAGGTCCTCGCC
PikAIIIF897A
CCCGAGCTCCCCACCTACGCCGCCCAGACCGAGCGCTTC
PikAIIIW903A
CAGACCGAGCGCTTCGCGCTGCAGAGCTCCGCGCCC
PikAIIIG929E
AAGCCGCTGACGGCCTCCGAGCAGGCGGACCTGTCCGGG
PikAIVR147E
ATCGACCCCGCGTCGGTCGAGGGCACCGACGTCGGCGTG
PikAIVR320E
CACGGGCCCTCCCAGCAGGAGCTGATCCGCCAGGCCCTG
PikAIVR320H
CACGGGCCCTCCCAGCAGCACCTGATCCGCCAGGCCCTG
Expression and Purification
All expression plasmids, except pACP4/PikAIII/C209A/ΔACP5, were expressed in E. coli Bap1 cells50 to produce holo ACP. pACP4/PikAIII/C209A/ΔACP5 was expressed in BL21 (DE3) to produce apo ACP. Transformed bacteria were cultured at 37°C to an OD600=1 in 0.5 L of TB media with 50 μg/ml kanamycin. After incubation at 20°C for 1 hr, cells were induced with 200 μM IPTG and allowed to express for approximately 18 hr.
Cell pellets were re-suspended in 300 mM NaCl, 10% glycerol with either 50 mM HEPES pH 8 (buffer A pH 8; ACP4-PikAIII/C209A/ΔACP5) or 50 mM HEPES pH 7.4 (buffer A pH 7.4; all other constructs) containing 0.1 mg/mL lysozyme, 0.05 mg/mL DNase, 2 mM MgCl2 and 20 mM imidazole. Cells were lysed by sonication, centrifuged, and the supernatant was loaded onto a 5-mL His trap column (GE Healthcare). A gradient of 15–300 mM imidazole in buffer A over 10 column volumes was used to elute the proteins.
For PikAIII, PikAIV and PikAIII-TE proteins used in assays, the peak fractions from the His-trap column were dialyzed overnight into buffer A pH 7.4 and then frozen. For PikAIII proteins analyzed with EM, peak fractions from the His column were collected and further purified with a HiPrep 16/60 Sephacryl S300 HR column in buffer A. The peak fractions from the first gel filtration column were collected and further purified with a second HiPrep 16/60 Sephacryl S300 HR column (Extended Data Fig. 1a).
Substrate loading of PikAIII constructs
Proteins were dialyzed into 50 mM HEPES pH 7.4, 100 mM NaCl prior to substrate loading. The holo-PikAIII and PikAIII/ΔACP samples were not incubated with substrate. For the MM-PikAIII sample, 1 μM holo PikAIII was incubated with 500 μM MM-CoA 30 min at room temperature.
To prepare ACP4-PikAIII/C209A/ΔACP5, in which the ACP4 was loaded with pentaketide, 6 μM apo ACP4-PikAIII/C209A/ΔACP5 from the first gel filtration column was incubated with 100 μM pentaketide-CoA, 10 μM SVP (a non-specific phosphopantetheinyl transferase)51, 10 μM MgCl2 for 2 hrs at 30°C in buffer A pH 8, and re-purified with a second HiPrep 16/60 Sephacryl S300 HR column equilibrated with 50 mM HEPES pH 6.8, 300 mM NaCl, 10% glycerol (buffer A pH 6.8). The peak fraction was collected from the second gel filtration, dialyzed into 50 mM HEPES pH 6.8, 100 mM NaCl.
Mass spectrometric analysis of active site occupancy
Bottom-up liquid chromatography/Fourier transform ion cyclotron resonance mass spectrometry was used to confirm the presence or absence of substrate in each domain of holo-PikAIII, methylmalonyl-PikAIII, and ACP4-PikAIII/C209A/ΔACP5. 25 μL 2 μM holo-PikAIII, 25 μL 2 μM MM-PikAIII, 25 μL 2 μM pentaketide-ACP4-PikAIII/C209A/ΔACP5, and 25 μL 2 μM holo-ACP4-PikAIII/C209A/ΔACP5 were diluted with 20 μL of 250 mM ammonium bicarbonate pH 8.0. Trypsin in 50 mM acetic acid was added in an enzyme:substrate ratio of 1:10. Proteolysis was allowed to proceed 15 min at 37 °C followed by addition of formic acid (pH 4). Samples were stored at −20°C until analysis.
45 μL sample were injected onto a Synergi Hydro C18 hydrophilically endcapped 1 × 150 mm column with 4 μm particles (Phenomenex, Torrance, CA). A gradient was generated on an Agilent (Santa Clara, CA) 1100 HPLC. The gradient was as follows (with isocratic elution between 40 and 50 min): 0 (98,2), 20 (70,30), 40 (50,50), 50 (50,50), 55 (30,70), 70 (2,98). Values are provided as time (%A, %B) over a total run time of 90 min. Flow was at 50 μL/min and was diverted for the first 5 min of the run. HPLC solvent A was 0.1% formic acid (ThermoFisher Scientific, Waltham, MA) in HPLC-grade water (ThermoFisher Scientific), and solvent B was 0.1% formic acid in acetonitrile (ThermoFisher Scientific). The LC was coupled to a quadrupole FTICR-MS (SolariX with 7T magnet, Bruker Daltonics, Billerica, MA). Data were gathered from m/z 200–2000 in positive ion mode. Electrospray was conducted at 4500 V with four scans per spectrum and a 256k transient. External ion accumulation in a hexapole was 0.2 s and there was 1 ICR fill prior to excitation and detection. External calibration utilized HP-mix (Agilent). PikAIII peptide products were detected over three samples in separate runs.
Mass spectrometric analysis of the pentaketide-ACP4-PikAIII/C209A/ΔACP5 unexpectedly detected apo-ACP4 in the pentaketide-loaded sample. Therefore, we used a second method to directly quantitate the level of apo-ACP4-PikAIII/C209A/ΔACP5, which can be loaded with a chromophore from CoA (CoA 547, New England Biolabs) (Extended Data Fig. 9c,d). 10 μM apo ACP4-PikAIII/C209A/ΔACP5 or 10 μM pentaketide-loaded ACP4-PikAIII/C209A/ΔACP5 (loading as described above) were incubated 2 hrs with 20 μM SVP, 100 μM CoA 547 (New England Biolabs), 10 mM MgCl2, 100 mM Tris pH 8 at 30°C in 15 μL reaction volumes. Reactions were quenched with addition of 30 μM EDTA and diluted to 75 μL with dH20. 50 μL of each reaction were injected onto a PLRP-S 4000 A column (8 μm, 50 X 2.1 mm) (Varian, Inc.) with flow rate of 0.3 mL/min and a protocol as follows: 5% solvent B (acetonitrile with 0.1% formic acid) for 2 min, 5–60% solvent B for 18 min, 60–100% solvent B for 5 min, and 100% solvent B for 5 min. Solvent A was 0.1% formic acid in water. Levels of apo-ACP4-PikAIII/C209A/ΔACP5 were quantitated by comparison of peak areas monitored at 280 nm (total protein) and 550 nm (chromophore absorbance).
Sample preparation and cryo-EM imaging
Sample quality and homogeneity were evaluated by conventional negative stain EM52. For cryo-EM, 3 μL of PikAIII preparations under different conditions (described above) was adsorbed on glow-discharged Quantifoil R2/2 200 mesh grids followed by blotting and vitrification with a Vitrobot (FEI, Mark IV). All specimens were imaged on a Tecnai F20 transmission electron microscope (FEI) equipped with a field emission gun operated at 120kV. Images were recorded at a magnification of 66,964x on a Gatan US4000 CCD camera and defocus values ranging from −1.5 to −3.5 μm (Extended Data Fig. 1c). All images were acquired using low-dose procedures with an estimated dose of ~20 electrons/Å2.
Image processing and 3D reconstructions
PikAIII particle projections were interactively selected and excised using boxer (EMAN 1.9 software suite)53 or e2workflow.py (EMAN2 software suite)54. The CTF parameters for each micrograph were determined using ctfit (EMAN 1.9 package)53. During the CTF determination process we selected only the images with clear signal at resolutions better than 13 Å and whose sum of power spectra of excised particle projections did not reveal any drift or visible astigmatism. The CTF correction was applied to the selected particles using applyctf (EMAN 1.9 package)53.
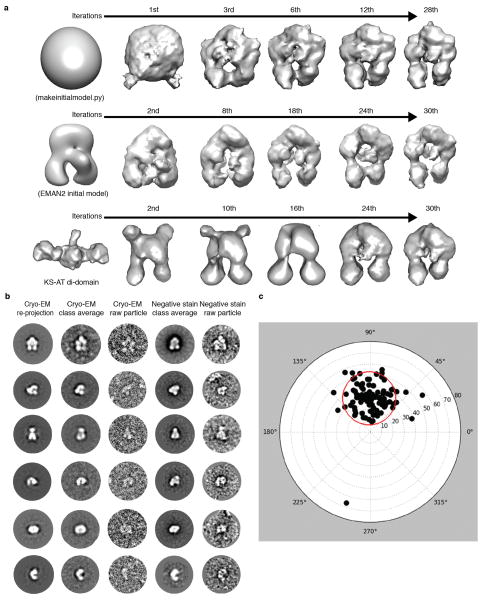
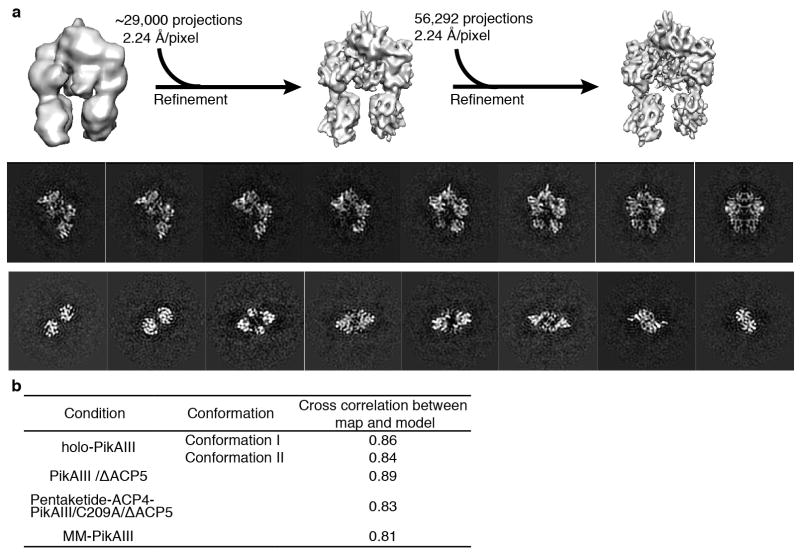
During the initial stages of this project we obtained tilt-pair EM images (0°/60°) of PikAIII embedded in negative stain. Reference-free classification and averaging revealed a particle architecture that was very different from the one of mammalian fatty acid synthase22 and in agreement with the architecture we show here by cryo-EM. However, the negative stain 3D reconstructions by the random conical tilt approach were not of good quality because of severe particle collapse and flattening on the carbon support of the EM grid. We thus tested several different starting models for projection matching of a small subset of MM-PikAIII cryo-EM data in order to produce a consistent and reliable first PikAIII model at low resolution. To this end we employed a sphere-like randomized initial reference model produced by makeinitialmodel.py (EMAN 1.9 suite)55, an initial model using class averages by e2initialmodel.py in EMAN254, and a low-pass filtered model of the KS-AT di-domain crystal structure7. Starting with these different models, and after several iterations of projection matching and 3D reconstruction, the refinements consistently converged to the same overall low-resolution structures (Extended Data Fig. 2a). Reprojections of these volumes showed good agreement with class averages and raw particle projection from both cryo-EM and negative stain PikAIII data (Extended Data Fig. 2b). Therefore, the structure from the sphere-like randomized initial reference volume was subsequently used for EMAN model-based projection matching and iterative angular refinement of the whole MM-PikAIII projection dataset (~56,000 projections). Initial rounds of projection matching and 3D reconstructions were performed with binned (2 × 2 pixels) projection images with a resulting pixel size of 4.48 Å on the specimen level. Non-binned images (pixel size 2.24 Å) and sub-pixel averaging were used in the later stages of refinement for calculation of high-resolution 3D maps (Extended Data Fig. 3a). During refinement we progressively decreased the angular step to a final 2º until convergence. Thus the final map of MM-PikAIII was produced with an indicated resolution of 7.3 Å at the 0.5 level of conventional FSC (Extended Data Fig. 4). The 3D map revealed distinct secondary structure features that are consistent with this resolution range. Importantly, the crystal structures of DEBS module 5 KS-AT di-domain7, and DEBS module 1 KR11 could be rigidly docked with high precision into the MM-PikAIII map and revealed an excellent agreement with the features of the 3D reconstruction (Fig. 4a). Cross correlation values between the overall model and the 3D maps are provided in Extended Data Fig. 3b. A 30-Å low-pass filtered map of MM-PikAIII was used as the initial model for iterative projection matching and 3D reconstructions of holo-PikAIII and PikAIII/ΔACP5. A 30-Å low-pass filtered map of PikAIII/ΔACP5 was used as an initial model for 3D reconstructions of ACP4-PikAIII/C209A/ΔACP5 and pentaketide-ACP4-PikAIII/C209A/ΔACP5. All refinements were executed based on the same overall protocol outlined above for MM-PikAIII and with final angular steps of 2°–5°. The number of projections used for each final reconstruction shown is provided in Extended Data Fig. 4. The final 3D EM maps were sharpened using EMBFACTOR56,57 and subsequently low-pass filtered to their corresponding indicated resolution range.
Multiple reference-supervised classification
In initial reconstructions of holo-PikAIII we observed two densities corresponding to ACP5, one close to KR5 and one between KS5 and AT5 (Fig. 2). To separate the particle projections corresponding to each ACP5 state we employed multiple reference-supervised classification. To this end we docked the structures of KS5, AT5, KR5 and ACP5 in the corresponding densities and produced two initial models whose only difference was the ACP5 positioning. We proceeded with multiple reference-supervised classification by subjecting the full dataset of 45,183 projections to the multirefine routine in EMAN (1.9)26,27 using the two above models as references. In this way the particle projections were classified into two categories according to their cross-correlation with reprojections of the two references of holo PikAIII. The number of particles in each category is provided in Extended Data Fig. 4. In the next step we used the two separate particle datasets to calculate the two independent 3D reconstructions using the low-pass filtered EM map of the MM-PikAIII as initial reference volume and thus avoiding any reference bias.
Resolution calculations and refinement procedure validation
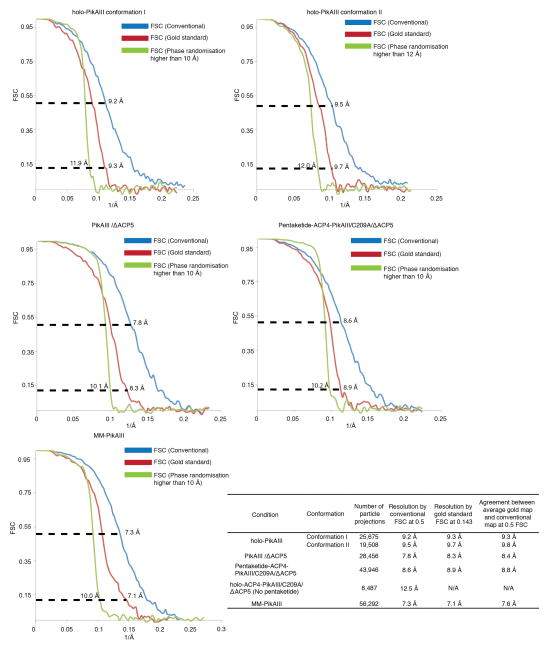
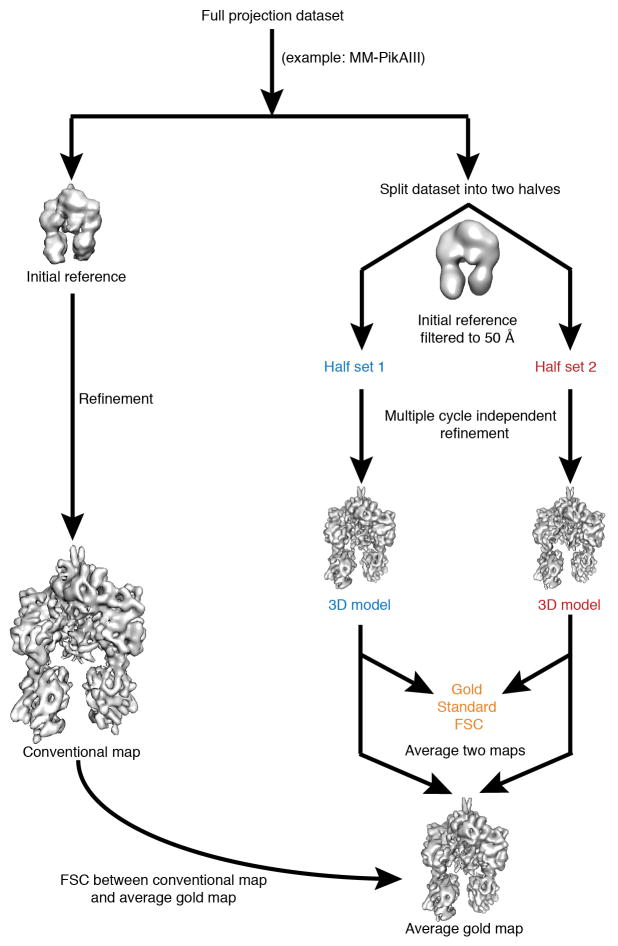
One set of resolution calculations was based on the conventional “even/odd” test in EMAN, whereby each dataset is split into two subsets, and each half is used to obtain a separate 3D reconstruction according to the orientation parameters established in the last round of refinement. The Fourier Shell Correlation (FSC) plots for all 3D reconstructions are provided in Extended Data Fig. 4. To test the validity of our reconstruction approach and also assess whether the obtained FSC values might be the result of over-refinement, we additionally ran gold-standard FSC tests58 for all the high-resolution PikAIII reconstructions. For these calculations we independently refined two half datasets of a condition against a 50-Å filtered EM map and compared the resulting two final independent maps by FSC (Extended Data Fig. 10). All resolution values reported below by conventional FSC measurements are according to the 0.5 criterion, and for gold standard FSC tests are according to the 0.143 criterion58. The resolution of the MM-PikAIII reconstruction is 7.1 Å by the gold standard procedure, in close agreement to the resolution of 7.3 Å indicated by the conventional FSC. In addition, the FSC between the MM-PikAIII map from the conventional procedure and a map resulting from averaging the two gold standard half-maps59 shows agreement at 7.6 Å (0.5 FSC) (Extended Data Fig. 4). For the PikAIII/ΔACP5 map, which is based on our smallest dataset, the gold standard FSC test indicates a resolution of 8.3 Å, about 0.5 Å beyond than that of conventional FSC (Extended Data Fig. 4). For the pentaketide-ACP4-PikAIII/C209A/ΔACP5 map, the gold standard FSC test indicates a resolution of 8.9 Å, about 0.3 Å beyond than that of conventional FSC (Extended Data Fig. 4). For the two conformations of holo-PikAIII, the gold standard FSC test indicates resolutions of 9.3 Å and 9.7 Å, which are very similar to the values from the conventional FSC test (9.2 Å and 9.5 Å). Thus, the calculated indicated resolution of each reconstruction presented in this work is consistent with the results of gold standard FSC procedures and does not indicate any detectable map over-refinement resulting in overestimation of resolution.
High-resolution phase randomization to determine any over-fitting
To further evaluate any over-fitting (noise refinement) in our 3D reconstruction protocol, we applied a phase randomization test for all the sub-nanometer resolution 3D maps of PikAIII. Phases for datasets of MM-PikAIII, PikAIII/ΔACP5, and pentaketide-ACP4-PikAIII/C209A/ΔACP5 were randomized beyond 10 Å, and phases for the dataset of each holo-PikAIII conformer were randomized beyond 12 Å using the makestack_HRnoise.exe program60 (kindly provided by Richard Henderson). All the data sets were divided into two halves and then refined according to the gold standard procedure58. The FSC curve of the phase-randomized data shows a sharp drop-off at 10 Å (or 12 Å for holo-PikAIII) and a lack of any obvious noise refinement for all reconstructions (Extended Data Fig. 4).
Tilt-pair parameter plot validation
The 3D cryo-EM reconstructions of PikAIII were also validated by a tilt pair parameter test61. For tilt pair validation we recorded image pairs of PikAIII/ΔACP5 with a tilt angle differential of 30° (+15°/−15°) using a Gatan K2 Summit on a Tecnai F20 transmission electron microscope (FEI) equipped with a field emission gun operated at 200kV. Images were recorded at a nominal magnification of 38,673x, corresponding to a pixel size of 1.23 Å at the specimen level. The total dose of the first and second image was 22 e/Å2 and 28 e/Å2, respectively, and fractionated over 20 sub-frames acquired over 4-second exposures. The sub-frames of each exposure were aligned with the UCSF alignment program59 (kindly provided by Yifan Cheng and Xueming Li) and merged. Tilt pair validation was processed with the corresponding routines of EMAN 2.07. 102 particle projection pairs were interactively selected using e2RCTboxer.py62, and CTF corrected using e2ctf.py. The tilt validation parameter plot (Extended Data Fig. 2c) was obtained with the program e2tiltvalidate.py62 and shows that the majority of tilt projections pairs cluster at the expected 30° tilt angle differential, thereby validating the 3D map.
Modeling and map visualization
The crystal structures of DEBS module 5 KS dimer (PDBID: 2HG4)7, AT monomer (PDBID: 2HG4)7 and DEBS module 1 KR monomer (PDBID: 2FR0)11 and the NMR structure of DEBs module 2 ACP (PDBID: 2JU1)20 were independently fit in the EM maps as rigid bodies using the fit in map routine in CHIMERA63. As the PikAIII KR5 domain is an A-type KR, we fit crystal structures of both an A-type9 and a B-type KR11 to the EM density. The highly similar KRs both fit well, but the B-type KR was a better fit in regions with low sequence identity and was used for all fitting. The fitting was performed by correlation optimization of a map simulated from the fit atomic coordinates against the 3D reconstructions (Extended Data Fig. 3b). Map visualization, rendering, and figure generation was done with CHIMERA63. Internal cavity analysis was done with HOLLOW (http://hollow.sourceforge.net). Molecular images without EM density were rendered with PyMOL (http://www.pymol.org/).
Enzyme Assays
PikAIII-TE and PikAIII/PikAIV assays were described previously24,25. Either 1 μM PikAIII-TE or 1 μM PikAIII and 1 μM PikAIV was added to a 100-μL reaction mixture containing 0.5 mM NADP+, 0.5 U/mL glucose-6-phosphate dehydrogenase, 5 mM glucose-6-phosphate in 400 mM sodium phosphate pH 7.2, 20% glycerol, 5 mM NaCl. This mixture was incubated for 10 min at room temperature and the reaction was initiated by addition of 1 mM thiophenol-pentaketide64,8 mM 2-vinylpyridine, and 20 mM methylmalonyl-SNAC. Following a 1-hr incubation at room temperature, the reaction was quenched by addition of a three-fold excess of methanol, vortexed, incubated for 15 min at −20°C, and centrifuged. The supernatant was analyzed by reverse-phase HPLC on a Luna C18(2) (5μm, 250 × 4.6mm) column (Phenomenex) with a flow rate of 1.5mL/min and by following this protocol: 5% solvent B (acetonitrile with 0.1% formic acid) for 1 min, 5–100% solvent B for 10 min, 100% solvent B for 4 min, and 5% solvent B for 2.5 min. Solvent A was 0.1% formic acid in water. Authentic standards confirmed the elution time of 10-dml and nbl. For the PikAIII-TE mutants, peak areas of 10-dml normalized to the values for wild-type PikAIII-TE were used to assess activity. For wild-type PikAIII and mutant PikAIV assays, activity was assessed from the peak areas of 10-dml and nbl normalized to the values for wild-type PikAIII and PikAIV.
Extended Data
Extended Data Figure 1.
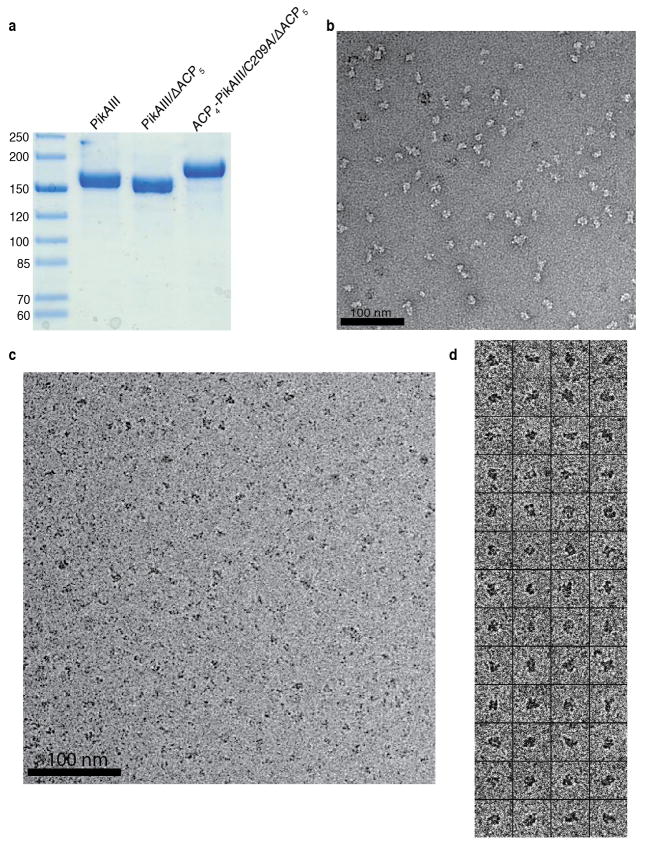
PikAIII sample preparation and raw EM images. a, SDS-PAGE gel of each purified form of PikAIII examined by cryo-EM. The numbers on the left indicate molecular weight in kDa. b, Raw EM image of holo-PikAIII particles embedded in negative stain. c, Raw cryo-EM image of holo-PikAIII particles. d, Boxed-out particle projections of holo-PikAIII.
Extended Data Figure 2.
PikAIII initial cryo-EM 3D reconstructions. a, Generation of initial MM-PikAIII reconstructions using 3,600 particle projections and employing three different starting models. Top: generation of a MM-PikAIII reconstruction using a randomized Gaussian sphere from makeinitialmodel.py in EMAN255. Middle: refinement of a starting model obtained by the EMAN2 initial-model-generation program e2initialmodel.py54. Bottom: refinement starting from a low pass filtered model of the excised KS-AT di-domain crystal structure7. These three different starting models converged to similar structures that are also in agreement with reference-free class averages. b, Comparison of re-projections of a low-resolution cryo-EM 3D map (iteration 28 of top panel in this figure) with reference-free 2D class averages and raw particle projections from both cryo-EM and negative stain PikAIII-MM data. c, Tilt pair parameter plot of PikAIII/ΔACP5 with a tilt angle differential of 30° (+15°/−15°). Black dots represent each particle pair’s tilt axis and tilt angle based on the cryo-EM map of PikAIII/ΔACP5. Most particle projection pairs cluster in a region (red circle) centered at 29.5° with an RMSD tilt angle of 8.3° and tilt axis of 90.23°.
Extended Data Figure 3.
Cryo-EM analysis of MM-PikAIII. a, Refinement of MM-PikAIII reconstruction: A 3D model obtained ab initio (see Extended Data Fig. 2) was used as a starting reference for initial projection matching of ~29,000 cryo-EM particle views to provide a map at 8.1-Å resolution (middle), which was subsequently used for the refinement of the entire MM-PikAIII dataset (56,292 projections) to obtain a final map at 7.3-Å resolution. The panels on the bottom show vertical and horizontal cross-sections of the final MM-PikAIII cryo-EM map. b, Cross correlation values between the overall pseudo-atomic resolution model and the 3D maps of various states of PikAIII.
Extended Data Figure 4.
Estimation of EM map resolution and assessment of over-refinement. Conventional FSC curves (blue), gold standard FSC (red) and high-resolution phase randomization tests (green) for PikAIII reconstructions. For conventional FSC calculations (full dataset refinement) we have used the conservative FSC=0.5 criterion as resolution indicator, whereas for gold standard FSC calculations (half dataset independent refinements) we have used the FSC=0.143 criterion, as previously applied58. Consistently, the indicated resolution at FSC=0.5 of the conventional FSC is in close agreement with FSC=0.143 of the gold standard FSC. The FSC calculations with phase randomized data show a sharp drop off at the expected resolution level (10 Å, or 12 Å for holo-PikAIII) and a lack of noise refinement. Additionally, we have measured the FSC between the average map of the two gold standard half maps and the conventional map (full dataset) as implemented by Cheng and colleagues59 (see Extended Data Fig. 10). The agreement between the conventional and the average gold map by this method is also fully consistent with conventional and gold standard FSC calculations. The table inset summarizes the number of projections used for each reconstruction, the conventional and gold standard FSC resolution indications, and the agreement by FSC between the average map of the two gold standard half maps and the conventional map.
Extended Data Figure 5.
Partial mass spectra of active site PikAIII and ACP4-PikAIII/C209A/ΔACP5 peptides from LC/FT-ICR MS of trypsin digested proteins. a–d, ACP5 active site peptides in their apo (a,b) and holo (with phosphopantetheine (Ppant); c,d) states at 2+ and 3+ charge states. Based on integrated peak abundances from multiple LC/MS runs, greater than 97% of the ACP5 Ser1438-containing peptides were modified with Ppant. e–f, Confirmation of the C209A mutation of the KS5 active site. The mutated active site peptide was detected in the 4+ (e) and 3+ (f) charge states. g–i, Example mass spectra of Ser3605-containing active site ACP4-derived peptides following enzymatic loading of the pentaketide from pentaketide-CoA. Both apo (g), holo (with Ppant; h), and pentaketide-ACP4 (i) were detected. j–l, Example mass spectra of active site ACP4-derived peptides from a control experiment in which pentaketide-CoA was absent. The majority of the ACP4 active site peptides were detected in the apo and holo states, while a very small percentage (<1%) contained the pentaketide intermediate. m–p, ACP5 active site peptides following incubation with MM-CoA. The MM building block was detected in high abundance on ACP5 Ser1438 (o,p) with some unloaded holo-protein as well (m,n). q–s, AT5 active site peptides following incubation with MM-CoA. The MM building block was detected on AT Ser655.
Extended Data Figure 6.
PikAIII domain organization and connectivity. a, Crystal structure of excised DEBS module 5 KS-AT di-domain7. KS (blue, yellow active site) and AT (green with red active site) domains interact differently than in the full module (Fig. 2), and the post-AT linker (red) lies on the surface of the KS domain. b, Localization of post-ACP5 dimerization helices. top: Stereo view of holo-PikAIII conformer I with the density ascribed to the post-ACP5 dimerization helices (rendered in cyan) observed between the ACP5 domains (orange). bottom: Overview of localization and enlarged cut-out densities of post-ACP5 dimerization helices (cyan) in holo-PikAIII conformer I. c, Stereo view of holo-PikAIII conformer II with the density ascribed to the post-ACP5 dimerization helices (rendered in cyan) observed between the ACP5 domains (orange). d, Proposed connectivity of domains in PikAIII determined by distances between domain termini and linker lengths. The catalytic domains are colored (green or blue) according to the assigned polypeptide chain. The AT interacts with the KS of the opposite monomer whereas the AT-KR interaction is within the monomer. Active site locations are indicated in yellow.
Extended Data Figure 7.
Domain interfaces in PikAIII. a, Stereo view of the docked crystal structures of KS (blue) and AT (green) in the holo-PikAIII cryo-EM map reveal an extensive interface. The red star marks the side entrance to the KS active site where the catalytic Cys209 (yellow spheres) resides. b, The interface of KS (blue) and AT (green) is less than 20 Å from the KS active site Cys209 (spheres; blue C and yellow S). This is the only region of steric clashes between the KS and AT crystal structures rigidly docked in the 3D maps (KS5 amino acids 350-357 clash with AT5 488-498 and 526-531). Asp352 (spheres; blue C and red O) of the KS and Lys490 and Arg525 (spheres; green C and blue N) of the AT were substituted with Ala in PikAIII-TE. D352A and K490A, which are located in the clash zone, resulted in 0% and 50% activity, respectively, relative to WT PikAIII-TE. The R525A substitution abolished product formation even though this residue is outside the clash zone. The sensitivity of Arg525 and insensitivity of Lys490 to Ala substitution is consistent with a structural rearrangement at the KS-AT interface. c, The docked crystal structures of AT (green) and KR (purple) in the holo-PikAIII cryo-EM map. The interface is formed primarily by a loop of KR (residues 928-936) and an α-helix of AT (residues 760-775). d, The KR domain of PikAIII/ΔACP5 (right) is rotated by 165° compared to holo-PikAIII (left). e, View of the unobstructed path and proximity of Ser1438 (red) and Cys209 (yellow) in the docked structures of KS and ACP in the MM-PikAIII cryo-EM map.
Extended Data Figure 8.
PikAIII functional assays. a, Example HPLC traces of PikAIII-TE assay. The levels of 10-deoxymethynolide (10-dml) produced by wild type PikAIII-TE (red trace), D352A PikAIII-TE (green), K490A PikAIII-TE (blue), R525A PikAIII-TE (orange), and a no enzyme control (yellow) are shown. b, Activity of PikAIII-TE mutants. ND-not detectable. c, Example HPLC traces of PikAIII/PikAIV assay. The levels of 10-deoxymethynolide (10-dml) and narbonolide (nbl) produced by wild type PikAIII/PikAIV (red trace), wild type PikAIII with PikAIV/R147E (green), wild type PikAIII with PikAIV/R320E (blue), and a no enzyme control (yellow) are shown. d, Activity of PikAIV mutants.
Extended Data Figure 9.
Analysis of ACP-less PikAIII. a, Overlay of gel filtration chromatography elution profiles of PikAIII/ΔACP5 (blue) and PikAIII/Δ1403-1562 (red). PikAIII/ΔACP5 includes the post-ACP dimerization helices and elutes as a dimer whereas PikAIII/Δ1403-1562 lacks the dimerization helices and elutes as a monomer. The first peak in the red trace is apparently aggregated protein in the void volume of the S300 column. b, Solid rendering (left) and transparent representation with modeled structures (right) of the cryo-EM map of PikAIII/ΔACP5 at a resolution of 7.8 Å. c, Example HPLC traces of chromophore-CoA loading experiments. The blue trace (280 nm) indicates the level of protein and the red trace (550 nm) indicates the chromophore from CoA 547 (New England Biolabs). Incubation of apo-ACP4-PikAIII/C209A/ΔACP5 with SVP and CoA 547 indicates 100% of the ACP4 was in the apo form, based on molar extinction coefficients for protein and chromophore. d, Incubation of pentaketide-ACP4-PikAIII/C209A/ΔACP5 with SVP and CoA 547 indicates 80% of the ACP4 was loaded with pentaketide. e, Conventional FSC curve for the 3D reconstruction of holo-ACP4/PikAIII/C209A/ΔACP5 (no pentaketide added). f, Orthogonal views of solid rendering (top) and transparent representations with modeled structures (bottom) of the cryo-EM 3D reconstruction of holo-ACP4/PikAIII/C209A/ΔACP5 (no pentaketide added). No density for the upstream ACP4 was observed in the cryo-EM map even though densities corresponding to the N-terminal docking domains are clearly visible (compare with Fig. 3b). Fit into the 3D maps shown in panels b and f are the structures of DEBS module 5 KS (blue, 2HG4), DEBS module 5 AT (green, 2HG4) and DEBS module 1 KR (purple, 2FR0).
Extended Data Figure 10.
Cryo-EM map refinement and resolution validation scheme. The flow chart shows the overall 3D reconstruction scheme and resolution calculation by conventional and gold standard FSC procedures using MM-PikAIII as an example. The procedure was applied for every high resolution 3D reconstruction in this study. Besides the conventional full dataset refinement (left), each dataset was split into two separate half datasets, which were employed for two independent reconstructions using the 50-Å filtered EM map as an initial reference (right; gold standard procedure). The final two gold half reconstructions were compared by FSC, and the indicated resolution by gold standard FSC with the 0.143 criterion58 showed excellent agreement with the value indicated at the 0.5 level of the conventional FSC (Extended Data Fig. 4). In addition, the two gold half maps were averaged, and the resulting average gold map was compared by FSC to the corresponding conventional map, again showing very good agreement at the same resolution range (Extended Data Fig. 4). These tests, along with the phase randomization tests (Extended Data Fig. 4), reveal the lack of over-refinement and accurate resolution values reported in this study.
Acknowledgments
We thank Richard Henderson (LMB-MRC) for sharing the phase-randomization program and for valuable advice on the implementation of the tilt-pair validation, and Yifan Cheng and Xueming Li (UCSF) for sharing the image sub-frame alignment program. This work was supported by the Pew Scholar Program in Biomedical Sciences (G.S.), the University of Michigan Biological Sciences Scholars Program (G.S.), Rackham Merit and American Foundation for Pharmaceutical Education pre-doctoral fellowships (D.A.H.), an NRSA postdoctoral fellowship (J.A.C.), the Life Sciences Research Foundation (A.R.H.N), NIH grants 1R21CA138331-01A1 (K.H.), GM076477 (D.H.S. and J.L.S.) and DK042303 (J.L.S.), and the Hans W. Vahlteich Professorship (to D.H.S.).
Footnotes
Author contributions
S.D. carried out cryo-EM data collection and processing. J.R.W. produced PikAIII variants and conducted enzyme assays. G.R.C. assisted with cryo-EM image processing. W.A.H, A.R.N. and K.H. carried out mass-spectrometry analysis. D.A.H. synthesized the thiophenol pentaketide and pentaketide-CoA substrates. J.A.C. produced initial PikAIII samples and prepared Fig. 1. S.D., J.R.W., J.L.S. and G.S. analyzed the data and interpreted results. D.H.S., J.L.S. and G.S. designed research. S.D., J.R.W., D.H.S., J.L.S. and G.S. wrote the manuscript.
Supporting information
The cryo-EM maps have been deposited in the Electron Microscopy Data Bank (EMDB) with accession codes EMD-5647 (holo-PikAIII conformation I), -5648 (holo-PikAIII conformation II), -5649 (PikAIII/ΔACP5), -5651 (Pentaketide-ACP4-PikAIII/C209A/ΔACP5), -5653 (MM-PikAIII), and -5662 (holo-ACP4-PikAIII/C209A/ΔACP5).
References
- 1.Newman DJ, Cragg GM. Natural products as sources of new drugs over the 30 years from 1981 to 2010. J Nat Prod. 2012;75:311–335. doi: 10.1021/np200906s. [DOI] [PMC free article] [PubMed] [Google Scholar]
- 2.Fischbach MA, Walsh CT. Assembly-line enzymology for polyketide and nonribosomal Peptide antibiotics: logic, machinery, and mechanisms. Chem Rev. 2006;106:3468–3496. doi: 10.1021/cr0503097. [DOI] [PubMed] [Google Scholar]
- 3.Smith S, Tsai SC. The type I fatty acid and polyketide synthases: a tale of two megasynthases. Nat Prod Rep. 2007;24:1041–1072. doi: 10.1039/b603600g. [DOI] [PMC free article] [PubMed] [Google Scholar]
- 4.Broadhurst RW, Nietlispach D, Wheatcroft MP, Leadlay PF, Weissman KJ. The structure of docking domains in modular polyketide synthases. Chem Biol. 2003;10:723–731. doi: 10.1016/s1074-5521(03)00156-x. [DOI] [PubMed] [Google Scholar]
- 5.Buchholz TJ, Geders TW, Bartley FE, 3rd, Reynolds KA, Smith JL, Sherman DH. Structural basis for binding specificity between subclasses of modular polyketide synthase docking domains. ACS Chem Biol. 2009;4:41–52. doi: 10.1021/cb8002607. [DOI] [PMC free article] [PubMed] [Google Scholar]
- 6.Tang Y, Chen AY, Kim CY, Cane DE, Khosla C. Structural and mechanistic analysis of protein interactions in module 3 of the 6-deoxyerythronolide B synthase. Chem Biol. 2007;14:931–943. doi: 10.1016/j.chembiol.2007.07.012. [DOI] [PMC free article] [PubMed] [Google Scholar]
- 7.Tang Y, Kim CY, Mathews II, Cane DE, Khosla C. The 2.7-Å crystal structure of a 194-kDa homodimeric fragment of the 6-deoxyerythronolide B synthase. Proc Natl Acad Sci U S A. 2006;103:11124–11129. doi: 10.1073/pnas.0601924103. [DOI] [PMC free article] [PubMed] [Google Scholar]
- 8.Zheng J, Keatinge-Clay AT. Structural and functional analysis of C2-type ketoreductases from modular polyketide synthases. J Mol Biol. 2011;410:105–117. doi: 10.1016/j.jmb.2011.04.065. [DOI] [PubMed] [Google Scholar]
- 9.Zheng J, Taylor CA, Piasecki SK, Keatinge-Clay AT. Structural and functional analysis of A-type ketoreductases from the amphotericin modular polyketide synthase. Structure. 2010;18:913–922. doi: 10.1016/j.str.2010.04.015. [DOI] [PubMed] [Google Scholar]
- 10.Keatinge-Clay AT. A tylosin ketoreductase reveals how chirality is determined in polyketides. Chem Biol. 2007;14:898–908. doi: 10.1016/j.chembiol.2007.07.009. [DOI] [PubMed] [Google Scholar]
- 11.Keatinge-Clay AT, Stroud RM. The structure of a ketoreductase determines the organization of the beta-carbon processing enzymes of modular polyketide synthases. Structure. 2006;14:737–748. doi: 10.1016/j.str.2006.01.009. [DOI] [PubMed] [Google Scholar]
- 12.Keatinge-Clay A. Crystal structure of the erythromycin polyketide synthase dehydratase. J Mol Biol. 2008;384:941–953. doi: 10.1016/j.jmb.2008.09.084. [DOI] [PMC free article] [PubMed] [Google Scholar]
- 13.Akey DL, Razelun JR, Tehranisa J, Sherman DH, Gerwick WH, Smith JL. Crystal structures of dehydratase domains from the curacin polyketide biosynthetic pathway. Structure. 2010;18:94–105. doi: 10.1016/j.str.2009.10.018. [DOI] [PMC free article] [PubMed] [Google Scholar]
- 14.Zheng J, Gay DC, Demeler B, White MA, Keatinge-Clay AT. Divergence of multimodular polyketide synthases revealed by a didomain structure. Nat Chem Biol. 2012 doi: 10.1038/nchembio.964. [DOI] [PMC free article] [PubMed] [Google Scholar]
- 15.Gehret JJ, Gu L, Gerwick WH, Wipf P, Sherman DH, Smith JL. Terminal alkene formation by the thioesterase of curacin A biosynthesis: structure of a decarboxylating thioesterase. J Biol Chem. 2011;286:14445–14454. doi: 10.1074/jbc.M110.214635. [DOI] [PMC free article] [PubMed] [Google Scholar]
- 16.Scaglione JB, Akey DL, Sullivan R, Kittendorf JD, Rath CM, Kim ES, Smith JL, Sherman DH. Biochemical and structural characterization of the tautomycetin thioesterase: analysis of a stereoselective polyketide hydrolase. Angew Chem Int Ed Engl. 2010;49:5726–5730. doi: 10.1002/anie.201000032. [DOI] [PMC free article] [PubMed] [Google Scholar]
- 17.Tsai SC, Lu H, Cane DE, Khosla C, Stroud RM. Insights into channel architecture and substrate specificity from crystal structures of two macrocycle-forming thioesterases of modular polyketide synthases. Biochemistry. 2002;41:12598–12606. doi: 10.1021/bi0260177. [DOI] [PubMed] [Google Scholar]
- 18.Tsai SC, Miercke LJ, Krucinski J, Gokhale R, Chen JC, Foster PG, Cane DE, Khosla C, Stroud RM. Crystal structure of the macrocycle-forming thioesterase domain of the erythromycin polyketide synthase: versatility from a unique substrate channel. Proc Natl Acad Sci U S A. 2001;98:14808–14813. doi: 10.1073/pnas.011399198. [DOI] [PMC free article] [PubMed] [Google Scholar]
- 19.Bonnett SA, Whicher JR, Papireddy K, Florova G, Smith JL, Reynolds KA. Structural and stereochemical analysis of a modular polyketide synthase ketoreductase domain required for the generation of a cis-alkene. Chem Biol. 2013;20:772–783. doi: 10.1016/j.chembiol.2013.04.014. [DOI] [PMC free article] [PubMed] [Google Scholar]
- 20.Alekseyev VY, Liu CW, Cane DE, Puglisi JD, Khosla C. Solution structure and proposed domain domain recognition interface of an acyl carrier protein domain from a modular polyketide synthase. Protein Sci. 2007;16:2093–2107. doi: 10.1110/ps.073011407. [DOI] [PMC free article] [PubMed] [Google Scholar]
- 21.Whicher JR, Smaga SS, Hansen DA, Brown WC, Gerwick WH, Sherman DH, Smith JL. Cyanobacterial polyketide synthase docking domains a new tool for engineering natural product biosynthesis. Chem Biol. 2013;20:1340–1351. doi: 10.1016/j.chembiol.2013.09.015. [DOI] [PMC free article] [PubMed] [Google Scholar]
- 22.Maier T, Leibundgut M, Ban N. The crystal structure of a mammalian fatty acid synthase. Science. 2008;321:1315–1322. doi: 10.1126/science.1161269. [DOI] [PubMed] [Google Scholar]
- 23.Xue Y, Zhao L, Liu HW, Sherman DH. A gene cluster for macrolide antibiotic biosynthesis in Streptomyces venezuelae: architecture of metabolic diversity. Proc Natl Acad Sci U S A. 1998;95:12111–12116. doi: 10.1073/pnas.95.21.12111. [DOI] [PMC free article] [PubMed] [Google Scholar]
- 24.Aldrich CC, Beck BJ, Fecik RA, Sherman DH. Biochemical investigation of pikromycin biosynthesis employing native penta- and hexaketide chain elongation intermediates. J Am Chem Soc. 2005;127:8441–8452. doi: 10.1021/ja042592h. [DOI] [PubMed] [Google Scholar]
- 25.Aldrich CC, Venkatraman L, Sherman DH, Fecik RA. Chemoenzymatic synthesis of the polyketide macrolactone 10-deoxymethynolide. J Am Chem Soc. 2005;127:8910–8911. doi: 10.1021/ja0504340. [DOI] [PubMed] [Google Scholar]
- 26.Lyon AM, Dutta S, Boguth CA, Skiniotis G, Tesmer JJ. Full-length Gα(q)-phospholipase C-β3 structure reveals interfaces of the C-terminal coiled-coil domain. Nat Struct Mol Biol. 2013;20:355–362. doi: 10.1038/nsmb.2497. [DOI] [PMC free article] [PubMed] [Google Scholar]
- 27.Strunk BS, Loucks CR, Su M, Vashisth H, Cheng S, Schilling J, Brooks CL, 3rd, Karbstein K, Skiniotis G. Ribosome assembly factors prevent premature translation initiation by 40S assembly intermediates. Science. 2011;333:1449–1453. doi: 10.1126/science.1208245. [DOI] [PMC free article] [PubMed] [Google Scholar]
- 28.Staunton J, Caffrey P, Aparicio JF, Roberts GA, Bethell SS, Leadlay PF. Evidence for a double-helical structure for modular polyketide synthases. Nat Struct Biol. 1996;3:188–192. doi: 10.1038/nsb0296-188. [DOI] [PubMed] [Google Scholar]
- 29.Kao CM, Pieper R, Cane DE, Khosla C. Evidence for two catalytically independent clusters of active sites in a functional modular polyketide synthase. Biochemistry. 1996;35:12363–12368. doi: 10.1021/bi9616312. [DOI] [PubMed] [Google Scholar]
- 30.Gokhale RS, Lau J, Cane DE, Khosla C. Functional orientation of the acyltransferase domain in a module of the erythromycin polyketide synthase. Biochemistry. 1998;37:2524–2528. doi: 10.1021/bi971887n. [DOI] [PubMed] [Google Scholar]
- 31.Yin Y, Lu H, Khosla C, Cane DE. Expression and kinetic analysis of the substrate specificity of modules 5 and 6 of the picromycin/methymycin polyketide synthase. J Am Chem Soc. 2003;125:5671–5676. doi: 10.1021/ja034574q. [DOI] [PubMed] [Google Scholar]
- 32.Yuzawa S, Kapur S, Cane DE, Khosla C. Role of a conserved arginine residue in linkers between the ketosynthase and acyltransferase domains of multimodular polyketide synthases. Biochemistry. 2012;51:3708–3710. doi: 10.1021/bi300399u. [DOI] [PMC free article] [PubMed] [Google Scholar]
- 33.Kittendorf JD, Beck BJ, Buchholz TJ, Seufert W, Sherman DH. Interrogating the molecular basis for multiple macrolactone ring formation by the pikromycin polyketide synthase. Chem Biol. 2007;14:944–954. doi: 10.1016/j.chembiol.2007.07.013. [DOI] [PMC free article] [PubMed] [Google Scholar]
- 34.Kapur S, Chen AY, Cane DE, Khosla C. Molecular recognition between ketosynthase and acyl carrier protein domains of the 6-deoxyerythronolide B synthase. Proc Natl Acad Sci U S A. 2010;107:22066–22071. doi: 10.1073/pnas.1014081107. [DOI] [PMC free article] [PubMed] [Google Scholar]
- 35.Kapur S, Lowry B, Yuzawa S, Kenthirapalan S, Chen AY, Cane DE, Khosla C. Reprogramming a module of the 6-deoxyerythronolide B synthase for iterative chain elongation. Proc Natl Acad Sci U S A. 2012;109:4110–4115. doi: 10.1073/pnas.1118734109. [DOI] [PMC free article] [PubMed] [Google Scholar]
- 36.Bonnett SA, Rath CM, Shareef AR, Joels JR, Chemler JA, Håkansson K, Reynolds K, Sherman DH. Acyl-CoA subunit selectivity in the pikromycin polyketide synthase PikAIV: steady-state kinetics and active-site occupancy analysis by FTICR-MS. Chemistry & biology. 2011;18:1075–1081. doi: 10.1016/j.chembiol.2011.07.016. [DOI] [PMC free article] [PubMed] [Google Scholar]
- 37.Huang W, Jia J, Edwards P, Dehesh K, Schneider G, Lindqvist Y. Crystal structure of beta-ketoacyl-acyl carrier protein synthase II from E. coli reveals the molecular architecture of condensing enzymes. Embo J. 1998;17:1183–1191. doi: 10.1093/emboj/17.5.1183. [DOI] [PMC free article] [PubMed] [Google Scholar]
- 38.Chemler JA, Buchholz TJ, Geders TW, Akey DL, Rath CM, Chlipala GE, Smith JL, Sherman DH. Biochemical and structural characterization of germicidin synthase: analysis of a type III polyketide synthase that employs acyl-ACP as a starter unit donor. J Am Chem Soc. 2012;134:7359–7366. doi: 10.1021/ja2112228. [DOI] [PMC free article] [PubMed] [Google Scholar]
- 39.Keatinge-Clay AT, Maltby DA, Medzihradszky KF, Khosla C, Stroud RM. An antibiotic factory caught in action. Nat Struct Biol. 2004;11:888–893. doi: 10.1038/nsmb808. [DOI] [PubMed] [Google Scholar]
- 40.Ferrer JL, Jez JM, Bowman ME, Dixon RA, Noel JP. Structure of chalcone synthase and the molecular basis of plant polyketide biosynthesis. Nat Struct Biol. 1999;6:775–784. doi: 10.1038/11553. [DOI] [PubMed] [Google Scholar]
- 41.Leibundgut M, Jenni S, Frick C, Ban N. Structural basis for substrate delivery by acyl carrier protein in the yeast fatty acid synthase. Science. 2007;316:288–290. doi: 10.1126/science.1138249. [DOI] [PubMed] [Google Scholar]
- 42.Beck BJ, Yoon YJ, Reynolds KA, Sherman DH. The hidden steps of domain skipping: macrolactone ring size determination in the pikromycin modular polyketide synthase. Chem Biol. 2002;9:575–583. doi: 10.1016/s1074-5521(02)00146-1. [DOI] [PubMed] [Google Scholar]
- 43.Rowe CJ, Bohm IU, Thomas IP, Wilkinson B, Rudd BA, Foster G, Blackaby AP, Sidebottom PJ, Roddis Y, Buss AD, Staunton J, Leadlay PF. Engineering a polyketide with a longer chain by insertion of an extra module into the erythromycin-producing polyketide synthase. Chem Biol. 2001;8:475–485. doi: 10.1016/s1074-5521(01)00024-2. [DOI] [PubMed] [Google Scholar]
- 44.Zheng J, Fage CD, Demeler B, Hoffman DW, Keatinge-Clay AT. The missing linker: A dimerization motif located within polyketide synthase modules. ACS Chem Biol. 2013 doi: 10.1021/cb400047s. [DOI] [PMC free article] [PubMed] [Google Scholar]
- 45.Bunkoczi G, Pasta S, Joshi A, Wu X, Kavanagh KL, Smith S, Oppermann U. Mechanism and substrate recognition of human holo ACP synthase. Chem Biol. 2007;14:1243–1253. doi: 10.1016/j.chembiol.2007.10.013. [DOI] [PMC free article] [PubMed] [Google Scholar]
- 46.Masoudi A, Raetz CR, Zhou P, Pemble CWt. Chasing acyl carrier protein through a catalytic cycle of lipid A production. Nature. 2014;505:422–426. doi: 10.1038/nature12679. [DOI] [PMC free article] [PubMed] [Google Scholar]
- 47.Nguyen C, Haushalter RW, Lee DJ, Markwick PR, Bruegger J, Caldara-Festin G, Finzel K, Jackson DR, Ishikawa F, O’Dowd B, McCammon JA, Opella SJ, Tsai SC, Burkart MD. Trapping the dynamic acyl carrier protein in fatty acid biosynthesis. Nature. 2014;505:427–431. doi: 10.1038/nature12810. [DOI] [PMC free article] [PubMed] [Google Scholar]
- 48.Wu N, Tsuji SY, Cane DE, Khosla C. Assessing the balance between protein-protein interactions and enzyme-substrate interactions in the channeling of intermediates between polyketide synthase modules. J Am Chem Soc. 2001;123:6465–6474. doi: 10.1021/ja010219t. [DOI] [PubMed] [Google Scholar]
- 49.Beck BJ, Aldrich CC, Fecik RA, Reynolds KA, Sherman DH. Iterative chain elongation by a pikromycin monomodular polyketide synthase. J Am Chem Soc. 2003;125:4682–4683. doi: 10.1021/ja029974c. [DOI] [PubMed] [Google Scholar]
- 50.Pfeifer BA, Admiraal SJ, Gramajo H, Cane DE, Khosla C. Biosynthesis of complex polyketides in a metabolically engineered strain of E. coli. Science. 2001;291:1790–1792. doi: 10.1126/science.1058092. [DOI] [PubMed] [Google Scholar]
- 51.Sanchez C, Du L, Edwards DJ, Toney MD, Shen B. Cloning and characterization of a phosphopantetheinyl transferase from Streptomyces verticillus ATCC15003, the producer of the hybrid peptide-polyketide antitumor drug bleomycin. Chemistry & biology. 2001;8:725–738. doi: 10.1016/s1074-5521(01)00047-3. [DOI] [PubMed] [Google Scholar]
- 52.Ohi M, Li Y, Cheng Y, Walz T. Negative staining and image classification - powerful tools in modern electron microscopy. Biol Proced Online. 2004;6:23–34. doi: 10.1251/bpo70. [DOI] [PMC free article] [PubMed] [Google Scholar]
- 53.Ludtke SJ, Baldwin PR, Chiu W. EMAN: semiautomated software for high-resolution single-particle reconstructions. J Struct Biol. 1999;128:82–97. doi: 10.1006/jsbi.1999.4174. [DOI] [PubMed] [Google Scholar]
- 54.Tang G, Peng L, Baldwin PR, Mann DS, Jiang W, Rees I, Ludtke SJ. EMAN2: an extensible image processing suite for electron microscopy. J Struct Biol. 2007;157:38–46. doi: 10.1016/j.jsb.2006.05.009. [DOI] [PubMed] [Google Scholar]
- 55.Baker ML, Zhang J, Ludtke SJ, Chiu W. Cryo-EM of macromolecular assemblies at near-atomic resolution. Nat Protoc. 2010;5:1697–1708. doi: 10.1038/nprot.2010.126. [DOI] [PMC free article] [PubMed] [Google Scholar]
- 56.Rosenthal PB, Henderson R. Optimal determination of particle orientation, absolute hand, and contrast loss in single-particle electron cryomicroscopy. J Mol Biol. 2003;333:721–745. doi: 10.1016/j.jmb.2003.07.013. [DOI] [PubMed] [Google Scholar]
- 57.Fernandez JJ, Luque D, Caston JR, Carrascosa JL. Sharpening high resolution information in single particle electron cryomicroscopy. J Struct Biol. 2008;164:170–175. doi: 10.1016/j.jsb.2008.05.010. [DOI] [PubMed] [Google Scholar]
- 58.Scheres SH, Chen S. Prevention of overfitting in cryo-EM structure determination. Nat Methods. 2012;9:853–854. doi: 10.1038/nmeth.2115. [DOI] [PMC free article] [PubMed] [Google Scholar]
- 59.Li X, Mooney P, Zheng S, Booth CR, Braunfeld MB, Gubbens S, Agard DA, Cheng Y. Electron counting and beam-induced motion correction enable near-atomic-resolution single-particle cryo-EM. Nat Methods. 2013;10:584–590. doi: 10.1038/nmeth.2472. [DOI] [PMC free article] [PubMed] [Google Scholar]
- 60.Chen S, McMullan G, Faruqi AR, Murshudov GN, Short JM, Scheres SH, Henderson R. High-resolution noise substitution to measure overfitting and validate resolution in 3D structure determination by single particle electron cryomicroscopy. Ultramicroscopy. 2013;135:24–35. doi: 10.1016/j.ultramic.2013.06.004. [DOI] [PMC free article] [PubMed] [Google Scholar]
- 61.Henderson R, Chen S, Chen JZ, Grigorieff N, Passmore LA, Ciccarelli L, Rubinstein JL, Crowther RA, Stewart PL, Rosenthal PB. Tilt-pair analysis of images from a range of different specimens in single-particle electron cryomicroscopy. J Mol Biol. 2011;413:1028–1046. doi: 10.1016/j.jmb.2011.09.008. [DOI] [PMC free article] [PubMed] [Google Scholar]
- 62.Murray SC, Flanagan J, Popova OB, Chiu W, Ludtke SJ, Serysheva Validation of cryo-EM structure of IP(3)R1 channel. Structure. 2013;21:900–909. doi: 10.1016/j.str.2013.04.016. [DOI] [PMC free article] [PubMed] [Google Scholar]
- 63.Pettersen EF, Goddard TD, Huang CC, Couch GS, Greenblatt DM, Meng EC, Ferrin TE. UCSF Chimera--a visualization system for exploratory research and analysis. J Comput Chem. 2004;25:1605–1612. doi: 10.1002/jcc.20084. [DOI] [PubMed] [Google Scholar]
- 64.Hansen DA, Rath CM, Eisman EB, Narayan AR, Kittendorf JD, Mortison JD, Yoon YJ, Sherman DH. Biocatalytic synthesis of pikromycin, methymycin, neomethymycin, novamethymycin, and ketomethymycin. J Am Chem Soc. 2013;135:11232–11238. doi: 10.1021/ja404134f. [DOI] [PMC free article] [PubMed] [Google Scholar]


