

Abstract
Manganese (Mn) is an essential trace element, but excess exposure leads to accumulation in biological tissues, including the brain. Chronically high Mn levels in the brain are neurotoxic and can result in a progressive, irreversible neurological disorder known as manganism. Manganism has signs and symptoms similar to, but distinguishable from idiopathic Parkinson’s disease, which include both psychological and motor disturbances. Evidence suggests that Mn exposure impacts neurotransmitter levels in the brain. However, it remains unclear if subacute, low-level Mn exposure resulted in alterations in neurotransmitter systems with concomitant behavioral deficits. The current study used high performance liquid chromatography to quantify neurotransmitter levels in rat striatum (STR), substantia nigra (SN), and hippocampus (HP). Subacute Mn exposure via i.p. injection of 15 mg Mn/kg as MnCl2 caused significantly increased dopamine (DA) levels in the STR. The enhancement was accompanied by significantly elevated levels of the DA metabolites, 3,4-dihydroxyphenylacetic acid (DOPAC) and homovanillic acid (HVA), in the STR. In addition, levels of HVA were significantly increased in the SN and HP. These data indicate that subacute, low-level Mn exposure disrupts multiple neurotransmitter systems in the rat brain which may be responsible, in part, for observed locomotor deficits.
Keywords: Manganese, Neurobehavior, Dopamine, Serotonin, GABA, Striatum, Manganism
1. Introduction
Manganese (Mn) is an essential trace element required for normal function and development of many physiological processes. In the central nervous system, Mn functions as a cofactor for enzymes necessary for neuronal function and neurotransmitter biosynthesis, such as superoxide dismutase 2, pyruvate decarboxylase, and glutamine synthetase (Aschner et al., 2009; Bowman et al., 2011; Schneider et al., 2009). Normally, regulatory mechanisms carefully maintain homeostatic levels of Mn in the body by controlling absorption and elimination of excess metal via hepatobiliary excretion (Klaassen, 1976). However, excess Mn exposure can overload these mechanisms (Schneider et al., 2009), leading to Mn accumulation in body tissues, including bone, liver, kidney, and pancreas (Dobson et al., 2004). Mn in the 2+ and 3+ states readily crosses the BBB (Aschner et al., 1999) and preferentially accumulates in specific brain regions, such as striatum (STR), globus pallidus (GP), cerebellum, and hippocampus (HP) (Andersen et al., 2010; Fitsanakis et al., 2008).
Adequate levels of Mn are obtained from food, such as nuts, tea, and legumes, and water intake (Bowman et al., 2011). Mn dusts in the air, Mn-containing pesticides in soil, contaminated water, and occupational exposure during mining and agricultural processes, are potential sources of toxic exposure (Mergler, 1999). The highest levels of exposure are observed in the workplace, where workers chronically exposed to levels < 5mg/m3 have reported neurological symptoms of Mn toxicity (Crossgrove & Zheng, 2004). These symptoms result from toxic Mn accumulation in the caudate putamen, GP, STR, and substantia nigra (SN) (Aschner et al., 1999) and are clinically diagnosed as manganese intoxication or manganism. Manganism is a severe, progressive and largely irreversible disorder that resembles, but is distinguishable from idiopathic Parkinson’s disease (PD) and other extrapyramidal motor disorders (Bowman et al., 2011).
The prevailing symptoms of manganism include poor hand-eye coordination, bradykinesia, changes in mood and memory deficits, abnormal gait, muscle and joint pain or weakness, bent posture, and a kinetic tremor (Bowman et al., 2011; Mergler, 1999). These symptoms exist as a slowly progressing biphasic continuum, with psychiatric symptoms appearing first in the “prodromal period” or early phase of the disease, while motor symptoms dominate the later, “established” phase (Bowman et al., 2011; Rodier, 1955) and persist even after the person is no longer exposed to Mn (Aschner et al., 2009; McMillian, 1999).
Mn accumulation in the basal ganglia may alter levels of neurotransmitters, such as dopamine (DA) and γ-aminobutyric acid (GABA), in the STR and in pathways postsynaptic to the nigrostriatal system (Bowman et al., 2011; McMillian, 1999) which produce the observed motor symptoms. Data from rodent studies generally offer conflicting reports on how Mn exposure affects neurochemistry and motor function. A general consensus regarding the effects of Mn on motor function is that hyperactivity is observed early in Mn toxicity in the young or after low cumulative doses, in both human and animal studies (Bouchard et al., 2007; Nachtman et al., 1986), and as the disease progresses and cumulative dose levels increase, patients and animals both tend to become hypoactive (Oszlanczi et al., 2010; Torrente et al., 2005).
It has been difficult to determine if a relationship exists between altered neurotransmitter levels and motor deficits after Mn treatment. The problem arises from the fact that behavioral changes can be observed in rodents at low levels (1–10 mg/kg) while changes in neurochemistry tend to be studied after exposure to higher levels (>10 mg/kg) (Gwiazda et al., 2007).
There is evidence that Mn exposure is associated with parkinsonism. While links between Mn and PD remain controversial, alterations in dopamine levels and dopamine signaling, mitochondrial dysfunction, and oxidative stress have all been observed in both diseases (Aschner et al., 2007). However, dopaminergic neurons in the SN and their terminals in the STR, which are selectively lesioned in PD, remain intact after Mn intoxication (Guilarte, 2010). Thus, changes in neurotransmission, as opposed to frank cell-loss, likely underlie behavioral observations. Most studies to date have focused on striatal DA levels and not regional differences in other monoamines and their metabolites, or GABA. Additionally, few studies have aimed to investigate changes in motor function in animals, particularly rodents, despite many of the prominent symptoms of manganism being motor deficits, including abnormal gait and postural impairment. Therefore, the present study was undertaken to identify alterations in multiple neurotransmitter systems resulting from subacute, low-level Mn exposure in rats. We have previously used a Mn exposure dose regimen, i.e., 6 mg/kg i.p. injection for 4–6 weeks to study Mn toxicity on iron (Fe) and copper (Cu) transport properties in brain barrier systems (Zheng et al., 1999; Zheng et al., 2009).
To ensure a dose-related response, the current study used two dose levels, 6 mg/kg and 15 mg/kg, which bracket the commonly used doses to investigate changes in Mn levels with concomitant changes in regional neurochemistry, motor function, and changes at the cellular level. The cumulative doses used in this study (120 mg/kg and 300 mg/kg) are considered to be low in relation to other estimated cumulative doses (range 72- more than 100,000 mg/kg) administered in rodent studies reviewed by Newland (1999). Only one study by Bonilla (1980) utilized a lower cumulative dose. The next lowest dose was used by Autissier et al. (1982) and the cumulative dose was higher than both used in the current study. Neurotransmitter levels were assessed in the STR, SN, and HP, an area implicated in learning and memory. It was necessary to study the HP because many of the earliest symptoms of manganism are due to impaired memory. Thus, examination of changes in 4 neurotransmitter (DA, NE, 5-HT, GABA) systems in multiple brain regions was expected to provide significant data on the complex neurochemical changes that result from Mn intoxication.
2. Materials & methods
2.1 Chemicals
All chemicals were of analytical grade, HPLC grade or the highest available pharmaceutical grade. HPLC grade water was obtained from a NANOpure Diamond Ultrapure Water System (Barnstead International, Dubuque, IA); Mn chloride tetrahydrate (MnCl2·4H2O) from Fisher Chemical (Fair Lawn, NJ); nitric acid, tripotassium phosphate (K3PO4) and DPX mountant from VWR International (Radnor or West Chester, PA); Mn, Cu, Zn, and Fe stock solutions from SCP Science (Champlain, NY); perchloric acid from RICCA (Arlington, TX); dopamine (DA), 3,4-dihydroxyphenylacetic acid (DOPAC), homovanillic acid (HVA), 5-hydroxytryptamine (5-HT), 5-hydroxyindolacetic acid (5-HIAA), noradrenaline (NE), γ-aminobutyric acid (GABA) standards, disodium hydrogen phosphate, anhydrous (Na2HPO4) triethylamine (TEA), octanesulfonicacid (OSA), acetonitrile, paraformaldehyde (PFA), sodium phosphate monobasic (NaH2PO4), Triton X-100, and porcine skin gelatin from Sigma (St. Louis, MO). Bovine serum albumin (BSA) was purchased from Thermo Scientific (Rockford, IL); methanol, ethylenediaminetetraacetic acid (EDTA), and sucrose from Macron Fine Chemicals (Center Valley, PA); o-phthalaldehyde (OPA) from Pickering Laboratories (Mountain View, CA); and BCA protein assay kit from Bio-Rad (Hercules, CA). Normal donkey serum was purchased from Jackson ImmunoResearch (West Grove, PA); mouse monoclonal anti-TH and rabbit polyclonal anti-DARPP-32 antibodies from Millipore (Temecula, CA); secondary donkey anti-mouse IR800 and donkey anti-rabbit IR800 antibodies from LICOR (Lincoln, NE); histoclear from National Diagnostics (Atlanta, GA); potassium permanganate from Amresco (Solon, OH); fluoro-jade C from Histochem (Jefferson, AR); and glacial acetic acid from Mallinckrodt Chemicals (Phillipsburg, NJ).
2.2 Animals
Male Sprague Dawley rats were obtained from Harlan Laboratories, Inc. (Indianapolis, IN) and allowed to acclimate to the holding room for 7 days after arrival. Rats were 8 weeks of age and weighed approximately 240–260g at study initiation. Animals were randomized by drawing numbers for treatment designation. Sample size was n = 5 for all experiments unless otherwise noted. Rats were group housed in a temperature- (22 ± 2 °C) and humidity- (30–70%) controlled room on a 12 hour light/dark cycle (lights on at 0600). Rats had ad libitum access to food (Harlan Teklad 2018 rodent diet) and reverse osmosis water.
All animal studies were approved by the Institutional Animal Care and Use Committee at Purdue University.
2.3 Mn administration and experimental design
Stock solutions of 6 mg Mn/ml (low dose) and 15 mg Mn/ml (high dose) were prepared by dissolving MnCl2·4H2O in saline and passing through a 0.2 μm syringe filter. Mn-exposed rats received ip injections equivalent to either 6 or 15 mg Mn/kg in a volume of 1 ml/kg once per day, 5 days per week, for 4 consecutive weeks. Control animals received the same volume of sterile saline.
2.4 Sample collection
Animals were euthanized by decapitation 24 h after the last dose. Brains were quickly removed from the skull and bisected midsagittally. The left hemispheres were stored in 4% paraformaldehyde for histological evaluation. The right hemispheres reserved for neurochemistry were placed in a coronal rat brain matrix and 2 mm slices containing the desired brain regions were obtained. The samples were then further dissected on ice to obtain STR, SN, and hippocampal samples, which were then flash-frozen in liquid nitrogen. Samples were stored at −80°C until processing.
2.5 Behavioral testing
On days 8, 11, and 18 of dosing, animal’s exploratory behavior was evaluated for distance and average velocity traveled using an open field test. The testing room was maintained at the same temperature and humidity as the holding room, but the lighting conditions in the testing room were dimmer, an average of 322 lux. Animals were transferred to the behavioral testing room and allowed to acclimate for at least 30 minutes before testing began. Behavioral testing conditions were simulated on two separate occasions during the first week of dosing to acclimate the animals to the testing environment. Open field chambers were constructed of solid opaque Plexiglas measuring 40 cm × 40 cm. Simultaneously, 3–4 animals could be tested in adjoining chambers. Behavioral analysis was completely automated, and the computer software Top Scan Lite (version 2.0; Clever Sys Inc. Copyright 2000–2011) was used to generate a model of the open field chambers with accurate perimeter measurements and center fields comprising 60% of the total area. Animals’ positions were recorded by a ceiling-mounted camera for 5 minutes. Animals’ average velocities and distances traveled during the experiment were quantified using the Top Scan Lite software.
2.6 Atomic absorption spectrophotometric analysis
STR and HP samples collected at necropsy were weighed and transferred to a digestion vial. A total volume of 1mL nitric acid was added to each sample. Tissues were digested in a high pressure MarsXpress microwave (CEM Corporation, Matthews, NC) for 15 minutes at 200°C. Each digestion was transferred to a volumetric flask and diluted with ddiH2O to 5mL. Each digestion solution was mixed thoroughly. Mn concentrations were quantified by atomic absorption spectroscopy (AAS) using an Agilent Technologies 200 Series SpectrAA with GTA 120 graphite furnace (Santa Clara, CA). Concentration range of the standard solution was between 1–10 ppb. A 0.1% nitric acid blank was prepared and used to dilute the metal standard from 1000 ppm to the appropriate working concentration of 10 ppb. Samples were further diluted with ddiH2O to obtain readings within the concentration range of the standard curve. The detection limit for Mn was 0.038 μg/L of the assay solution. Metal content was expressed as μg/g of tissue.
2.7 Neurochemical analysis
Neurotransmitter analysis was conducted similarly as previously described (Wang et al., 2014). Briefly, STR, SN, and HP samples were frozen in liquid nitrogen at necropsy and stored at −80°C until processing. Samples were sonicated in 0.5 ml 0.4N perchloric acid (HClO4) on ice, at 40% power, pulsing for 45 s to precipitate proteins. Samples were then centrifuged at 16,400 g for 35 min at 4°C. Supernatant was transferred to 0.22 μm Spin-X tube with nylon filter (Corning, Corning, NY) and centrifuged at 1000 g for 15 min at 4°C. Samples were then stored at −80°C until HPLC analysis. A Dionex UltiMate 3000 (Thermo Scientific; Germering, Germany) system with a built in autosampler and a Coulochem III (Thermo Scientific) electrochemical detector were used for HPLC analysis of DA, its metabolites DOPAC and HVA, as well as 5-HT and its metabolite 5-HIAA, NE, and GABA. The optimized method used an isocratic monoamine mobile phase (consisting of 0.08 M NaH2PO4, 10% methanol, 2% acetonitrile, 2.0 mM OSA, 0.025 mM EDTA, and 0.2 mM TEA, in 13 mΩ purified water, pH 2.4). Samples were injected and monoamines separated on a reverse phase C18 column (150 × 3.2mm, 3.0 μm particle size, MD-150, Thermo Scientific, Bannockburn, IL). Separation occurred at 32 °C at a flow rate of 0.6 ml/min. For GABA detection, samples were derivatized with OPA (o-phthalaldehyde, methanol, and 2-mercaptoethanol) before injection onto the column (Cannon et al., 2006). The isocratic mobile phase (pH 6.75) consisted of Na2HPO4 in 13 mΩ purified water with 22% methanol and 3.5% acetonitrile. Separation occurred at 35°C with a flow rate of 0.5 ml/min. For monoamine neurotransmitter and metabolite detection, the electrochemical potential of the detector was set at 250 mV, with a conditioning cell at −150 mV. For GABA detection, the electrochemical potential of the detector was set at 550 mV, with a conditioning cell at −150 mV. Neurotransmitter and metabolite levels in each sample were quantified by comparing sample values to a reference curve prepared by adding standards of a known concentration to perchloric acid. Chromeleon 7.0 software was used for data acquisition and analysis. Neurotransmitter concentrations were expressed as ng/mg of protein as assessed by BCA protein assay (Smith et al., 1985) using BSA as the standard (Bradford, 1976).
2.8 Immunohistochemistry
At necropsy, the left hemisphere was immersed in 4% paraformaldehyde (PFA, catalog # P6148-500G; Sigma, St. Louis, MO) and post-fixed for 7 days at 4°C. Then, hemispheres were stored in a 30% (w/v) sucrose (catalog # 8360-06; Macron Fine Chemicals, Center Valley, PA) solution until sinking. The hemispheres were coronally sectioned in 30μm increments on a microtome (Microm HM450, Thermo Scientific; Walldorf, Germany) and sections were placed in cryoprotectant solution and stored at −20°C until labeling. Free-floating slices were rinsed 6 times with phosphate buffered saline (PBS), 10 min per rinse. Sections were blocked in 10% normal donkey serum in PBST containing 0.3% Triton X-100 for 1 h. Sections were incubated in primary antibody, either mouse monoclonal anti-TH (1:2000; cat. #MAB318; Millipore; Temecula, CA) or rabbit polyclonal anti-DARPP32 (1:500; cat.#AB10518; Millipore; Temecula, CA) diluted in PBST with 1% donkey serum for 72 h at 4°C. Sections were rinsed 3 times with PBS and incubated with either donkey anti-mouse IR800 (1:500; cat.#926-32212; Li-Cor; Lincoln, NE) or donkey anti-rabbit IR800 (1:500; cat.#926-32213; Li-Cor; Lincoln, NE) diluted in PBST with 1% donkey serum for 2 h at room temperature. After 3 washes with PBS, sections were mounted on slides and air-dried overnight at room temperature. After immersion in Histoclear for 10 min, slides were blotted dry and coverslipped with DPX mountant. Immunofluorescence quantification was performed similar to previously described (Cannon et al., 2013; Tapias et al., 2014). Briefly, immunofluorescence was detected with the Odyssey infrared imaging system (Li-Cor; Lincoln, NE) at 21μm resolution. Regions of interest were selected and intensity of each region determined using Image Studio software (version 3.1).
Another set of slices was processed for fluoro-jade C staining to identify degenerating neurons (Sarkar & Schmued, 2011). Slices were removed from cryoprotectant and rinsed 6 times in PBS for 10 min per rinse. Slices were mounted on slides coated with 0.5% porcine skin gelatin and dried overnight at room temperature. Slides were then immersed for 5 min in 0.03M tripotassium phosphate (K3PO4,) in 70% ethanol, diluted from 200% ethanol in water, and then rinsed in 70% ethanol and water for 2 min each. Followed by immersion in a 0.06% potassium permanganate solution for 10 min and rinsed in water for 2 min. Slides were immersed in a 0.0001% fluoro-jade C solution, diluted in 0.1% glacial acetic acid for 10 min followed by 3 rinses in water for 2 min each. Slides were dried on a 50°C heating block (Lab Line Instruments, Inc.; Melrose Park, IL) for 5 min and cleared in Histoclear for 1 min. At this point, slides were blotted dry and coverslipped with DPX mountant. All fluoro-jade C staining steps were performed at room temperature. Negative control slices were treated in the same manner as all other slices, but primary antibody was omitted. Slices from animals treated with kainic acid were used as a positive control (Sarkar & Schmued, 2011). Fluorescence was assessed on an Olympus (BX53F; Tokyo, Japan) microscope using a FITC filter and 50 ms pixel dwell time. The microscope was equipped with an Olympus (U-HGLGPS; Tokyo, Japan) light source.
2.9 Statistical Analysis
The required minimum sample size necessary to detect a difference in neurotransmitter level changes after Mn treatment was calculated using G*Power 3 software (Faul et al., 2007). This was based on means found in the literature reporting studies with similar methods. Using α = 0.05 and power = 0.8, an n = 5 should be sufficient to detect an approximately 30% difference using HPLC. Where a sample size was less than 5 for HPLC analysis, this was due to overlapping or undetectable peaks or other problems with quantification, and for behavioral analysis this was due to software errors in tracking animals’ movements during the entire session. All data are expressed as mean ± SD. All data sets were first evaluated for outliers using Grubb’s test. Statistical analyses of the differences between groups were carried out by one-way ANOVA for HPLC of neurotransmitters. Two-way ANOVAs with repeated measures were used to analyze the differences in body weights and in behavioral data. Student’s t test was used to assess differences between treated and control values for STR and HP AAS data. Where analysis indicated that significant differences between groups occurred, these differences were identified by post hoc analysis using Tukey’s test. Homogeneity of variances was confirmed using the F test for Student’s t test and using Bartlett’s test for ANOVA. Additionally, for repeated measures, the Geisser-Greenhouse test of sphericity was used and epsilon was evaluated for departure from sphericity. A p-value less than 0.05 was considered statistically significant. All analyses were conducted using Graph Pad Prism (Version 6.0, Graph Pad Prism; San Diego, CA).
3. Results
3.1 Mn exposure reduces body weight
Animals were weighed daily prior to dose administration and weights recorded to the nearest 0.1 g (Fig. 1). At the beginning of the study, there was no significant difference in body weights between groups (n = 5 in all groups). All animals weighed 252 ± 8 g. Mn treatment reduced animal’s body weight in a dose dependent manner. Animals in the group receiving 6 mg Mn/kg lost an average of 10 g during the first three days of dosing and began to regain weight by the fourth day. Animals in the group receiving 15 mg Mn/kg lost an average of 40 g during the first five days of dosing and began to regain weight by the sixth day. Although Mn-treated animals regained weight to some extent, average body weights were significantly lower than control beginning on the second day of dosing, an effect that persisted for the duration of the study.
Figure 1.

Daily intraperitoneal injections of MnCl2 results in reduced weight gain in Mn-treated animals. Rats were weighed daily prior to dose administration and weights were averaged for each group. Exposure to MnCl2 induced significant changes in body weights in a dose-dependent manner. A steady increase in average body weights of control rats (square) was observed throughout the study. Animals in the low (triangle) and high (inverted triangle) dose groups showed an initial decrease in body weight but began to gain weight after three and five days, respectively. For the remainder of the study, rats in the dose groups continued to gain weight, but average weights were significantly decreased compared with controls. Two-way ANOVA with repeated measures and Tukey’s post hoc test (n = 5). Error bars indicate SD. Ct: control; LD: low dose at 6 mg/kg; HD: high dose at 15 mg/kg.
3.2 Mn accumulates in the STR and HP
AAS analysis was completed to determine if and to what extent Mn accumulated in brain tissue following Mn exposure. The levels of Mn in the STR and HP from both Mn-exposed groups was significantly higher than in controls (p<0.001; Table 1).
Table 1. Concentration of metal in select rat brain regions following subacute Mn exposure.
Atomic absorption spectroscopic analysis of Mn content in rat brain samples. Animals received i.p. injection of 6 or 15 mg/kg Mn once daily 5 days per week for 4 weeks. Metal concentrations were quantified using atomic absorption spectroscopy and are expressed as ug/g wet weight. Mn concentrations were significantly increased in the STR and HP of both Mn-treated groups compared with controls.
| 6 mg Mn/kg as MnCl2 | 15 mg Mn/kg as MnCl2 | |||
|---|---|---|---|---|
|
| ||||
| STR | HP | STR | HP | |
| control | 0.785 ± 0.229 | 0.642 ± 0.082 | 0.426 ± 0.164 | 0.337 ± 0.048 |
| treated | 2.904 ± 0.483*** | 1.924 ± 0.313*** | 2.636 ± 0.745*** | 1.505 ± 0.458*** |
Data represent mean ± SD, n = 7–10;
p<0.001.
3.3 Mn exposure resulted in hypoactivity
The average distance traveled decreased for animals in all groups between the first and the last training sessions (Fig. 2A). The average velocities appeared to correspondingly decrease for each group, but did not reach significance (Fig. 2B). During the later testing sessions, some animals exhibited periods of inactivity in the testing chambers. Examination of these two related behavioral parameters revealed a significant decrease in the distance traveled in both Mn-treated groups compared with the control group during the first training session [df = 27; p< 0.01]. Additionally, the average velocity significantly decreased in both Mn-treated groups compared with the control group during the first training session [df = 27; p < 0.05].
Figure 2.

Open field analysis of locomotor activity. Group averages for distance traveled (A) and average velocity (B) were measured in an open field test on study days 8, 11, and 18. Significant differences were observed between the Mn-treated and control groups by the 8th study day. Two-way ANOVA with Tukey’s post hoc test. Error bars represent SD (n = 3–5). *p<0.05 6 mg/kg/day vs. control, #p<0.05 15 mg/kg/day vs. control.
3.4 Levels of biogenic amines and their metabolites in brain tissue following Mn exposure
The DA level in the STR was significantly higher in the high-dose group than the control group (157.0 ± 15.73 vs. 99.8 ± 42.10 ng/mg protein; mean ± SD; high vs. control; p < 0.05; Fig. 3A). Changes in DA levels in the SN and HP did not reach statistical significance following 4 weeks of low-dose Mn treatment (Fig. 3E,I).
Figure 3.

HPLC analysis of DA, its metabolites, and turnover in rat STR, SN, and HP after Mn treatment. DA (A,E,I), and its metabolites DOPAC (B,F,J), and HVA (C,G,K) were quantified in STR (A–C), SN (E–G), and HP (I–K) by HPLC. DA turnover in each region was calculated as the sum of the metabolites divided by DA concentration (D,H,L). Data revealed significant increase in DA levels in the STR between the control and high dose groups (A). DA metabolites in the STR were also significantly increased between control and high dose groups and between the low and high dose groups (B–C). No difference was observed in DA turnover in the STR (D). While no difference was observed in DA or DOPAC levels in SN (E–F), HVA was significantly increased in the SN between the control and high dose groups and between the low and high dose groups (G). Additionally, DA turnover was significantly increased in the SN between the control and both low and high dose groups (H). No difference was observed for DA or DOPAC levels in the HP (I–J) or DA turnover in the HP (L). Levels of HVA were increased significantly in the HP between control and high dose groups as well as between low and high dose groups. ANOVA with Tukey’s post hoc test. Data represent mean ± SD (n = 4–5). *p<0.05, **p<0.01.
Levels of the DA metabolite, DOPAC, in the STR of the high-dose group was significantly higher than those of the low-dose and control groups (10.7 ± 2.16, 16.9 ± 1.68 vs. 10.6 ± 4.87 ng/mg protein; mean ± SD; low, high vs. control; p < 0.05 for both; Fig. 3B). Levels of DA and DOPAC were similarly elevated in both the SN and HP, but these changes did not reach statistical significance (Fig. 3F,J).
Following 4 weeks of high-dose Mn exposure, levels of HVA (final DA metabolite), were significantly higher in the STR compared with the low-dose and control groups (5.4 ± 1.58, 10.5 ± 1.79 vs. 2.7 ± 3.63 ng/mg protein; mean ± SD; low dose, high dose vs. control; p < 0.05 and < 0.001, respectively; Fig. 3C). HVA levels in the SN and HP were also significantly higher in the high-dose group than in the control group (in SN, 0.6 ± 0.29 vs. 0.3 ± 0.06 ng/mg protein; in HP, 0.2 ± 0.04 vs. 0.1 ± 0.02 ng/mg protein; high dose vs. control; p < 0.05 and 0.01 respectively; Fig. 3G,K).
The DA turnover ratio was defined as the sum of the DA metabolites, DOPAC and HVA, divided by DA in each brain region. While DA turnover in the STR appeared to be increased, differences were not significant (Fig. 3D). In the SN, DA turnover was significantly increased for both Mn-treatment groups when compared with the control (1.5 ± 0.37, 1.6 ± 0.27 vs. 0.9 ± 0.22; mean ± SD; low, high vs. control; p < 0.05 for both; Fig. 3H). There was no difference between the turnover ratios of the low- and high-dose groups. In the HP, differences in DA turnover did not reach statistical significance (Fig. 3L).
5-HT levels in the STR and SN were not significantly changed following either Mn-treatment as compared with the control (Fig. 4A,D). In the HP, levels of 5-HT revealed a non-monotonic curve, decreasing in the low-dose but increasing in the high-dose group, in comparison with the control group. The level of 5-HT in the HP was significantly higher in the high-dose treatment group than in the low-dose group (3.2 ± 0.80 vs. 1.9 ± 0.20 ng/mg protein; mean ± SD; high dose vs. low dose; p < 0.01; Fig. 4G).
Figure 4.

HPLC analysis of 5-HT, its metabolite, 5-HIAA, and turnover in rat STR, SN, and HP after Mn treatment. 5-HT (A,D,G) and 5-HIAA (B,E,H) were quantified using HPLC. 5-HT turnover was calculated by dividing the concentration of 5-HIAA by 5-HT (C,F,I). 5-HT concentrations and turnover in the STR did not differ between control and either low or high dose groups (A,C). 5-HIAA was increased significantly between the low and high dose groups (B). No differences in 5-HT, 5-HIAA, or turnover were observed in the SN (D–F). 5-HT concentrations were increased significantly between the low and high dose groups in the HP (G). No differences were observed for 5-HIAA or 5-HT turnover rates in the HP (H,I). ANOVA with Tukey’s post hoc test. Data represent mean ± SD (n = 3–5). *p<0.05.
Significantly elevated levels of the 5-HT metabolite, 5-HIAA, were observed in the STR of the high-dose group, when compared with the low-dose group (4.7 ± 0.58 vs. 3.3 ± 0.47 ng/mg protein; mean ± SD; high dose vs. low dose; p < 0.05; Fig. 4B). Mn exposure did not affect the level of 5-HIAA in the SN or HP (Fig. 4E,H).
The 5-HT turnover ratio is defined as the amount of 5-HIAA divided by 5-HT in each brain region. 5-HT turnover was not statistically changed in the three brain regions studied. (Fig. 4C,F,I).
NE levels in the STR and SN were not significantly different between Mn exposed and control animals (Fig. 5A–B). In the HP, significantly higher NE levels were observed in the high-dose exposure group compared with the low-dose group (6.4 ± 1.29 vs. 4.1 ± 0.81 ng/mg protein; mean ± SD; high dose vs. low dose; p < 0.05; Fig. 5C).
Figure 5.
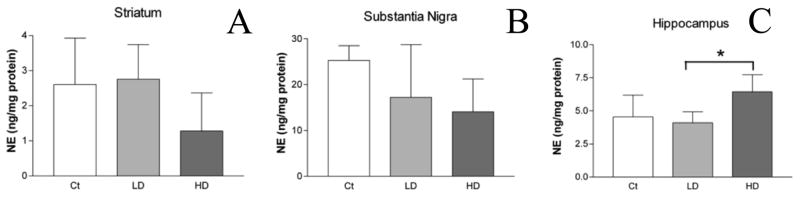
NE levels in select rat brain regions. NE levels in STR (A), SN (B), and HP (C) were quantified using HPLC. No differences were observed in NE levels between control and low or high dose groups in the STR (A) or SN (B). In the HP (C), NE levels were increased significantly between the low and high dose groups. ANOVA with Tukey’s post hoc test for multiple comparisons. Data represent mean ± SD (n = 5). *p<0.05.
Levels of GABA, the main inhibitory neurotransmitter, were not statistically different in the STR or SN (Fig. 6A–B). A significant increase in the HP GABA level was observed in high-dose Mn exposed animals compared with controls (2,221 ± 310.4 vs. 1,441 ± 524.5 ng/mg protein; mean ± SD; high dose vs. control; p < 0.05; Fig. 6C).
Figure 6.
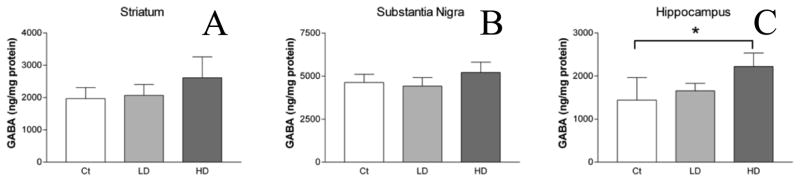
GABA levels in select brain regions. GABA levels in STR (A), SN (B), and HP (C) were quantified using HPLC. No differences were observed in GABA levels between control and low or high dose groups in the STR (A) or SN (B). In the HP (C), GABA levels were increased significantly between the control and high dose groups. ANOVA with Tukey’s post hoc test for multiple comparisons. Data represent mean ± SD (n = 3–5). *p<0.05.
3.5 Immunohistochemistry of striatum following Mn exposure
Fluorescence intensities of TH and DARPP-32 were not statistically different in the STR of Mn-exposed animals in comparison with those of control animals (Fig. 7C and 8C). Fluorojade C staining did not identify degenerating neurons in any group (data not shown).
Figure 7.
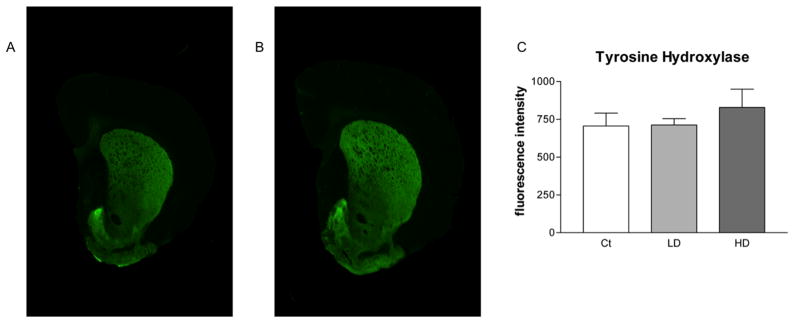
Quantitative infrared immunofluorescence analysis of striatal TH levels. Coronal slices from rat STR were probed for antibodies against TH. Secondary antibodies were tagged with an infrared fluorescent marker. Depicted are representative scans showing fluorescence intensity in STR slices from control animals (A) and Mn treated animals (B). Manually selected ROIs are shown as dashed lines. A minimum of three slices were quantified from each animal and the resulting values were averaged. Group values were averaged and are shown (C). No difference was observed between control and either low or high dose groups. Mn treatment did not affect STR TH signal intensity. ANOVA with Tukey’s post hoc test for multiple comparisons. Data represent mean ± SD (n = 4–5).
Figure 8.
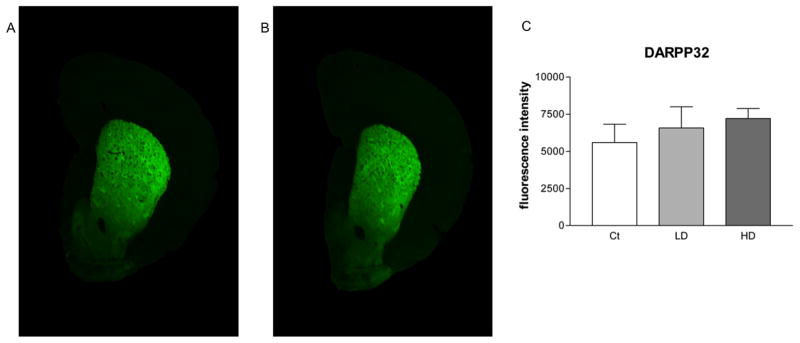
Quantitative infrared immunofluorescence analysis of striatal DARPP32 levels. Coronal slices from rat striatum (STR) were probed for antibodies against DARPP32. Secondary antibodies were tagged with an infrared fluorescent marker. Depicted are representative scans showing fluorescence intensity in STR slices from control animals (A) and Mn treated animals (B). A minimum of three slices were quantified from each animal and the resulting values were averaged. Group values were averaged and are shown (C). No difference was observed between control and either low or high dose groups. Mn treatment did not affect STR DARPP32 signal intensity. ANOVA with Tukey’s post hoc test for multiple comparisons. Data represent mean ± SD (n = 4–5).
4. Discussion
Manganese exposure represents a major public health concern. The effects of chronic, low-level Mn exposure to the general public remain unknown. However, real-life excess exposure to Mn does indeed exist, particularly in occupational settings. The current study has shown that subacute, low-doses of MnCl2 significantly altered levels of neurotransmitters in rats and produces a decrease in locomotor behaviors.
The low dose Mn treatment used in this study has been detailed in previous reports from our laboratory and others (Lebda et al., 2012; Zheng et al., 2009). The high dose level of Mn used in this paper has been used by several other laboratories (Ou et al., 2011; Hong et al., 1984; Husain et al., 2001). Under these dose regimens, Mn exposure significantly reduced animals’ body weights. Additionally, Mn treatment markedly reduced exploratory behavior beginning on study day 8. Evidence of peritonitis or other abdominal toxicity was not overtly evident, suggesting that systemic toxicity in the abdominal cavity did not contribute to decreased activity. Thus, we believe the observed behavioral changes were not necessarily due to any problems with dose administration, but rather due to the effect of Mn. Weight loss is commonly associated with decreased activity in animal models of PD (Cannon et al., 2009). Furthermore, as the study progressed, the gap in differences between body weights narrowed.
Another possible reason for the differences in body weights observed in this study could be due to a difference in food intake between treatment groups. Food intake was not monitored in this study, but Fitsanakis et al. (2008) noted that changes in body weights were not attributed to differences in food consumption between treatment groups.
It should also be considered that the changes in body weights can be associated with altered neurochemistry. Pothos et al. (1995) showed decreased levels of DA and HVA in the STR as well as hyperactivity in food restricted rats. The current study found the opposite to be true; we observed significant increases in striatal DA and HVA levels and hypoactive animals. We believe that the reduced body weights of our Mn-treated animals were not likely to directly affect DA concentrations, because animals were not food deprived and appeared to be eating. We noticed the animals eating during daily animal checks and observed food in their stomachs and gastrointestinal tracts at necropsy. Additionally, although the Mn-treated animals weighed significantly less, they were gaining weight throughout the study.
In a recent review of Mn exposed animal models, McMillian (1999) noted that behavioral results from many studies show a “slowly developing biphasic response to Mn exposure,” with an initial increase in the observed behavior followed by a subsequent decline in behavior. This is true for multiple species, including rats and monkeys (Nachtman et al., 1986; Vezér et al., 2007). However, in the current study, we did not observe the initial increase in motor activity. This could be due to using a behavioral test not suited to detecting subtle behavioral changes. An alternative hypothesis is that we began testing our animals after any existing hyperactivity had ceased. As such, the observed hypoactivity may have resulted from altered neurochemistry and progression of the treatments’ effects.
It may be that the hypoactivity observed resulted from habituation to the testing environment as the animals no longer consider it to be “novel.” However, in our experience, testing less than once per week results in limited habituation. As all animals were acclimated to the testing environment on two occasions before the testing days and all animals were acclimated to the room for 30 minutes before each testing session, we do not believe that this would bias the Mn-treated animals in any way towards hyper or hypoactivity.
Our HPLC results clearly demonstrated that DA levels in STR, but not in SN, were significantly increased after Mn treatment. The elevated level of DA in the STR observed in our study is consistent with reports in the literature that at lower internal cumulative doses of Mn exposure, there is a trend towards increasing DA levels in the STR (reviewed by Gwiazda et al., 2007). Our dose levels were within the range they reviewed and our findings were in agreement with their conclusions.
We have also observed significantly increased levels of HVA in the STR; but increases in NE were limited to the HP. Increased levels of HVA and NE in the STR have been observed in studies with dose duration from 90–120 days (Chandra et al., 1979). Species differences between the two studies (i.e. mice vs. rats) may account for the discrepancy noted. While there is a report to suggest increased GABA in the STR for a wide range of Mn doses (Gwiazda et al., 2007), we did not observe significant changes in STR GABA, but did find significantly increased levels of GABA in the HP of Mn-treated rats. In the SN, GABA levels were unchanged.
Several reports have demonstrated that Mn treatment initially causes an increase in DA, HVA, and NE, but as the exposure increases, the neurotransmitter levels are decreased (Chandra et al., 1979; Chandra & Shukla, 1981; Cotzias et al., 1974). It was proposed that DA and NE are increased due to increased synthesis of biogenic amines early in manganism (Chandra et al., 1979). Our data are in close agreement with this hypothesis. Several mechanisms may potentially explain the findings in this study. First, the increased levels of the enzyme MAO-B may metabolize DA to DOPAC. Gwiazda et al. (2007) noted increased MAO-B levels after low doses of Mn and they also showed increased STR DA, in agreement with our results. Our DA turnover results further support this possible mechanism. Second, Guilarte et al. (2006) proposed that DA neurons may have an impaired ability release DA into the synapse after Mn exposure, which could cause intracellular DA levels to increase. Calabresi et al. (2001) postulated that altered release characteristics may alter the life-time of DA within the STR. Finally, it is plausible that Mn may stimulate TH activity to increase DA production (Chandra et al., 1979). In this study, we have assessed levels of TH in the STR of all groups of rats by immunofluorescence; however, the striatal TH expression was not affected by Mn exposure. Thus, it is unlikely that the increases in DA levels were attributable to a direct increase in TH levels. This finding also suggests that Mn treatment did not result in significant DA terminal loss. In future studies, it may be prudent to investigate changes in both TH levels and TH phosphorylation in SN, because DA is primarily synthesized in the SN and axons project to the STR (Kunar et al., 1999).
Our recent XRF data show that Mn accumulates in the SN (Robison et al., 2012). However, the current neurochemistry study showed that the SN appears to be largely unaffected by Mn treatment. We noted altered levels of HVA in the SN, but the region was unaffected for all other neurotransmitters investigated. These SN neurons are spared, at least in the early stages of the disease (Roth, 2009). We have demonstrated that Mn significantly accumulates in the STR and HP following the dose regimen used in this study. Furthermore, recent work from our lab has shown that levels of Mn in the STR and HP are well correlated with levels of Mn in bone (r = 0.755 and 0.782, respectively; O’Neal et al., 2014).
It must be noted that differences in Mn species, dose routes, durations and frequencies used may yield different neurochemical changes due to the complex effects of Mn (Ordoñez-Librado et al., 2008). For example, a similar study by Blecharz-Klin, et al. (2012) used an intranasal dose route for 2 weeks instead of 4 weeks in slightly older animals; they did not observe a difference in either STR DA or DOPAC, but noted a decreased level of STR HVA and decreased DA turnover. Autissier et al. (1982) also used an i.p. dose route, but the duration was considerably longer than was used in the current study and they showed a significant decrease in striatal DA. They concluded that long term Mn exposure is required to cause a decrease in striatal DA. Williams et al. (2010) used an i.v. dose and observed a significant decrease in DA signaling using BOLD MRI after an amphetamine challenge in Mn treated rats.
Differences in animal species may also play a role in differences in neurochemistry after Mn treatment. For example, many researchers utilize C57 mice in their studies. Some investigators observed a decrease in striatal DA (Gianutsos et al, 1982; Khalid et al., 2011; Madison et al., 2012), and some do not observe a change in striatal DA (Dodd et al., 2013). It seems plausible that the sex of the animal may also play a role in the outcome of studies of Mn exposure on neurochemistry, as females have been found to exhibit increase Mn relative to males (Dobson et al., 2004). Gwiazda et al. (2002) and Vidal et al. (2005) both utilized female rats in their studies and found no change and decreased striatal DA, respectively.
There were several limitations in the current study. First, the study was designed to include equal numbers of animals in each group. However, one animal in the high dose group had to be sacrificed early due to an issue with its tail from an apparently unrelated cause. This resulted in unequal sample sizes in some instances. However, as discussed in the statistical methods section, the resulting sample size was expected to have enough power to detect statistical differences between the groups.
Another possible limitation in this study was use of the open field test as a measure of general activity. While the open field test is considered a measure of anxiety, exploratory drive, and general activity (Careau et al., 2012), without carefully controlled experiments, the open field test may only indicate a transient change within an individual animal. Ideally, lighting and noise levels would be controlled, and other measures of activity and anxiety would be quantified, i.e. thigmotaxis, vertical exploratory behavior (rearing), and defecation. In this study, no additional behavioral measurements were made.
A second issue with the open field test in this study was the short duration of behavioral assessment. The duration used in this study, 5 minutes, is commonly used by other researchers (Meerlo et al., 1996; Pechlivanova et al., 2010; Careau et al., 2012); however it may be that longer durations would be better suited to investigate general locomotor activity. It may also be worthwhile to investigate incremental changes, i.e. 5 minutes in a 30 minute testing session, to look for changes in activity levels within a single session which may indicate habituation.
It is worth noting that there has been significant effort devoted to examining a potential role that Mn exposure may play in PD. The observation of increased DA is in contrast to a key feature of PD, which is striatal DA depletion due to loss of nigrostriatal DA neurons. Chronic Mn-induced increases in DA could be deleterious as DA itself is a reactive molecule contributing to oxidative stress (Hastings & Zigmond, 1994). Finally, PD is characterized by complex neurochemical changes, beyond striatal DA depletion alone. Even in a straightforward animal model involving chemical ablation of nigrostriatal DA neurons, complex changes occur in other neurotransmitter systems (Schwarting & Huston, 1996). Thus, additional studies to elucidate the similarities and differences between models of Mn intoxication and prominent PD models, such as the 6-OHDA or MPTP models will be required. This will potentially enhance our understanding of the association between Mn and Parkinsonian disorders.
In summary, our neurochemistry data are in agreement with existing data in the literature, suggesting that this dose regimen may be a model of Mn intoxication. Because the symptoms of manganism are slowly progressive and exist along a continuum, we hypothesize that our model may show changes observed early in clinical manganism. Use of this model as a model of early manganism may allow the study of mechanisms that progress to clinical manganism. Cotzias (1958) noted that the early phase may lack motor disturbances and the disease primarily consists of psychological symptoms. These psychological symptoms are harder to detect and therefore, more sophisticated behavioral analyses to assess the symptoms such as disturbance of sleep, eating and sexual disturbances may be needed.
Highlights.
Systemic Mn exposure in rats produces alterations in brain catecholamines
Behavioral deficits in Mn-exposed rats occur as early as 8 days after exposure
Limited changes in other neurotransmitter systems were detected in Mn-exposed rats
Acknowledgments
This work was supported by the National Institutes of Health/National Institute of Environmental Health Sciences Grants R01ES008146 (W.Z.), R00ES019879 and R03ES022819 (J.R.C), and the Ralph W. and Grace M. Showalter Research Trust (J.R.C.). Thanks to Dr. Ryan Drenan for use of behavioral testing equipment. We also wish to thank Changhe Xiao for valuable technical assistance with HPLC analysis.
ABBREVIATIONS
- AAS
Atomic Absorption Spectroscopy
- Cu
Copper
- DOPAC
3,4-dihydroxyphenylacetic acid
- DA
dopamine
- Fe
Iron
- GABA
gamma aminobutyric acid
- HVA
homovanillic acid
- GP
globus pallidus
- HP
hippocampus
- Mn
Manganese
- PD
Parkinson’s disease
- NE
noradrenaline
- SN
substantia nigra
- STR
striatum
- TH
tyrosine hydroxylase
- Zn
Zinc
- 5-HT
5-hydroxytryptamine
- 5-HIAA
5-hydroxyindolacetic acid
Footnotes
Conflict of interest statement
The authors have no financial conflicts of interest.
-
All third-party financial support for the work in the submitted manuscript.This work was supported by the National Institutes of Health/National Institute of Environmental Health Sciences Grants R01ES008146 (W.Z., S.L.O.), R00ES019879 and R03ES022819 (J.R.C), and the Ralph W. and Grace M. Showalter Research Trust (J.R.C.).
-
All financial relationships with any entities that could be viewed as relevant to the general area of the submitted manuscript.None.
-
All sources of revenue with relevance to the submitted work who made payments to you, or to your institution on your behalf, in the 36 months prior to submission.This work was supported by the National Institutes of Health/National Institute of Environmental Health Sciences Grants R01ES008146 (W.Z., S.L.O.), R00ES019879 and R03ES022819 (J.R.C), and the Ralph W. and Grace M. Showalter Research Trust (J.R.C.).
-
Any other interactions with the sponsor of outside of the submitted work should also be reported.None.
-
Any relevant patents or copyrights (planned, pending, or issued).None
-
Any other relationships or affiliations that may be perceived by readers to have influenced, or give the appearance of potentially influencing, what you wrote in the submitted work.None
Publisher's Disclaimer: This is a PDF file of an unedited manuscript that has been accepted for publication. As a service to our customers we are providing this early version of the manuscript. The manuscript will undergo copyediting, typesetting, and review of the resulting proof before it is published in its final citable form. Please note that during the production process errors may be discovered which could affect the content, and all legal disclaimers that apply to the journal pertain.
References
- Andersen ME, Dorman DC, Clewell HJ, Taylor MD, Nong A. Multi-dose-route, multi-species pharmacokinetic models for manganese and their use in risk assessment. Journal Of Toxicology And Environmental Health Part A. 2010;73(2):217–234. doi: 10.1080/15287390903340849. [DOI] [PubMed] [Google Scholar]
- Aschner M, Vrana KE, Zheng W. Manganese Uptake and Distribution in the Central Nervous System. NeuroToxicology. 1999;20(2–3):173–180. [PubMed] [Google Scholar]
- Aschner M, Erikson KM, Herrero Hernández E, Hernández EH, Tjalkens R. Manganese and its role in Parkinson’s disease: from transport to neuropathology. Neuromolecular medicine. 2009;11(4):252–266. doi: 10.1007/s12017-009-8083-0. [DOI] [PMC free article] [PubMed] [Google Scholar]
- Aschner M, Guilarte TR, Schneider JS, Zheng W. Manganese: recent advances in understanding its transport and neurotoxicity. Toxicology and Applied Pharmacology. 2007;221(2):131–147. doi: 10.1016/j.taap.2007.03.001. [DOI] [PMC free article] [PubMed] [Google Scholar]
- Autissier N, Rochette L, Dumas P, Beley A, Loireau A, Bralet J. Dopamine and norepinephrine turnover in various regions of the rat brain after chronic manganese chloride administration. Toxicology. 1982;24:175–182. doi: 10.1016/0300-483x(82)90055-5. [DOI] [PubMed] [Google Scholar]
- Blecharz-Klin K, Piechal A, Joniec-Maciejak I, Pyrzanowska J, Widy-Tyszkiewicz E. Effect of intranasal manganese administration on neurotransmission and spatial learning in rats. Toxicology and applied pharmacology. 2012;265(1):1–9. doi: 10.1016/j.taap.2012.09.015. [DOI] [PubMed] [Google Scholar]
- Bonilla E. L-tyrosine hydroxylase activity in the rat brain after chronic oral administration of manganese chloride. Neurobehavioral Toxicology. 1980;2(1):37–41. [PubMed] [Google Scholar]
- Bouchard M, Laforest F, Vandelac L, Bellinger D, Mergler D. Hair manganese and hyperactive behaviors: pilot study of school-age children exposed through tap water. Environmental Health Perspectives. 2007;115(1):122–127. doi: 10.1289/ehp.9504. [DOI] [PMC free article] [PubMed] [Google Scholar]
- Bowman AB, Kwakye GF, Hernández EH, Aschner M. Role of manganese in neurodegenerative diseases. Journal of trace elements in medicine and biology. 2011;25(4):191–203. doi: 10.1016/j.jtemb.2011.08.144. [DOI] [PMC free article] [PubMed] [Google Scholar]
- Bradford MA. A rapid and sensitive method for the quantitation of microgram quantities of protein utilizing the principle of protein-dye binding. Analytical Biochemistry. 1976;72:248–254. doi: 10.1006/abio.1976.9999. [DOI] [PubMed] [Google Scholar]
- Calabresi P, Ammassari-Teule M, Gubellini P, Sancesario G, Morello M, Centonze D, Marfia GA, et al. A synaptic mechanism underlying the behavioral abnormalities induced by manganese intoxication. Neurobiology of disease. 2001;8(3):419–32. doi: 10.1006/nbdi.2000.0379. [DOI] [PubMed] [Google Scholar]
- Cannon JR, Geghman KD, Tapias V, Sew T, Dail MK, Li C, Greenamyre JT. Expression of human E46K-mutated a-synuclein in BAC-transgenic rats replicates early-stage Parkinson’s disease features and enhances vulnerability to mitochondrial impairment. Experimental Neurology. 2013;240:44–56. doi: 10.1016/j.expneurol.2012.11.007. [DOI] [PMC free article] [PubMed] [Google Scholar]
- Cannon JR, Tapias V, Na HM, Honick AS, Drolet RE, Greenamyre JT. A highly reproducible rotenone model of Parkinson’s disease. Neurobiology of Disease. 2009;34(2):279–290. doi: 10.1016/j.nbd.2009.01.016. [DOI] [PMC free article] [PubMed] [Google Scholar]
- Cannon JR, Nakamura T, Keep RF, Richardson RJ, Hua Y, Xi G. Dopamine changes in a rat model of intracerebral hemorrhage. Acta Neurochirurgica Supplement. 2006;96:222–226. doi: 10.1007/3-211-30714-1_48. [DOI] [PubMed] [Google Scholar]
- Careau V, Bininda-Emonds OR, Ordonez G, Garland T., Jr Are Voluntary wheel running and open-field behavior correlated in mice? Different answers from comparative and artificial selection approaches. Behavior Genetics. 2012;42(5):830–844. doi: 10.1007/s10519-012-9543-0. [DOI] [PubMed] [Google Scholar]
- Chandra SV, Shukla GS. Concentrations of striatal catecholamines in rats given manganese chloride through drinking water. Journal of neurochemistry. 1981;36(2):683–687. doi: 10.1111/j.1471-4159.1981.tb01642.x. Retrieved from http://www.ncbi.nlm.nih.gov/pubmed/7463083. [DOI] [PubMed] [Google Scholar]
- Chandra SV, Shukla GS, Murthy RC. Effect of stress on the response of rat brain to manganese. Toxicology and applied pharmacology. 1979;47(3):603–608. doi: 10.1016/0041-008x(79)90530-1. Retrieved from http://www.ncbi.nlm.nih.gov/pubmed/442097. [DOI] [PubMed] [Google Scholar]
- Chandra SV, Shukla GS, Saxena DK. Manganese-induced behavioral dysfunction and its neurochemical mechanism in growing mice. Journal of neurochemistry. 1979;33(6):1217–21. doi: 10.1111/j.1471-4159.1979.tb05267.x. Retrieved from http://www.ncbi.nlm.nih.gov/pubmed/552401. [DOI] [PubMed] [Google Scholar]
- Cooper WC. The Health Implications of Increased Manganese in the Environment Resulting from the Combustion of Fuel Additives: A Review of the Literature. Journal of Toxicology and Environmental Health. 1984;14(1):23–46. doi: 10.1080/15287398409530561. [DOI] [PubMed] [Google Scholar]
- Cotzias GC, Papavasiliou PS, Mena I, Tang LC, Miller ST. Manganese and Catecholamines. Advances in Neurology. 1974;5:235–243. [PubMed] [Google Scholar]
- Crossgrove J, Zheng W. Manganese toxicity upon overexposure. NMR in biomedicine. 2004;17(8):544–553. doi: 10.1002/nbm.931. [DOI] [PMC free article] [PubMed] [Google Scholar]
- Dobson AW, Erikson KM, Aschner M. Manganese neurotoxicity. Annals of the New York Academy of Sciences. 2004;1012:115–128. doi: 10.1196/annals.1306.009. [DOI] [PubMed] [Google Scholar]
- Dodd CA, Bloomquist JR, Klein BG. Consequences of manganese administration for striatal dopamaine and motor behavior in 1-methyl-4-phenyl-1,2,3,6-tetrahydropyridine exposed C57BL/6 mice. Human and Experimental Toxicology, 3. 2013;2(8):865–880. doi: 10.1177/0960327112469043. [DOI] [PubMed] [Google Scholar]
- Faul F, Edrfelder E, Lang AG, Buchner A. G*Power 3: A flexible statistical power analysis program for the social, behavioral, and biomedical sciences. Behavior Research Methods. 2007;39:175–191. doi: 10.3758/bf03193146. [DOI] [PubMed] [Google Scholar]
- Fitsanakis VA, Zhang N, Anderson JG, Erikson KM, Avison MJ, Gore JC, Aschner M. Measuring brain manganese and iron accumulation in rats following 14 weeks of low-dose manganese treatment using atomic absorption spectroscopy and magnetic resonance imaging. Toxicological sciences. 2008;103(1):116–124. doi: 10.1093/toxsci/kfn019. [DOI] [PMC free article] [PubMed] [Google Scholar]
- Gianutsos G, Murray MT. Alterations in brain dopamine and GABA following inorganic or organic manganese administration. NeuroToxicology. 1982;3(3):75–82. [PubMed] [Google Scholar]
- Guilarte TR. Manganese and Parkinson’s disease: a critical review and new findings. Environmental health perspectives. 2010;118(8):1071–1080. doi: 10.1289/ehp.0901748. [DOI] [PMC free article] [PubMed] [Google Scholar]
- Guilarte T, Chen MK, McGlothan JL, Verina T, Wong DF, Zhou Y. Nigrostriatal Dopamine System Dysfunction and Subtle Motor Deficits in Manganese-Exposed Non-Human Primates. Experimental Neurology. 2006;202:381–390. doi: 10.1016/j.expneurol.2006.06.015. [DOI] [PubMed] [Google Scholar]
- Gwiazda R, Lucchini R, Smith D. Adequacy and consistency of animal studies to evaluate the neurotoxicity of chronic low-level manganese exposure in humans. Journal of toxicology and environmental health Part A. 2007;70(7):594–605. doi: 10.1080/10937400600882897. [DOI] [PubMed] [Google Scholar]
- Hastings TG, Zigmond MJ. Identification of catechol-protein conjugates in neostriatal slices incubated with [3H]dopamine: impact of ascorbic acid and glutathione. Journal of Neurochemistry. 1994;63:1126–1132. doi: 10.1046/j.1471-4159.1994.63031126.x. [DOI] [PubMed] [Google Scholar]
- Hong JS, Hung CR, Seth PK, Mason G, Bondy SC. Effect of Manganese Treatment on the Levels of Neurotransmitters, Hormones, and Neuropeptides: Modulation by Stress. Environmental Research. 1984;34(2):242–249. doi: 10.1016/0013-9351(84)90092-6. [DOI] [PubMed] [Google Scholar]
- Husain M, Khanna VK, Roy A, Tandon R, Pradeep S, Set PK. Platelet Dopamine Receptors and Oxidative Stress Parameters as Markers of Manganese Toxicity. Human & Experimental Toxicology. 2001;20(12):631–636. doi: 10.1191/096032701718890531. [DOI] [PubMed] [Google Scholar]
- Khalid M, Aoun RA, Mathews TA. Altered striatal dopamine release following a sub-acute exposure to manganese. Journal of Neuroscience Methods. 2011;202:182–191. doi: 10.1016/j.jneumeth.2011.06.019. [DOI] [PubMed] [Google Scholar]
- Klassen CD. Biliary Excretion of Metals. Drug Metabolism Review. 1976;5:165–196. doi: 10.3109/03602537609029977. [DOI] [PubMed] [Google Scholar]
- Kunar MJ, Couceyro PR, Lambert PD. Catecholamines. In: Siegel GJ, Agranoff BW, Albers RW, Fisher SK, Uhler MD, editors. Basic Neurochemistry Molecular, Cellular, and Medical Aspects. Philadelphia, PA: Lippincott-Raven; 1999. pp. 243–261. [Google Scholar]
- Lebda MA, El-Neweshy MS, El-Sayed YS. NeuroToxicology. 2012;33(1):98–104. doi: 10.1016/j.neuro.2011.12.008. [DOI] [PubMed] [Google Scholar]
- Madison JL, Wegrzynowicz M, Aschner M, Bowman AB. Disease-toxicant interactions in manganese exposed Huntington Disease mice: early changes in striatal neuron morphology and dopamine metabolism. PLoS ONE. 2012;7(2) doi: 10.1371/journal.pone.0031024. [DOI] [PMC free article] [PubMed] [Google Scholar]
- McMillian DE. A Brief History of the Neurobehavioral Toxicity of Manganese: Some Unanswered Questions. NeuroToxicology. 1999;20(2–3):499–508. [PubMed] [Google Scholar]
- Meerlo P, Overkamp GJ, Benning MA, Koolhaas JM, Van den Hoofdakker RH. Long-term changes in open field behavior following a single social defeat in rats can be reversed by sleep deprivation. Physiology & Behavior. 1996;60(1):115–119. doi: 10.1016/0031-9384(95)02271-6. [DOI] [PubMed] [Google Scholar]
- Mergler D, Baldwin M, Belanger S, Larribe F, Beuter A, Bowler R, Panisset M, Edwards R, De Geoffroy A, Sassine MP, Hudnell K. Manganese Neurotoxicity, a Continuum of Dysfunction: Results from a Community Based Study. NeuroToxicology. 1999;20(2–3):327–342. [PubMed] [Google Scholar]
- Nachtman JP, Tubben RE, Commissaris RL. Behavioral Effects of Chronic Manganese Administration in Rats: Locomotor Activity Studies. Neurobehavioral Toxicology and Teratology. 1986;8(6):711–715. [PubMed] [Google Scholar]
- Newland MC. Animal models of manganese’s neurotoxicity. NeuroToxicology. 1999;20(2–3):415–432. [PubMed] [Google Scholar]
- Ordoñez-Librado JL, Gutierrez-Valdez aL, Colín-Barenque L, Anaya-Martínez V, Díaz-Bech P, Avila-Costa MR. Inhalation of divalent and trivalent manganese mixture induces a Parkinson’s disease model: immunocytochemical and behavioral evidences. Neuroscience. 2008;155(1):7–16. doi: 10.1016/j.neuroscience.2008.05.012. [DOI] [PubMed] [Google Scholar]
- Oszlanczi G, Vezer T, Sarkozi L, Horvath E, Szabo A, Horvath E, Konya Z, Papp A. Metal disposition and functional neurotoxicity in rats after 3–6 weeks nasal exposure by two physicochemical forms of manganese. Environmental Toxicology and Pharmacology. 2010;30(2):121–126. doi: 10.1016/j.etap.2010.04.006. [DOI] [PubMed] [Google Scholar]
- Ou CY, Huang ML, Jiang YM, Luo HL, Deng XF, Wang C, Wang F, Huang XW. Effect of Sodium-Paraminosalicylic Acid on Concentrations of Amino Acid Neurotransmitters in Basal Ganglia of Manganese-Exposed Rats. Zhonghua Yu Fang Yi Xue Za Zhi. 2011;45(5):422–425. [PubMed] [Google Scholar]
- Pechlivanova D, Tchekalarova J, Nikolov R, Yakimova K. Dose-dependent effects of caffeine on behavior and thermoregulation in a chronic unpredictable stress model of depression in rats. Behavioural Brain Research. 2010;19(2):205–211. doi: 10.1016/j.bbr.2010.01.037. [DOI] [PubMed] [Google Scholar]
- Pothos EN, Hernandez L, Hoebel BG. Chronic food deprivation decreases extracellular dopamine in the nucleus accumbens: implications for a possible neurochemical link between weight loss and drug abuse. Obesity Research. 1995;3(Suppl 4):525S–529S. doi: 10.1002/j.1550-8528.1995.tb00222.x. [DOI] [PubMed] [Google Scholar]
- Robison G, Zakharova T, Fu S, Jiang W, Fulper R, Barrea R, Marcus MA, Zheng W, Pushkar Y. X-Ray Fluorescence Imaging: A New Tool for Studying Manganese Neurotoxicity. PLoS ONE. 2012;7(11):1–9. doi: 10.1371/journal.pone.0048899. [DOI] [PMC free article] [PubMed] [Google Scholar]
- Rodier J. Manganese poisoning in Moroccan miners. British Journal of Industrial Medicine. 1955;12:21–35. doi: 10.1136/oem.12.1.21. [DOI] [PMC free article] [PubMed] [Google Scholar]
- Roth JA. Are there common biochemical and molecular mechanisms controlling manganism and parkisonism. Neuromolecular medicine. 2009;11(4):281–296. doi: 10.1007/s12017-009-8088-8. [DOI] [PubMed] [Google Scholar]
- Sarkar S, Schmued L. The Fluoro-Jade Dyes: Novel, Sensitive, and Reliable Fluorochromes for the Histochemical Localization of Degenerating Neurons. In: Bolon B, Butt MT, editors. Fundamental Neuropathology for Pathologists and Toxicologists Principles and Techniques. Hoboken, NJ: Wiley & Sons, Inc; 2011. pp. 171–179. [Google Scholar]
- Schneider JS, Decamp E, Clark K, Bouquio C, Syversen T, Guilarte TR. Effects of chronic manganese exposure on working memory in non-human primates. Brain research. 2009;1258:86–95. doi: 10.1016/j.brainres.2008.12.035. [DOI] [PMC free article] [PubMed] [Google Scholar]
- Schwarting RK, Huston JP. Unilateral 6-hydroxydopamine lesions of meso-striatal dopamine neurons and their physiological sequelae. Progress in Neurobiology. 1996;49(3):215–266. doi: 10.1016/s0301-0082(96)00015-9. [DOI] [PubMed] [Google Scholar]
- Smith PK, Krohn RI, Hermanson GT, Mallia AK, Gartner FH, Provenzano MD, Fujimoto EK, Goeke NM, Olson BJ, Klenk DC. Measurement of protein using bicinchoninic acid. Analytical Biochemistry. 1985;150:76–85. doi: 10.1016/0003-2697(85)90442-7. [DOI] [PubMed] [Google Scholar]
- Tapias V, Cannon JR, Greenamyre JT. Pomegranate juic exacerbates oxidative stress and nigrostriatal degeneration in Parkinson’s disease. Neurobiology of Aging. 2014;35(5):1162–1176. doi: 10.1016/j.neurobiolaging.2013.10.077. [DOI] [PMC free article] [PubMed] [Google Scholar]
- Torrente M, Colomina MT, Domingo JL. Behavioral effects of adult rats concurrently exposed to high doses of oral manganese and restraint stress. Toxicology. 2005;211(1–2):59–69. doi: 10.1016/j.tox.2005.02.010. [DOI] [PubMed] [Google Scholar]
- Vezér T, Kurunczi A, Naray M, Papp A, Nagymajtenyi L. Behavioral Effects of Subchronic Inorganic Manganese Exposure in Rats. American Journal of Industrial Medicine. 2007;50:841–852. doi: 10.1002/ajim.20485. [DOI] [PubMed] [Google Scholar]
- Vidal L, Alfonso M, Campos F, Faro LRF, Cervantes RC, Duran R. Effects of manganese on extracellular levels of dopamine in rat striatum: an analysis in vivo by brain microdialysis. Neurochemical Research. 2005;30(9):1147–1154. doi: 10.1007/s11064-005-7775-6. [DOI] [PubMed] [Google Scholar]
- Wang Y, Lee JW, Oh G, Grady SR, McIntosh JM, Brunzell DH, Cannon JR, Drenan RM. Enhanced Synthesis and Release of Dopamine in Transgenic Mice with Gain-of-Function α6* nAChRs. Journal of Neurochemistry. 2014 doi: 10.1111/jnc.12616. [DOI] [PMC free article] [PubMed] [Google Scholar]
- Williams JM, Milatovic D, Gore JC, Aschner M, Avison MJ. Chronic exposure to manganese alters brain responses to amphetamine: a pharmacological magnetic resonance imaging study. Toxicological Sciences. 2010;114(2):310–322. doi: 10.1093/toxsci/kfq002. [DOI] [PMC free article] [PubMed] [Google Scholar]
- Zheng W, Jiang YM, Zhang Y, Jiang W, Wang X, Cowan DM. Chelation Therapy of Manganese Intoxication with para- Aminosalicylic Acid (PAS) in Sprague-Dawley Rats. Neurotoxicology. 2009;30(2):240–248. doi: 10.1016/j.neuro.2008.12.007. [DOI] [PMC free article] [PubMed] [Google Scholar]
- Zheng W, Zhao Q, Slavkovich V, Aschner M, Graziano JH. Alteration of Iron Homeostasis Following Chronic Exposure to Manganese in Rats. Brain Research. 1999;833:125–132. doi: 10.1016/s0006-8993(99)01558-9. [DOI] [PMC free article] [PubMed] [Google Scholar]