Abstract
To determine the rate at which IS6110 restriction fragment length polymorphism (RFLP) patterns in Mycobacterium tuberculosis change over time, we applied a smooth nonparametric survival model to several data sets, including data from previous publications on the rate of change. The results strongly suggest a simple parametric model, with an instantaneous change at time zero and essentially a zero rate of change thereafter. Our interpretation of the results is that at the time of collection of the first isolate, more than one strain is present. We speculate that the selection of mutant strains is most likely during rapid growth, revival of the dormant bacteria, and/or adaptation to a new host. The parameter most accurately describing changing RFLP patterns is the proportion of isolates with band changes, rather than the half-life or the rate of change.
Restriction fragment length polymorphisms (RFLPs) associated with insertions of the IS6110 element into the genome of Mycobacterium tuberculosis are an important tool in epidemiological studies of tuberculosis. It is of practical and theoretical importance to know the rate of change of these fingerprints. A fundamental complication is that the data are inherently interval censored: one can determine that a fingerprint changed during some interval, but not the exact time point at which the change occurred. This complicates the application of survival analysis to this type of data. de Boer et al. (1) assumed an exponential survival model (constant hazard), integrated over observation intervals, and estimated the constant hazard by maximum likelihood. Tanaka et al. (6) refined this analysis by introducing proportionality to the copy number. The validity of the assumption that the rate of change is constant over time has not yet been examined. In this paper, we report the extent to which this assumption is supported by data from The Netherlands, Vietnam, and South Africa as well as by published data from San Francisco, Calif., and Germany. In addition, we explore whether there are alternatives that provide a better explanation of the observed data.
MATERIALS AND METHODS
The following data sets were available and were used for our analysis: serial isolates from 544 tuberculosis patients in The Netherlands, 25 (5%) of which showed a change in the follow-up fingerprint (1); serial isolates from 75 tuberculosis patients in Vietnam with relapses (a repeat episode of tuberculosis after being declared cured) or treatment failures (remaining smear and culture positive after 5 or 8 months of treatment), 15 (20%) of which showed a change in the fingerprint of the second episode (5); and serial isolates from 345 tuberculosis patients in South Africa, 15 (4%) of which showed a change in the subsequent DNA fingerprint (7).
In addition, we used the following isolates from two published reports on the rate of change of IS6110 RFLP patterns: serial isolates taken at least 90 days apart from 49 tuberculosis patients in San Francisco, 12 (24%) of which showed a change in the IS6110 RFLP pattern of the isolate from the second episode (8); and serial isolates from 56 tuberculosis patients in Germany, 5 (9%) of which showed an alteration in the follow-up isolate (4). For the data presented by Yeh et al. (8), we obtained numbers by using the histograms in their paper. Hence, the data were rounded to 50 days for our analysis.
For the data from The Netherlands, details are given in an article by de Boer et al. (1). The hazard was defined as the probability of a change occurring during a discrete time interval, e.g., 10 days. First we developed a smooth nonparametric algorithm for hazard estimation. In this approach, the hazard for each time interval is estimated as a smooth positive function that maximizes the likelihood of the data, using a penalized maximum likelihood algorithm (3). This procedure was applied to each of the five data sets. Special software was written for this analysis by using Matlab (available upon request).
We compared the results of the nonparametric approach (which implies no assumptions about changes of the hazard over time) with the following parametric models: (i) constant hazard (which has been used to date in publications on this subject), (ii) exponentially declining hazard, and (iii) an almost immediate change at the origin (a “hazard impulse”) followed by a constant hazard. We call the latter the impulse model.
The constant hazard model has only one parameter, the level of the hazard. The second model assumes an exponentially decaying hazard and has two parameters: one is the initial level of the hazard and the other is the rate of decline of this hazard over time. The last model has two parameters as well: one is the initial proportion changed and the other is the constant hazard over the period thereafter.
These four explanatory models were compared by using log likelihoods.
RESULTS
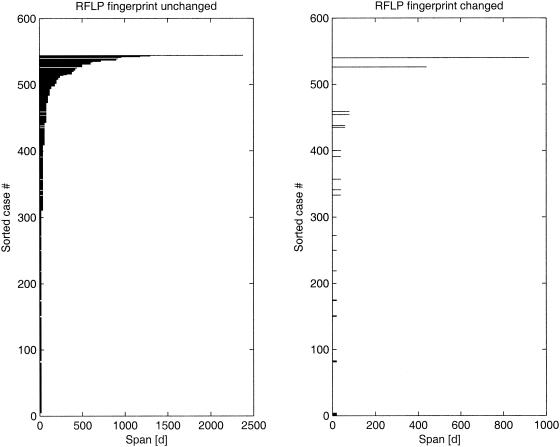
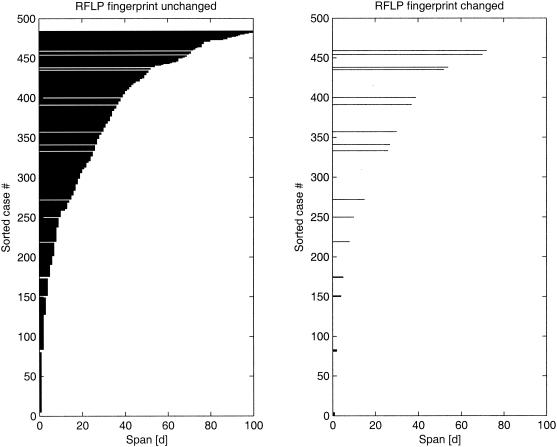
For the nonparametric approach without assumptions about changes in the hazard over time, four of the five data sets showed the same remarkable pattern: a high initial hazard that dropped sharply within a short time (a few weeks or months). For the data from The Netherlands, the hazard showed an initial strong change in the first 200 days (Fig. 1). If we used only the intervals of <100 days, we still saw a very sharp peak near the origin (Fig. 2). This pattern was similar for data from Vietnam, Cape Town, South Africa, and San Francisco, Calif., but different for data from Germany (data not shown). The data set from Germany is sparse, as it includes data for only 5 patients (of 49) with a change in IS6110 fingerprints. By experimenting with the data, we found that adding or removing only one fingerprint change had a strong influence on the estimated hazard curve.
FIG. 1.
Dutch data. Individual intervals are shown sorted, with increases in length from bottom to top. Left, no change; right, change in RFLP.
FIG. 2.
Dutch data (first 100 days). Individual intervals are shown sorted, with increases in length from bottom to top. Left, no change; right, change in RFLP.
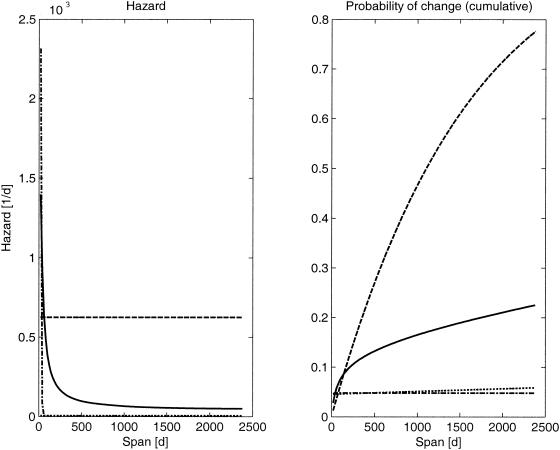
A comparison of the likelihoods of the models showed that the constant hazard assumption gave the poorest results, while the other three models had similar likelihood values (Table 1; Fig. 3). It should be noted here that the exponential model showed a very steep decline of the hazard, which was close to zero within a few weeks.
TABLE 1.
Log likelihoods of hazard modelsa
| Origin of data | Log likelihood for hazard model
|
|||
|---|---|---|---|---|
| Nonparametric | Constant | Exponential | Impulse | |
| Netherlands | −102.2 | −199.2 | −101.4 | −101.4 |
| Vietnam | −38.6 | −40.4 | −38.4 | −38.8 |
| San Francisco | −27.3 | −28.6 | −26.8 | −27.3 |
| Cape Town | −58.6 | −62.2 | −59.5 | −57.1 |
| Germany | −13.4 | −14.0 | −13.7 | −13.8 |
Nonparametric, a nonparametric model of the hazard; constant, the hazard does not change over time; exponential, the hazard decays exponentially with time; impulse, an almost immediate change at the origin, followed by a (low) constant hazard.
FIG. 3.
Model estimates for Dutch data (left panel) and corresponding probabilities of change in RFLP fingerprints (right panel). Full lines, nonparametric model; dashed lines, constant hazard model; dash-dot lines, exponential hazard model; dotted lines, impulse model.
DISCUSSION
This study suggests that, contrary to previous assumptions, changes in RFLP patterns are strongly time-dependent. The data can be more easily explained by an instantaneous change at time zero or by a steep decline of the hazard than by assuming a constant rate of change. Of the three alternative, and more or less equivalent, models, we think the impulse model is the most attractive for its simple interpretation.
The interpretation of the impulse model is that most changes in RFLP patterns occur before diagnosis and that the rate of change during treatment is extremely low. We offer two hypotheses to explain this. First, the rate of change may be proportional to the growth rate of mycobacteria. If this is true, the rate of change during latency should be close to zero. Alternatively (or in addition), adaptation to a new host gives rise to selection pressure and thus may lead to the selection of strains with another RFLP pattern if such a change is accompanied by functional changes in the expression of particular genes. If adaptation to a new host is the main mechanism, no further change should be observed among failure cases. If rapid growth is the major explanation, another impulse may be expected upon treatment failure or a relapse.
Since the rate of change during treatment appears to be extremely low, the proportion of isolates that changed, rather than the half-life or rate of change, should be the parameter of interest. The proportion of isolates with changes in the IS6110 RFLP may vary between settings, possibly due to differences in the delay between the onset of disease and the diagnosis. This suggests that the proportion changed, which can be determined at diagnosis by the fingerprinting of multiple single-strike colonies, might be used as an indicator of the mean delay. However, this proposal first needs validation.
The strength of the evidence strongly depends on the intervals between serial isolates. The Dutch data contain relatively many short intervals, and in that case, the difference in likelihood between the impulse model and the constant hazard model is large. It would be worthwhile to gather more and stronger evidence by investigating RFLP fingerprints repeatedly within short intervals for many patients to estimate the rate of change during the very early phase of treatment. Repeated isolates at the very start of treatment would also allow us to check the hypothesis that a mixture of strains of M. tuberculosis is already present at that moment. That such mixed populations do occur has been shown in a study of low-intensity bands (2).
A consequence of our findings is that it does not make much sense to investigate relationships between the rate of change and patient characteristics or specifics of the RFLP pattern, such as the number of (changed) bands. The rate of change is so high that knowing more about it adds little information. Instead, further research should focus on the changed fraction. In general, it will be hard to get reliable estimates, as this will involve studying subgroups of the already small fraction, about 5%, that shows a change. Very large groups of patients will be needed for such studies.
REFERENCES
- 1.de Boer, A. S., M. W. Borgdorff, P. E. de Haas, N. J. Nagelkerke, J. D. van Embden, and D. van Soolingen. 1999. Analysis of rate of change of IS6110 RFLP patterns of Mycobacterium tuberculosis based on serial patient isolates. J. Infect. Dis. 180:1238-1244. [DOI] [PubMed] [Google Scholar]
- 2.de Boer, A. S., K. Kremer, M. W. Borgdorff, P. E. W. de Haas, H. F. Heersma, and D. van Soolingen. 2000. Genetic heterogeneity in Mycobacterium tuberculosis isolates reflected in IS6110 restriction fragment length polymorphism patterns in low-intensity bands. J. Clin. Microbiol. 38:4478-4484. [DOI] [PMC free article] [PubMed] [Google Scholar]
- 3.Eilers, P. H. C. 1998. Hazard smoothing with B-splines, p. 200-207. In Proceedings of the 13th International Workshop on Statistical Modelling. New Orleans, La.
- 4.Niemann, S., E. Richter, and S. Rüsch-Gerdes. 1999. Stability of Mycobacterium tuberculosis IS6110 restriction fragment length polymorphism patterns and spoligotypes determined by analyzing serial isolates from patients with drug-resistant tuberculosis. J. Clin. Microbiol. 37:409-412. [DOI] [PMC free article] [PubMed] [Google Scholar]
- 5.Quy, H. T., N. T. Lan, M. W. Borgdorff, J. Grosset, P. D. Linh, L. B. Tung, D. van Soolingen, M. Raviglione, N. V. Co, and J. Broekmans. 2002. Drug resistance among failure and relapse cases of tuberculosis: is the standard retreatment regimen adequate? Int. J. Tuberc. Lung Dis. 7:631-636. [PubMed] [Google Scholar]
- 6.Tanaka, M. A., and N. A. Rosenberg. 2001. Optimal estimation of transposition rates of insertion sequences for molecular epidemiology. Stat. Med. 20:2409-2420. [DOI] [PubMed] [Google Scholar]
- 7.Warren, R. M., G. D. van der Spuy, M. Richardson, N. Beyers, C. Booysen, M. A. Behr, and P. D. van Helden. 2002. Evolution of the IS6110-based restriction fragment length polymorphism pattern during the transmission of Mycobacterium tuberculosis. J. Clin. Microbiol. 40:1277-1282. [DOI] [PMC free article] [PubMed] [Google Scholar]
- 8.Yeh, R. W., A. Ponce de Leon, C. B. Agasino, J. A. Hahn, C. L. Daley, P. C. Hopewell, and P. M. Small. 1998. Stability of Mycobacterium tuberculosis DNA genotypes. J. Infect. Dis. 177:1107-1111. [DOI] [PubMed] [Google Scholar]


