

Abstract Abstract
The combination of a vascular endothelial growth factor receptor antagonist, Sugen 5416 (SU5416), and chronic hypoxia is known to cause pronounced pulmonary hypertension (PH) with angioobliterative lesions in rats and leads to exaggerated PH in mice as well. We sought to determine whether weekly SU5416 injections during 3 weeks of hypoxia leads to long-term development of angioobliterative lesions and sustained or progressive PH in mice. Male C57BL/6J mice were injected with SU5416 (SuHx) or vehicle (VehHx) weekly during 3 weeks of exposure to 10% oxygen. Echocardiographic and invasive measures of hemodynamics and pulmonary vascular morphometry were performed after the 3-week hypoxic exposure and after 10 weeks of recovery in normoxia. SuHx led to higher right ventricular (RV) systolic pressure and RV hypertrophy than VehHx after 3 weeks of hypoxia. Ten weeks after hypoxic exposure, RV systolic pressure decreased but remained elevated in SuHx mice compared with VehHx or normoxic control mice, but RV hypertrophy had resolved. After 3 weeks of hypoxia and 10 weeks of follow-up in normoxia, tricuspid annular plane systolic excursion was significantly decreased, indicating decreased systolic RV function. Very few angioobliterative lesions were found at the 10-week follow-up time point in SuHx mouse lungs. In conclusion, SU5416 combined with 3 weeks of hypoxia causes a more profound PH phenotype in mice than hypoxia alone. PH persists over 10 weeks of normoxic follow-up in SuHx mice, but significant angioobliterative lesions do not occur, and neither PH nor RV dysfunction worsens. The SuHx mouse model is a useful adjunct to other PH models, but the search will continue for a mouse model that better recapitulates the human phenotype.
Keywords: pulmonary hypertension; Sugen 5416, hypoxia; animal model; right ventricle
Introduction
Pulmonary hypertension (PH) is a currently fatal condition in which pulmonary vascular remodeling leads to elevated pulmonary arterial pressure, right ventricular (RV) hypertrophy (RVH), and, ultimately, RV dysfunction and failure. The search for small-animal models that recapitulate human PH has proven to be challenging. Although mice have the advantage of being genetically modifiable, rats have a more profound pulmonary vascular and RVH response to virtually every stimulus investigated to date.1 Therefore, the majority of PH animal studies have targeted the chronic hypoxic exposure model or the monocrotaline-induced rat model. More recently, the combination of a vascular endothelial growth factor (VEGF) receptor antagonist, Sugen 5416 (SU5416), and exposure to 3 weeks of chronic hypoxia has been proven to cause profound PH in rats.2,3 In contrast to the chronic hypoxic and monocrotaline-induced PH rat models, the SU5416/hypoxia (SuHx) combination causes angioobliterative lesions in the pulmonary arterioles that are similar to the “plexiform” lesions found in human idiopathic pulmonary arterial hypertension. These lesions, which are not present at the time rats are returned to normoxic conditions after 3 weeks of hypoxia, develop in a progressive fashion over the following months. SuHx rats have sustained and progressive PH, unlike animals that are exposed to hypoxia alone, which eventually revert to the normal phenotype after return to normoxia.4,5
In hopes of using genetically modified mice to define the signaling pathways that promote or defend against PH, the search for a more robust PH mouse model continues. The most commonly studied mouse PH model is exposure to 2 or more weeks of chronic hypoxia (10% oxygen). Recently, Ciuclan et al.6 described a PH mouse model combining weekly treatments of SU5416 with 3 weeks of hypoxic exposure. The authors found that at the end of 3 weeks of hypoxia the SuHx mice had a more profound PH phenotype (RV systolic pressure [RVSP] and RVH) than vehicle-treated hypoxic (VehHx) control mice. Ciuclan et al. reported “various degrees” of occluded pulmonary arterioles immediately after 3 weeks of SuHx but did not quantify these lesions. The authors did investigate a second group of SuHx mice 10 days after completing 3 weeks of hypoxia and returning to normoxic conditions and found that RVSP and RVH had decreased. In contrast, the authors who developed the rat SuHx PH model recently reviewed the literature and reported on their unsuccessful attempts over the last decade to create a reliable mouse PH model based on VEGF receptor blockade and hypoxia.1
In the rat model, VEGF receptor blockade causes endothelial cell apoptosis that is thought to lead to progressive proliferative endotheliopathy.3 Given that in the rat SuHx model angioobliterative lesions develop over 10 weeks after return to normoxia, we hypothesized that VEGF receptor antagonism may take as long or longer to cause angioobliterative lesions in mice. We investigated SuHx and VehHx mice at the end of the 3-week hypoxic exposure and 10 weeks after returning to normoxic conditions and evaluated RV hemodynamics and hypertrophy as well as pulmonary arteriolar histology and structure. We hypothesized that SuHx mice would have sustained PH that may be progressive and accompanied by angioobliterative lesions previously seen in rats.3
Here we show that SuHx causes a more profound PH phenotype in mice than hypoxia alone. The SuHx model is characterized by sustained PH after 10 weeks of recovery in room air but lacks the RV failure and vascular remodeling evident in SuHx rats and in advanced pulmonary arterial hypertension patients.
Methods
Experimental design
All animal experiments were approved by the Boston Children’s Hospital Animal Care and Use Committee. Eleven-week-old male C57BL/6J mice (Charles River Laboratories, Cambridge, MA) were injected subcutaneously with SU5416 suspended with the aid of sonication in a mixture of 0.5% carboxymethylcellulose sodium, 0.9% sodium chloride, 0.4% polysorbate 80, and 0.9% benzyl alcohol in deionized water (all from Sigma, St. Louis, MO). SuHx mice were injected once weekly with SU5416 at 20 mg/kg body weight per dose, and control mice were injected with the same volume of vehicle alone. Mice were exposed to either room air or chronic normobaric hypoxia inside a ventilated plexiglass chamber in which nitrogen was injected under the control of an Oxycycler controller (BioSpherix, Lacona, NY) to maintain an FiO2 of 0.1. CO2 was monitored and ventilation was adjusted so that it did not exceed 5,000 ppm (0.5%). Ammonia was removed by ventilation and activated charcoal filtration through an air purifier.
After 3 weeks of hypoxia and weekly injections of SU5416 or vehicle, animals were either studied and euthanized or returned to normoxia for an additional 10 weeks. At the end of the treatment period and at the end of the 10-week normoxic period, animals were anesthetized and echocardiography, hemodynamic analysis, and tissue harvesting for morphometry and histology were performed (Fig. 1). A small subset of mice (n = 2 per group) was harvested after 3 weeks of hypoxia plus 4 weeks of normoxic recovery.
Figure 1.
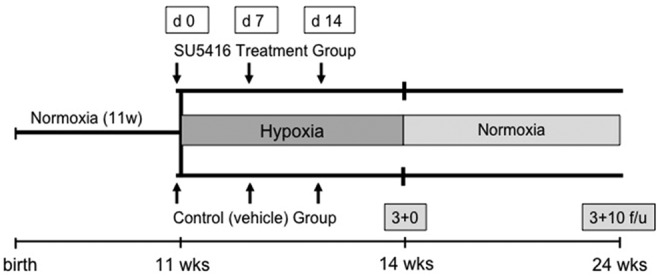
Schematic of the experimental design. SU5416: Sugen 5416; f/u: follow-up.
Echocardiography
A Vevo 2100 ultrasound system and a 40-MHz MicroScan solid state transducer (Visual Sonics, Toronto, ON) were used to obtain images. Chest fur was removed using a depilatory cream. Anesthesia was induced with 3% isoflurane in 100% oxygen and continued at 1%–2% to a goal heart rate (HR) of 350–400 bpm.
The main pulmonary artery (MPA) was visualized in B mode from a modified left parasternal long-axis view. Color Doppler was used to locate an optimal location for MPA velocity measurement. Subsequently, the pulsed-wave Doppler sample volume was placed in the center of the color Doppler MPA signal at the level where the medial aspect of the proximal aorta crosses the MPA. PA acceleration time (PAAT; i.e., the time from the onset of systolic flow to peak pulmonary outflow velocity) was measured.
End-diastolic RV wall thickness (RVWTd) and RV inner diameter (RVIDd) was measured from a modified right parasternal long-axis view. M-mode sample volume was placed across the RV wall perpendicular to the RV long axis at the level of the mitral valve annulus, as described elsewhere.7 Fractional shortening (FS) and HR were determined in the short axis at the level of the papillary muscles in M mode. Cardiac output (CO) was estimated using the Teichholz formula.8 Tricuspid annular plane systolic excursion (TAPSE), the base-to-apex shortening of the RV during systole, was measured using M mode in the four-chamber view as a surrogate for longitudinal systolic RV function.9 The M-mode sample volume was placed across the tricuspid valve annulus near its attachment to the RV free wall.
Hemodynamics
HR, RVSP, and RV dP/dt measurements were performed in spontaneously breathing mice under 2.0%–2.5% isoflurane anesthesia delivered in 100% oxygen with a flow of 2.0 L/min by inserting a 1.4F microtip transducing catheter (Millar Instruments, Houston, TX) via the right jugular vein (closed chest), as described elsewhere10 and reviewed.11
Lung tissue perfusion and histology
Under isoflurane anesthesia, the chest was opened and the pulmonary vasculature was perfused with phosphate‐buffered saline through the beating RV. The heart and lungs were removed en bloc, and the lungs were inflated ex vivo with 4% neutral buffered formalin at a fixed pressure of 20 cm of H2O. After overnight fixation, the left lung was cut longitudinally into three parasagittal sections, and the medial surface of the two lateral sections and the lateral surface of the medial section were marked with nail polish and processed. The marked surfaces were embedded face down, and three 5-μM step sections (200 μm apart) were displayed together on the same slide, as described elsewhere.12
Immunohistochemical staining
Lung tissue sections were deparaffinized in xylene and rehydrated. Immunohistochemical analysis was performed by incubating with the indicated primary antibody at a dilution of 1∶200 (von Willebrand factor [vWF]; rabbit polyclonal anti-human; Chemicon/Millipore, Temecula, CA; VEGF; rabbit polyclonal anti-human) or 1∶125 (α smooth muscle actin [αSMA]; mouse monoclonal; Sigma) overnight at 4°C after 20 minutes of blocking at room temperature to reduce nonspecific binding. Endogenous peroxidase activity was inhibited with 0.3% H2O2 in methanol (Sigma). Incubation with secondary antibodies and peroxidase staining were performed according to the manufacturer’s instructions (Vector Laboratories, Burlingame, CA). Slides were counterstained with methyl green.
Lung parenchymal and pulmonary vascular morphometry and quantification
Lung sections were stained for αSMA. Ten randomly selected areas from 5-μm hematoxylin‐eosin-stained lung sections were captured at 100× magnification using a Nikon Eclipse 80i microscope. Calibrations for the images were done by acquiring standard micrometer images using the same magnification. Large airways and vessels were avoided for lung morphometry. Peripheral vascularization was determined by counting the number of vWF-positive vessels in 15 random images at 200×magnification, stratified by diameter (<50 and 50–100 μm), using Metamorph software (Molecular Devices, Sunnyvale, CA). Vessel wall thickness was assessed by measuring αSMA-positive staining in vessels less than 100 μm in diameter in 10–15 sections per animal captured at 400×magnification. Medial wall thickness was measured using Metamorph software and compared between groups using the following equation: medial thickness index = [(areaext − areaint)/areaext], where areaext and areaint are the areas within the external and internal boundaries of the αSMA layer, respectively. Occluded vessels were identified by observing every 200× field in three vWF-stained longitudinal sections for each of the three step sections (200 μm apart) per animal. Potential obliterated lesions identified with vWF were then observed in αSMA-stained contiguous sections to ensure that the identified vessel was muscularized. Finally, VEGF staining was performed for further characterization, as both rat4 and human13 angioobliterative lesions have been shown to stain positive with this antibody. Vascular morphometry and vessel number calculation were performed in a blinded fashion.
PA barium injections
A subset of lungs were infused with barium via a catheter inserted into the PA to label central and peripheral pulmonary arteries for micro–computed tomography (microCT) imaging, as described elsewhere.10 Barium was prepared by mixing 50 g of gelatin (Sigma) and 400 mL of barium powder (Fisher Scientific, Pittsburgh, PA) in 550 mL of water and was injected at 60°–70°C into the MPA.
CT and three-dimensional PA reconstruction of barium-injected mouse lungs
The basic method of microCT in vitro imaging has been described elsewhere.10 For this study, a Micro CAT II computer tomograph (Siemens, Malvern, PA) and RVA software was used. Formalin-fixed left lungs were each placed in an empty 50-mL Falcon tube and centered in the scanner by creating anterior-posterior and lateral X-ray images. A field of view of 768 × 768 voxels (1 voxel = 0.023 mm) was chosen. The left lungs were fully scanned ex vivo at a 45-μm resolution (binning = 2) and 512 views (62 kVp, 1,200-ms single-image acquisition time) followed by real-time three-dimensional reconstruction, as described elsewhere.7 Subsequently, Amira software (ver. 4.1) was applied on the three-dimensional images. Isosurface rendering at a threshold of 1,000 arbitrary units and appropriate positioning allowed display of all lungs in anterior-posterior views with best demonstration of segmental and peripheral branching of the left PA.
Heart weights
Atria were trimmed, and RVH was measured by weighing the RV relative to the left ventricle (LV) plus septum (LV+S) and the RV or LV+S relative to the animal’s body weight.
Statistical analysis
All values are expressed as means ± SEM. Comparison between different groups was performed by one-way analysis of variance followed by Tukey’s multiple-comparison test using GraphPad Prism software (ver. 5.0; GraphPad, La Jolla, CA). Differences with P < 0.05 were considered significant.
Results
Pulmonary hypertension
To investigate the development of PH in the SuHx model in the short and long term, RVSP as an indicator of PAP was determined in spontaneously breathing mice with a microtip Millar catheter inserted through the jugular vein (closed chest technique). Both SuHx and VehHx mice manifested significant RV hypertension after 3 weeks of hypoxia, but SuHx mice developed significantly higher RVSP than VehHx animals. After 10 weeks of normoxic recovery, SuHx mice continued to have significantly elevated RVSP compared with VehHx and normoxic mice, but the average RVSP in the SuHx group declined from 45 to 30 mmHg over the 10 weeks. Meanwhile, RVSP in the VehHx group returned to normal levels at the 10-week follow-up time point in room air (22 mmHg; Fig. 2A; Table 1). Although a lower LV FS was noted for both VehHx and SuHx mice at 3 weeks (Table 1), HR and LV CO were unaffected, suggesting that functional differences in the LV did not contribute to the elevation in RVSP present in SuHx mice. A small subset of animals (n = 2 per group) was catheterized after 4 weeks of normoxic recovery, and their RVSP had already decreased to the 10-week recovery levels (Fig. 2A; not included in statistical analysis). PAAT, an echocardiographic PW-Doppler measurement that has been inversely correlated with PA pressure and pulmonary vascular resistance, was significantly decreased in both SuHx and VehHx mice after 3 weeks of hypoxia compared with normoxic controls. After 10 weeks of recovery in normoxia, PAAT returned to baseline in both VehHx and SuHx mice (Fig. 2B).
Figure 2.
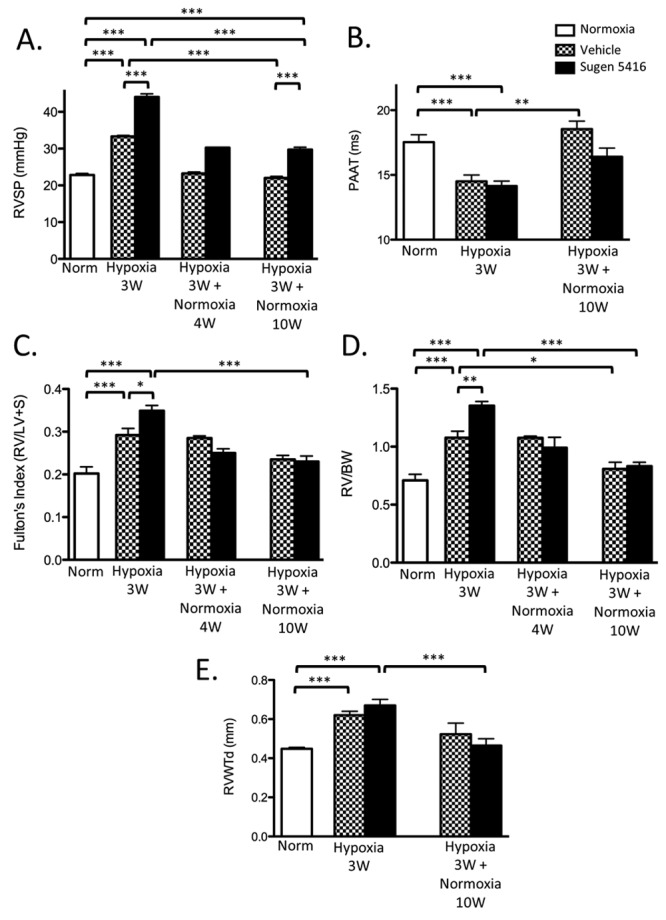
Right ventricle systolic pressure (RVSP) and right ventricle (RV) weight changes after 3 weeks of hypoxia and after 10 weeks of normoxic follow-up. A, RVSP. N = 4–6 mice per group except for 4-week interim follow-up (n = 2, not included in statistical analysis). B, Pulmonary artery acceleration time (PAAT). N = 5–17 mice per group. C, D, Fulton’s index (C) and RV weight/body weight (BW) ratio (D). N = 5–12 mice per group except for 4-week interim follow-up (n = 2, not included in statistical analysis). E, End-diastolic RV wall thickness (RVWTd). N = 5–17 mice per group. All comparisons were made by one-way analysis of variance with Tukey’s posttest. LV+S: left ventricle plus septum. Three asterisks indicate P < 0.001, two asterisks indicate P < 0.01, and one asterisk indicates P < 0.05.
Table 1.
Catheterization, heart weight, and echocardiographic measurements
| Normoxia | SuHx 3w | VehHx 3w | SuHx 3w+10w norm | VehHx 3w+10w norm | n | |
|---|---|---|---|---|---|---|
| Hemodynamics | ||||||
| RVSP, mmHg | 22.81 ± 0.44 | 44.05 ± 0.85*** | 33.33 ± 0.29***,### | 29.71 ± 0.67***,###,^^^ | 22.03 ± 0.40###,^^^,±±± | 4–6 |
| RV dP/dtmax, mmHg/s | 1,715 ± 205 | 3,063 ± 230** | 2,167 ± 100## | 2,134 ± 316## | 1,730 ± 47 | 4–6 |
| RV dP/dtmin, mmHg/s | −1,580 ± 186 | −3,485 ± 279*** | −1,935 ± 197### | −1,918 ± 338### | −1,478 ± 188 | 4–6 |
| HR, bpm | 498.6 ± 47.5 | 515.3 ± 17.9 | 449.8 ± 14.0 | 537.6 ± 17.1 | 514.3 ± 21.8 | 4–6 |
| Echocardiography | ||||||
| HR PAAT, bpm | 405.1 ± 27.0 | 371.6 ± 10.6 | 371.1 ± 22.8 | 418.8 ± 28.8 | 381.8 ± 29.1 | 4–17 |
| PAAT, ms | 17.54 ± 0.56 | 14.15 ± 0.38*** | 14.51 ± 0.49*** | 16.40 ± 0.67 | 18.55 ± 0.61^^^ | 5–17 |
| RVWTd, mm | 0.448 ± 0.007 | 0.671 ± 0.030*** | 0.620 ± 0.020*** | 0.465 ± 0.034### | 0.523 ± 0.057 | 5–17 |
| RVIDd, mm | 1.500 ± 0.031 | 1.797 ± 0.048*** | 1.581 ± 0.063 | 1.433 ± 0.113### | 1.481 ± 0.128 | 5–16 |
| TAPSE, mm | 1.037 ± 0.032 | 0.7730 ± 0.033*** | 0.971 ± 0.040## | 0.8341 ± 0.057# | 1.051 ± 0.044± | 5–14 |
| HR FS, bpm | 393.3 ± 13.93 | 365.1 ± 11.74 | 358.0 ± 9.022 | 418.8 ± 28.83 | 381.8 ± 29.05 | 5–16 |
| LV FS, % | 43.39 ± 1.86 | 30.55 ± 1.472** | 33.60 ± 4.024* | 35.97 ± 1.946 | 28.77 ± 2.991* | 5–16 |
| LV CO, mL/min | 34.04 ± 2.020 | 30.38 ± 2.791 | 34.64 ± 2.463 | 33.85 ± 3.915 | 31.47 ± 6.583 | 5–16 |
| Weights | ||||||
| Animal weight, g | 25.05 ± 0.61 | 24.43 ± 0.43*** | 24.71 ± 0.53*** | 32.38 ± 1.20### | 33.38 ± 0.59^^^ | 5–12 |
| RV/BW, mg/g | 0.709 ± 0.053 | 1.353 ± 0.037*** | 1.077 ± 0.057***,## | 0.832 ± 0.034### | 0.808 ± 0.057^ | 5–12 |
| Fulton’s index, RV/LV+S | 0.202 ± 0.016 | 0.349 ± 0.012*** | 0.292 ± 0.016***,# | 0.230 ± 0.013### | 0.235 ± 0.010 | 5–12 |
| LV+S/BW, mg/g | 3.501 ± 0.071 | 3.904 ± 0.110* | 3.684 ± 0.076 | 3.620 ± 0.097 | 3.445 ± 0.122 | 5–12 |
Data are mean ± SEM. RVSP: right ventricular systolic pressure; RV: right ventricle; HR: heart rate; PAAT: pulmonary artery acceleration time; RVWTd: end-diastolic right ventricular wall thickness; RVIDd: end-diastolic right ventricular inner diameter; TAPSE: tricuspid annular plane systolic excursion; FS: fractional shortening; LV: left ventricle; CO: cardiac output; BW: body weight; LV+S: left ventricle plus septum. Asterisks indicate comparison with normoxic mice, pound signs indicate comparison with mice treated with Sugen 5416 (SU5416) and exposed to hypoxia for 3 weeks (SuHx 3w), carets indicate comparison with control mice treated with vehicle and exposed to hypoxia for 3 weeks (VehHx 3w), and plus-or-minus signs indicate comparison with mice treated with SU5416, exposed to hypoxia for 3 weeks, and returned to normoxic conditions for 10 weeks (SuHx 3w+10w norm). VehHx 3w+10w norm: control mice treated with vehicle, exposed to hypoxia for 3 weeks, and returned to normoxic conditions for 10 weeks. The number of symbols indicates the significance level (e.g., three asterisks indicate P < 0.001, two asterisks indicate P < 0.01, and one asterisk indicates P < 0.05).
RV weight was increased in SuHx mice compared with VehHx mice after 3 weeks of hypoxia but returned to normoxic baseline levels in both groups after 10 weeks of normoxic recovery (Fig. 2C, 2D). Similarly, RV wall thickness measured by M-mode echocardiography increased in both SuHx and VehHx mice after 3 weeks of hypoxia but returned to baseline values after 10 weeks of recovery in room air (Fig. 2E).
RV dimension and systolic function
To determine the impact of SuHx on RV end diastolic volume and systolic function, RVIDd and TAPSE were measured by M-mode echocardiography (Table 1). RV dilation as judged by RVIDd was found in SuHx mice after 3 weeks of hypoxia compared with baseline normoxic and VehHx controls. After 10 weeks of normoxic recovery, RVIDd in the SuHx mice decreased and was not different from that in normoxic controls (Fig. 3A). An indicator of RV contractility, RV dP/dtmax measured during RV catheterization was significantly increased after 3 weeks of hypoxia in SuHx mice compared with both baseline and VehHx controls and increased in parallel with RVSP and hypertrophy. The latter phenomenon has been observed in several mouse PH studies10,12,14 and represents increased contractility in the hypertensive and hypertrophic RV.14 RV dP/dtmax returned to normoxic values after 10 weeks of recovery from chronic hypoxia (Fig. 3B, upper panel). RV dP/dtmin decreased after 3 weeks of hypoxia in SuHx mice and returned to baseline normoxic levels after 10 weeks of normoxic recovery (Fig. 3B, lower panel). We measured TAPSE, a marker of longitudinal systolic RV function that has been correlated with outcome in humans with PH,15,16 and found that it was significantly reduced after 3 weeks of hypoxia in SuHx mice and continued to remain significantly lower than that in normoxic and VehHx controls after 10 weeks of normoxic recovery (Fig. 3C).
Figure 3.
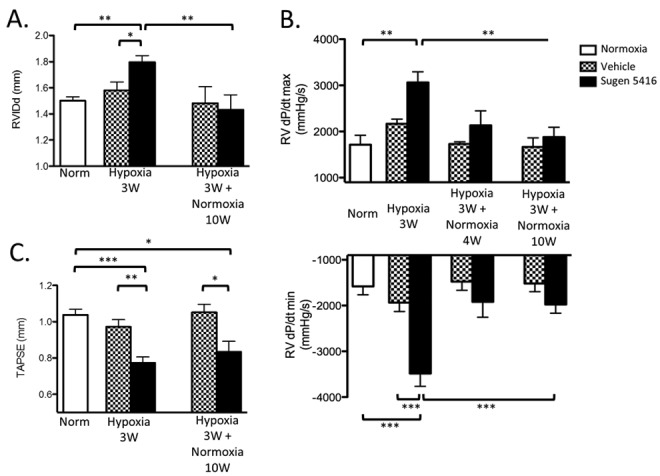
Right ventricle (RV) dilation and functional parameters in the Sugen 5416/hypoxia mouse model. A, End-diastolic RV inner diameter (RVIDd). N = 5–16 mice per group. B, RV dP/dtmax (upper panel) and dP/dtmin (lower panel). N = 4–6 mice per group. C, Tricuspid annular plane systolic excursion (TAPSE). N = 5–17 mice per group. All comparisons were made by one-way analysis of variance with Tukey’s posttest. Three asterisks indicate P < 0.001, two asterisks indicate P < 0.01, and one asterisk indicates P < 0.05.
Pulmonary vascular changes
We assessed vessel wall hypertrophy by staining for αSMA. αSMA-stained medial wall blood vessel thickness increased significantly in both SuHx and VehHx mice after 3 weeks and returned to baseline levels in both groups after 10 weeks of normoxic recovery (Fig. 4A, 4B). Ex vivo CT angiography of barium-injected lungs showed vascular pruning in SuHx mice compared with VehHx mice after 3 weeks of hypoxia (Fig. 5A). Given this finding, we assessed the number of pulmonary arterioles by counting vWF-stained vessels. The number of pulmonary arterioles per 200× field was significantly reduced after 10 weeks of normoxic recovery in SuHx mice compared with that in VehHx and normoxic controls (Fig. 5B).
Figure 4.
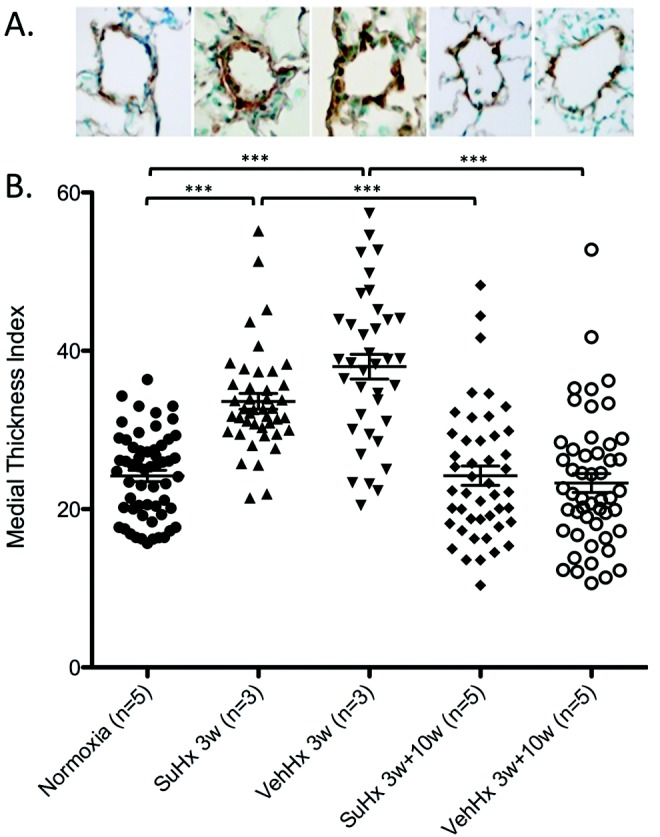
Pulmonary arteriolar remodeling is similar in Sugen 5416–treated hypoxic (SuHx) mice compared with that in vehicle-treated hypoxic (VehHx) control mice. A, Representative α smooth muscle actin–stained pulmonary arterioles from groups in the graph below. B, Medial wall thickness index. Data points represent individual vessels measured in the number of mice indicated. All comparisons were made by one-way analysis of variance with Tukey’s posttest. Three asterisks indicate P < 0.001, two asterisks indicate P < 0.01, and one asterisk indicates P < 0.05.
Figure 5.
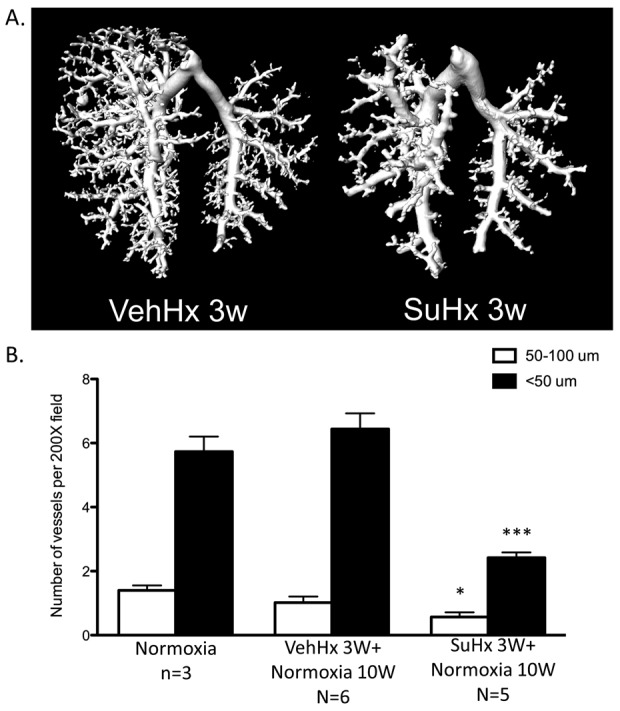
Loss of small pulmonary arteries in Sugen 5416–treated hypoxic (SuHx) mice. A, Barium contrast computed tomography pulmonary angiogram of vehicle-treated hypoxic (VehHx) control mice and SuHx mice after 3 weeks of hypoxia. Images are representative of n = 3 mice per group. B, Quantification of <50- and 50–100-μm pulmonary arteries in SuHx and VehHx mice after a 10-week normoxic follow-up period. All comparisons were made by one-way analysis of variance with Tukey’s posttest. Three asterisks indicate P < 0.001, and one asterisk indicates P < 0.05.
Pulmonary arteriolar lesions
A total of 1,001 vWF-stained lung fields were observed at 200× magnification in 5 SuHx and 6 VehHx mice that had been recovered in normoxia for 10 weeks. We evaluated 298 vWF-stained lung fields from 3 normoxic mice for comparison. A total of 5 pulmonary vessels obliterated with cellular material were found from 2 different SuHx mice, while none were found in VehHx or normoxic mice (Table 2). On adjacent 50-μm sections within the same 200-μm step section, the obliterated vessel was observed with αSMA and VEGF staining (Fig. 6).
Table 2.
Analysis of obliterative lesions in normoxic mice; in mice treated with Sugen 5416, exposed to hypoxia for 3 weeks, and returned to normoxic conditions for 10 weeks (SuHx 3w+10w norm); and in control mice treated with vehicle, exposed to hypoxia for 3 weeks, and returned to normoxic conditions for 10 weeks (VehHx 3w+10w norm)
| Condition | No. of animals | No. of 200× fields observed | No. of obliterated vessels |
|---|---|---|---|
| Normoxia | 3 | 297 | 0 |
| SuHx 3w+10w norm | 5 | 468 | 5 |
| VehHx 3w+10w norm | 6 | 533 | 0 |
Figure 6.

Five obliterative lesions found in 2 Sugen 5416–treated hypoxic (SuHx) mice 10 weeks after completing hypoxic exposure. For animal A, right ventricle systolic pressure (RVSP) of 30.3 mmHg, Fulton’s index of 0.20, and right ventricular weight/body weight (RV/BW) ratio of 0.78 mg/g; for animal B, RVSP of 30.2 mmHg, Fulton’s index of 0.24, and RV/BW ratio of 0.89 mg/g. Each lesion is stained in contiguous 5-μm sections with von Willebrand factor (vWF), α smooth muscle actin (αSMA), and vascular endothelial growth factor (VEGF) antibodies.
Discussion
The search for better animal models of PH continues because our understanding of the pathobiology of disease and the development of new therapeutic strategies depends on robust animal models, and to date no single model has all the features of human disease.17,18 One important feature of advanced human pulmonary hypertensive vascular disease is the presence of angioobliterative lesions, and these have been found to develop over a period of several months after SuHx rats are returned to normoxic conditions.4 To determine whether a similar process occurs in mice, we investigated the mouse PH model of SU5416 combined with chronic hypoxia at the end of a 10-week normoxic follow-up period. The magnitude of PH (RVSP) decreased by 25% during the first 4 weeks of recovery in room air but was then sustained at approximately 30 mmHg in SuHx mice compared with VehHx controls. Pulmonary vascular lesions and PH did not progressively worsen in SuHx mice during normoxic recovery. While we found a small number of occlusive arteriolar lesions in SuHx mice and none in normoxic or VehHx mice 10 weeks after the end of hypoxia, these were very rare and thus unlikely to have contributed greatly to PH in these animals. In contrast to Ciuclan et al.,6 we did not observe any angiobliterative lesions in SuHx mice after 3 weeks of hypoxia. Hence, according to our results, SuHx produces sustained PH and moderate RV dysfunction as judged by TAPSE but no significant angioobliterative pulmonary vascular disease in mice.
The pulmonary arteriolar medial wall thickening that we demonstrated probably contributed to the development of increased RVSP in both SuHx and VehHx mice at the end of 3 weeks of hypoxia. Interestingly, the sustained elevation in RVSP seen in SuHx mice is not likely to be a result of pulmonary arteriolar medial hypertrophy or hyperplasia since pulmonary arteriolar αSMA-stained medial wall thickness returned to normal by 10 weeks after SuHx treatment. A significant reduction in the number of arterioles in SuHx mice persisted at 10 weeks, as assessed by analysis of vWF-stained vessels. Loss of precapillary arterioles is known to be involved in the pathogenesis of PH.19,20 Zhao et al.21 used microangiography to demonstrate a loss of small peripheral pulmonary arteries that had already begun by a very early time point in the monocrotaline rat model, and a “mild rarefaction” or loss of small PAs has been reported in chronically hypoxic mice as well.22,23 We found evidence of vascular pruning after 3 weeks of SuHx using barium-injected CT angiography. The dropout of small PAs in PH is hypothesized to be the result of endothelial cell apoptosis.19,20 The combination of VEGF receptor antagonism and hypoxia is thought to lead to the development of angioobliterative lesions in rats by causing endothelial cell apoptosis that allows apoptosis-resistant endothelial cells to multiply. The loss of small PAs because of endothelial cell apoptosis in the SuHx mouse model is therefore not surprising. Studies in SuHx rats have reported a substantial number of occluded pulmonary arterioles (<50 μm) after only 2 weeks of hypoxia that increases after 2 weeks of normoxic recovery,5 but the total number of vessels per field or per alveoli has not been reported in the rat SuHx model. We hypothesize that sustained vascular pruning is responsible for the continued elevation in RVSP 10 weeks after SuHx treatment, while reversal of arteriolar medial hypertrophy in normoxia is responsible for the reduction in RVSP from the SuHx 3-week time point.
At the end of 3 weeks of hypoxia, RVSP was elevated and PAAT was decreased in SuHx compared with normoxic control mice, consistent with higher PA pressure; RVSP was higher in SuHx compared with VehHx mice, whereas PAAT was similarly reduced in these two groups. After 10 weeks of normoxic recovery, SuHx mice had higher RVSP than VehHx mice. The persistent elevation in RVSP in the SuHx mice after 10 weeks of normoxic recovery may be related to decreased vessel density. PAAT increased over the 10-week normoxic recovery in both groups, and although SuHx mice had lower PAAT than VeHx mice after 10 weeks of recovery, this difference was not significant. PAAT is known to become shorter with higher RV and PA pressure in both humans and animals,24-32 and it is a useful marker of PH in small animals that do not reliably develop quantifiable tricuspid regurgitation. PAAT has been hypothesized to be shorter in PH because of the reduced compliance and increased impedance of the pulmonary arterial system,33 and it may provide additional information about these important parameters (compliance and impedance) when compared with invasively measured RV pressure. It is also possible that PAAT does not have enough sensitivity to distinguish between RV pressures of 34 and 45 mmHg.32 In contrast to our study, Ciuclan et al.6 did find a significantly lower PAAT in SuHx mice after 3 weeks of hypoxia compared with VehHx mice, but the VehHx mice in that study had a normal PAAT after 3 weeks of hypoxia despite having an elevated RVSP of 35 mmHg, which is not consistent with the literature32 and our results.
In addition to developing progressive pulmonary vascular angioobliterative lesions and PH, rats exposed to SuHx develop progressive RV dysfunction and failure.34,35 Our assessment of RV dilation and performance in these mice included RV end-diastolic diameter, RV dP/dt, and TAPSE. RV dilation was increased in SuHx mice after 3 weeks of hypoxia and returned to baseline after 10 weeks of normoxic recovery. In accordance with several other PH mouse models,10,12,14 RV dP/dtmax increased with elevated afterload, indicating heightened contractility in SuHx mice that returned to baseline after 10 weeks of normoxia. Interestingly, TAPSE was significantly decreased in SuHx mice and remained significantly lower than that in both VehHx and normoxic controls after 10 weeks of normoxic recovery, indicating sustained longitudinal systolic RV dysfunction. Others have also found discordance between RV dP/dt and RV systolic function in mouse PH models. In a study using admittance pressure-volume catheterization of the RV in mice, Tabima et al.14 reported that hypoxia caused an increase in RV dP/dtmax and a decrease in RV dP/dtmin while at the same time causing reduced RV ejection fraction and RV CO, which they attributed to a decrease in chamber compliance. Unlike the concentric contraction of the LV, the RV contracts in a bellows-like, base-to-apex, longitudinal fashion, and its function is difficult to quantify with any two-dimensional echocardiographic measurement. In advanced RVH, however, radial forces increasingly contribute to RV ejection and wall stress and thus may explain the increased systolic pressure rise (dP/dt) in the setting of increased RV weight and decreased longitudinal systolic function (TAPSE).36
TAPSE has not been widely reported in mice, but a recent study evaluating RV dysfunction in mice with induced LV myocardial infarction showed a decrease in TAPSE similar to ours that persisted 10 weeks after myocardial infarction.37 The persistent reduction in TAPSE after 10 weeks of normoxic recovery is intriguing and worthy of further investigation. It is unclear whether TAPSE remains impaired as a result of continued elevation of RVSP or because of a more direct effect of VEGF receptor blockade and hypoxia on the RV myocardium.
Mice treated with SU5416 once weekly during 3 weeks of chronic hypoxia do not progressively develop angioobliterative lesions during 10 weeks of normoxic recovery. We searched three parasagittal sections of lung tissue sectioned in three 200-μm “steps” and were able to find only a very small number of putative angioobliterative lesions (in a total of 468 fields analyzed). One major difference between these murine lesions and those described in SuHx rats and humans with PH is the absence of concentric medial or intimal proliferation associated with occlusion of small PAs. To date, the only mouse model in which widespread angioobliterative lesions and concentric neointimal hyperplasia are reported to develop is the interleukin 6–overexpressing mouse exposed to chronic hypoxia,1,23 although a small percentage (5%) of mice overexpressing the calcium binding protein S100A4/Mts1 have also been found to have these lesions at baseline (without hypoxia).38 It is interesting that SuHx mice do not develop a significant number of angioobliterative lesions while SuHx rats treated with a similar or less intense regimen (3 weekly injections during hypoxia compared with 1) do. The weaker mouse angioobliterative response to SU5416/hypoxia is consistent with known species differences in response to other PH models (monocrotaline, hypoxia). Several groups have hypothesized that the presence of a bronchial circulation in rats may allow delivery of detrimental progenitor cells to the pulmonary arterial adventitia that contribute to the concentric medial and intimal thickening and angioobliterative lesions.1 The development of angioobliterative lesions and concentric intimal and medial hyperplasia in the interleukin 6–overexpressing hypoxic mouse would argue against a causal anatomic difference, and it perhaps suggests the importance of differences in the inflammatory cascade, among other mechanisms.
As a mouse model of PH, the SuHx mouse model described by Ciuclan et al.6 and further investigated in this study causes a more profound and sustained PH phenotype than 3 weeks of chronic hypoxia alone. Hence, the SuHx mouse model is a useful adjunct to other PH models, particularly when genetic modification or long-term intervention (pharmacotherapy or stem cell– or progenitor cell–based therapy) is desired. The search continues, however, for a mouse model that more closely recapitulates human disease, particularly in terms of obliterative arteriopathy, progression of pulmonary vascular disease, and progressive, severe RV dysfunction, ultimately resulting in RV failure.
Acknowledgments
We thank Xianlan Liu for her expert technical assistance with the mouse breeding and hypoxic exposure.
Source of Support: This work was supported in part by National Institutes of Health grants RO1 HL055454 and RO1 HL085446 to SK and by German Research Foundation (DFG; HA 4348/2-1) and Children’s Heart Foundation (Stiftung KinderHerz, Germany, 2511-6-13-011) grants to GH.
Conflict of Interest: None declared.
References
- 1.Gomez-Arroyo J, Saleem SJ, Mizuno S, et al. A brief overview of mouse models of pulmonary arterial hypertension: problems and prospects. Am J Physiol Lung Cell Mol Physiol 2012;302:L977–L991. [DOI] [PMC free article] [PubMed]
- 2.Taraseviciene-Stewart L, Kasahara Y, Alger L, et al. Inhibition of the VEGF receptor 2 combined with chronic hypoxia causes cell death–dependent pulmonary endothelial cell proliferation and severe pulmonary hypertension. FASEB J 2001;15:427–438. [DOI] [PubMed]
- 3.Nicolls MR, Mizuno S, Taraseviciene-Stewart L, et al. New models of pulmonary hypertension based on VEGF receptor blockade–induced endothelial cell apoptosis. Pulm Circ 2012;2:434–442. [DOI] [PMC free article] [PubMed]
- 4.Abe K, Toba M, Alzoubi A, et al. Formation of plexiform lesions in experimental severe pulmonary arterial hypertension. Circulation 2010;121:2747–2754. [DOI] [PubMed]
- 5.Oka M, Homma N, Taraseviciene-Stewart L, et al. Rho kinase–mediated vasoconstriction is important in severe occlusive pulmonary arterial hypertension in rats. Circ Res 2007;100:923–929. [DOI] [PubMed]
- 6.Ciuclan L, Bonneau O, Hussey M, et al. A novel murine model of severe pulmonary arterial hypertension. Am J Respir Crit Care Med 2011;184:1171–1182. [DOI] [PubMed]
- 7.Hansmann G, Fernandez-Gonzalez A, Aslam M, et al. Mesenchymal stem cell–mediated reversal of bronchopulmonary dysplasia and associated pulmonary hypertension. Pulm Circ 2012;2:170–181. [DOI] [PMC free article] [PubMed]
- 8.Teichholz LE, Kreulen T, Herman MV, Gorlin R. Problems in echocardiographic volume determinations: echocardiographic-angiographic correlations in the presence of absence of asynergy. Am J Cardiol 1976;37:7–11. [DOI] [PubMed]
- 9.Hardziyenka M, Campian ME, de Bruin-Bon HA, Michel MC, Tan HL. Sequence of echocardiographic changes during development of right ventricular failure in rat. J Am Soc Echocardiogr 2006;19:1272–1279. [DOI] [PubMed]
- 10.Hansmann G, Wagner RA, Schellong S, et al. Pulmonary arterial hypertension is linked to insulin resistance and reversed by peroxisome proliferator–activated receptor-γ activation. Circulation 2007;115:1275–1284. [DOI] [PubMed]
- 11.Ryan J, Bloch K, Archer SL. Rodent models of pulmonary hypertension: harmonisation with the World Health Organisation’s categorisation of human PH. Int J Clin Pract Suppl 2011;Aug:15–34. [DOI] [PubMed]
- 12.Hansmann G, de Jesus Perez VA, Alastalo TP, et al. An antiproliferative BMP-2/PPARγ/apoE axis in human and murine SMCs and its role in pulmonary hypertension. J Clin Invest 2008;118:1846–1857. [DOI] [PMC free article] [PubMed]
- 13.Jonigk D, Golpon H, Bockmeyer CL, et al. Plexiform lesions in pulmonary arterial hypertension composition, architecture, and microenvironment. Am J Pathol 2011;179:167–179. [DOI] [PMC free article] [PubMed]
- 14.Tabima DM, Hacker TA, Chesler NC. Measuring right ventricular function in the normal and hypertensive mouse hearts using admittance-derived pressure-volume loops. Am J Physiol Heart Circ Physiol 2010;299:H2069–H2075. [DOI] [PMC free article] [PubMed]
- 15.Forfia PR, Fisher MR, Mathai SC, et al. Tricuspid annular displacement predicts survival in pulmonary hypertension. Am J Respir Crit Care Med 2006;174:1034–1041. [DOI] [PubMed]
- 16.Koestenberger M, Nagel B, Avian A, et al. Systolic right ventricular function in children and young adults with pulmonary artery hypertension secondary to congenital heart disease and tetralogy of Fallot: tricuspid annular plane systolic excursion (TAPSE) and magnetic resonance imaging data. Congenit Heart Dis 2012;7:250–258. [DOI] [PubMed]
- 17.Stenmark KR, Meyrick B, Galiè N, Mooi WJ, McMurtry IF. Animal models of pulmonary arterial hypertension: the hope for etiological discovery and pharmacological cure. Am J Physiol Lung Cell Mol Physiol 2009;297:L1013–L1032. [DOI] [PubMed]
- 18.Erzurum S, Rounds SI, Stevens T, et al. Strategic plan for lung vascular research: an NHLBI-ORDR workshop report. Am J Respir Crit Care Med 2010;182:1554–1562. [DOI] [PMC free article] [PubMed]
- 19.Rabinovitch M, Chesler N, Molthen RC. Point:counterpoint: chronic hypoxia-induced pulmonary hypertension does/does not lead to loss of pulmonary vasculature. J Appl Physiol 2007;103:1449–1451. [DOI] [PubMed]
- 20.Michelakis ED, Wilkins MR, Rabinovitch M. Emerging concepts and translational priorities in pulmonary arterial hypertension. Circulation 2008;118:1486–1495. [DOI] [PubMed]
- 21.Zhao YD, Courtman DW, Deng Y, Kugathasan L, Zhang Q, Stewart DJ. Rescue of monocrotaline-induced pulmonary arterial hypertension using bone marrow–derived endothelial-like progenitor cells: efficacy of combined cell and eNOS gene therapy in established disease. Circ Res 2005;96:442–450. [DOI] [PubMed]
- 22.Levi M, Moons L, Bouche A, Shapiro SD, Collen D, Carmeliet P. Deficiency of urokinase-type plasminogen activator–mediated plasmin generation impairs vascular remodeling during hypoxia-induced pulmonary hypertension in mice. Circulation 2001;103:2014–2020. [DOI] [PubMed]
- 23.Steiner MK, Syrkina OL, Kolliputi N, Mark EJ, Hales CA, Waxman AB. Interleukin-6 overexpression induces pulmonary hypertension. Circ Res 2009;104:236–244. [DOI] [PMC free article] [PubMed]
- 24.Yared K, Noseworthy P, Weyman AE, McCabe E, Picard MH, Baggish AL. Pulmonary artery acceleration time provides an accurate estimate of systolic pulmonary arterial pressure during transthoracic echocardiography. J Am Soc Echocardiogr 2011;24:687–692. [DOI] [PubMed]
- 25.Jones JE, Mendes L, Rudd MA, Russo G, Loscalzo J, Zhang YY. Serial noninvasive assessment of progressive pulmonary hypertension in a rat model. Am J Physiol Heart Circ Physiol 2002;283:H364–H371. [DOI] [PubMed]
- 26.Bonnet P, Bonnet S, Boissiere J, et al. Chronic hypoxia induces nonreversible right ventricle dysfunction and dysplasia in rats. Am J Physiol Heart Circ Physiol 2004;287:H1023–H1028. [DOI] [PubMed]
- 27.Urboniene D, Haber I, Fang YH, Thenappan T, Archer SL. Validation of high-resolution echocardiography and magnetic resonance imaging vs. high-fidelity catheterization in experimental pulmonary hypertension. Am J Physiol Lung Cell Mol Physiol 2010;299:L401–L412. [DOI] [PMC free article] [PubMed]
- 28.Koskenvuo JW, Mirsky R, Zhang Y, et al. A comparison of echocardiography to invasive measurement in the evaluation of pulmonary arterial hypertension in a rat model. Int J Cardiovasc Imaging 2010;26:509–518. [DOI] [PMC free article] [PubMed]
- 29.Kitabatake A, Inoue M, Asao M, et al. Noninvasive evaluation of pulmonary hypertension by a pulsed Doppler technique. Circulation 1983;68:302–309. [DOI] [PubMed]
- 30.Dabestani A, Mahan G, Gardin JM, et al. Evaluation of pulmonary artery pressure and resistance by pulsed Doppler echocardiography. Am J Cardiol 1987;59:662–668. [DOI] [PubMed]
- 31.Isobe M, Yazaki Y, Takaku F, et al. Prediction of pulmonary arterial pressure in adults by pulsed Doppler echocardiography. Am J Cardiol 1986;57:316–321. [DOI] [PubMed]
- 32.Thibault HB, Kurtz B, Raher MJ, et al. Noninvasive assessment of murine pulmonary arterial pressure: validation and application to models of pulmonary hypertension. Circ Cardiovasc Imaging 2010;3:157–163. [DOI] [PMC free article] [PubMed]
- 33.Okamoto M, Miyatake K, Kinoshita N, Sakakibara H, Nimura Y. Analysis of blood flow in pulmonary hypertension with the pulsed Doppler flowmeter combined with cross sectional echocardiography. Br Heart J 1984;51:407–415. [DOI] [PMC free article] [PubMed]
- 34.Bogaard HJ, Natarajan R, Henderson SC, et al. Chronic pulmonary artery pressure elevation is insufficient to explain right heart failure. Circulation 2009;120:1951–1960. [DOI] [PubMed]
- 35.Bogaard HJ, Natarajan R, Mizuno S, et al. Adrenergic receptor blockade reverses right heart remodeling and dysfunction in pulmonary hypertensive rats. Am J Respir Crit Care Med 2010;182:652–660. [DOI] [PubMed]
- 36.Mertens LL, Friedberg MK. Imaging the right ventricle—current state of the art. Nat Rev Cardiol 2010;7:551–563. [DOI] [PubMed]
- 37.Toldo S, Bogaard HJ, Van T, et al. Right ventricular dysfunction following acute myocardial infarction in the absence of pulmonary hypertension in the mouse. PLoS ONE 2011;6:e18102. [DOI] [PMC free article] [PubMed]
- 38.Greenway S, van Suylen RJ, Du Marchie Sarvaas G, et al. S100A4/Mts1 produces murine pulmonary artery changes resembling plexogenic arteriopathy and is increased in human plexogenic arteriopathy. Am J Pathol 2004;164:253–262. [DOI] [PMC free article] [PubMed]