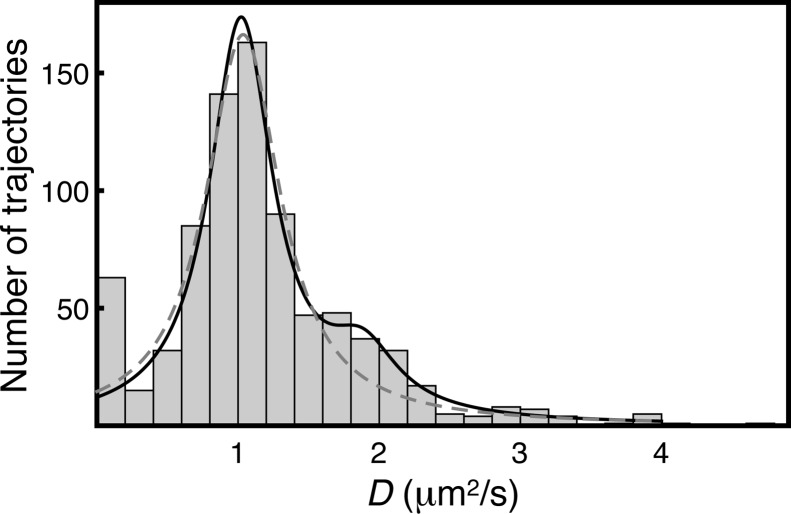
Figure 6.
Bimodal distribution of diffusion constants among trajectories. Diffusion constants were estimated from the mean-square displacement of each trajectory using a Δt value of one frame. Distributions were fit to either a single Lorentzian (eq 6, dashed line) or the sum of two Lorentzian distributions (eq 7, solid line), omitting the small immobile population. Distributions of diffusion constants have been empirically found to fit well to Lorentzian functions.28 The distribution shown encompasses 806 trajectories from one movie of C2AB-WT and is representative of distributions analyzed similarly from three movies of this species.

