Abstract
This paper describes a new approach to detection of microcalcification clusters (MCs) in digital breast tomosynthesis (DBT) via its planar projection (PPJ) image. With IRB approval, two-view (cranio-caudal and mediolateral oblique views) DBTs of human subject breasts were obtained with a GE GEN2 prototype DBT system that acquires 21 projection angles spanning 600 in 30 increments. A data set of 307 volumes (154 human subjects) was divided by case into independent training (127 with MCs) and test sets (104 with MCs and 76 free of MCs). Simultaneous algebraic reconstruction technique with multiscale bilateral filtering (MSBF) regularization was used to enhance microcalcifications and suppress noise. During the MSBF regularized reconstruction, the DBT volume was separated into high frequency (HF) and low frequency components representing microcalcifications and larger structures. At the final iteration, maximum intensity projection was applied to the regularized HF volume to generate a PPJ image that contained MCs with increased contrast-to-noise ratio (CNR) and reduced search space. High CNR objects in the PPJ image were extracted and labeled as microcalcification candidates. Convolution neural network (CNN) trained to recognize the image pattern of microcalcifications was used to classify the candidates into true calcifications and tissue structures and artifacts. The remaining microcalcification candidates were grouped into MCs by dynamic conditional clustering based on adaptive CNR threshold and radial distance criteria. False positive (FP) clusters were further reduced using the number of candidates in a cluster, CNR and size of microcalcification candidates. At 85% sensitivity an FP rate of 0.71 and 0.54 was achieved for view- and case-based sensitivity, respectively, compared to 2.16 and 0.85 achieved in DBT. The improvement was significant (p-value = 0.003) by JAFROC analysis.
Keywords: digital breast tomosynthesis, planar projection image, microcalcification clusters, detection
1. Introduction
The conspicuity of soft tissue lesions such as mass and architectural distortion in digital breast tomosynthesis (DBT) has been widely reported as superior to that in digital mammography (DM). The improved capability of DBT to detect non-calcified cancer compared to DM alone was shown in multiple studies (Ciatto et al., 2013; Haas et al., 2013; Rose et al., 2013; Skaane et al., 2013). However, for microcalcifications, there are mixed observations with the current state of DBT technology. A study (Poplack et al., 2007) of 98 cases including 14 cases of microcalcifications showed that 57% of the microcalcification cases received inferior ratings in DBT compared to those in diagnostic DM. Another study of 37 cases (Andersson et al., 2008) found that the detectability of microcalcifications in DBT was comparable to that in DM but noted the morphological details were more obvious in DM. A study of 119 cases with two observers (Kopans et al., 2011) found that the clarity of microcalcifications in DBT was superior to DM in 41.6%, comparable in 50.4% and inferior in 8% of the cases. An observer study (Spangler et al., 2011) of 100 cases (20 with malignant and 40 with benign calcifications, 40 normal) with five readers found that the detection sensitivity of microcalcifications in DBT was lower than that in DM but the difference did not reach statistical significance. It should be noted that these studies used small data sets with different imaging conditions and/or different DBT systems. Although the reduction of overlapping fibroglandular tissue is beneficial for mass detection, the dependence of the signal strength of microcalcifications in DBT on different design parameters and reconstruction techniques continues to be a topic of investigation (Chan et al., 2014; Lu et al., 2011; Das et al., 2011; Hu and Zhao, 2011; Lu et al., 2010; Sidky et al., 2009; Sechopoulos and Ghetti, 2009).
Microcalcification cluster (MC) is a biomarker for breast cancer (Allred, 2010). Compared to mass, the search for subtle microcalcifications in DBT is more challenging because of their low conspicuity and the large number of images in each view. Studies (Astley et al., 2013; Skaane et al., 2013; Wallis et al., 2012; Zuley et al., 2010; Gur et al., 2009; Good et al., 2008) showed that the reading times for a typical screening workflow increased significantly for DBT or DM+DBT combination. In view of the increased workload, methods have been used or are being developed to assist radiologists in reducing the chance of false negative MCs in DBT interpretation, including acquiring DMs in addition to the DBT for visualization of MCs, synthesis of DM-like images from the DBT in place of DMs, and thick slab views. Regardless of the reading methods, computer-aided detection (CADe) of MCs in the 3D or 2D images may further reduce false negatives.
Detection of MC in DBT by a CADe system has been performed either in projection views (PVs), reconstructed slices or the reconstructed volume. A preliminary evaluation of a CADe system (Bernard et al., 2008) on 50 DBT volumes (13 with MC, 37 normal) reconstructed with filtered back-projection resulted in 1.4 FPs/DBT volume at 85% sensitivity. Another preliminary study of a CADe system on PVs (Reiser et al., 2008) from 60 breasts (30 with MC, 30 normal) achieved a sensitivity of 86% at 1.3 FPs/DBT volume. A recent work on a PV-based system (Wei et al., 2014) resulted in 1.55 FPs/DBT volume from 82 DBT volumes (42 with MC, 40 normal) at 90% sensitivity. Park et al. (Park et al., 2008) compared 2D detection results on the PVs and the reconstructed slices from 96 DBT volumes (20 MCs in PVs, 40 MCs in reconstructed slices). A sensitivity of 70% and 88% for PV and reconstructed slices were achieved at 3.99 and 15.85 FPs/DBT volume, respectively. Our previous work (Samala et al., 2014; Samala et al., 2013; Sahiner et al., 2012) on CADe for MC detection in the reconstructed volume used voxel-wise enhancement-modulated calcification response to detect potential microcalcifications and form MCs. FPs were reduced using several decision criteria based on the characteristics of MCs in a training set of DBT volumes (127 with MC). At 2.16 FPs/DBT volume, a sensitivity of 85% was achieved for an independent test data set of 180 DBT volumes (104 with MCs, 76 normal). Detection of MCs on PV images has the advantage of being independent of reconstruction methods but the low CNR of microcalcifications on the low dose PVs makes it difficult to detect subtle MCs. Conversely, the reconstructed volumes offer better CNR but the detection performance may depend on the selection of reconstruction algorithm and optimization of the parameters.
We have developed a multiscale bilateral filtering (MSBF) regularization method for simultaneous algebraic reconstruction technique (SART) of DBT images to reduce noise and enhanced high frequency signals (Lu et al., 2012b), and designed a CADe system for detection of MCs in the MSBF regularized reconstructed volumes (Samala et al., 2014). In this study, we explored the approach of generating a planar projection (PPJ) image from the high-frequency components of the reconstructed slices, and developed a CADe system to detect the MCs in the PPJ image by exploiting the advantages of this novel image representation. The performance of the CADe system for PPJ image was compared with that for the corresponding DBT volume. This approach of utilizing a PPJ image takes advantage of the improved CNR of the subtle microcalcifications by MSBF reconstruction, while reducing the search space for the CADe system.
2. Materials and methods
2.1. Data set
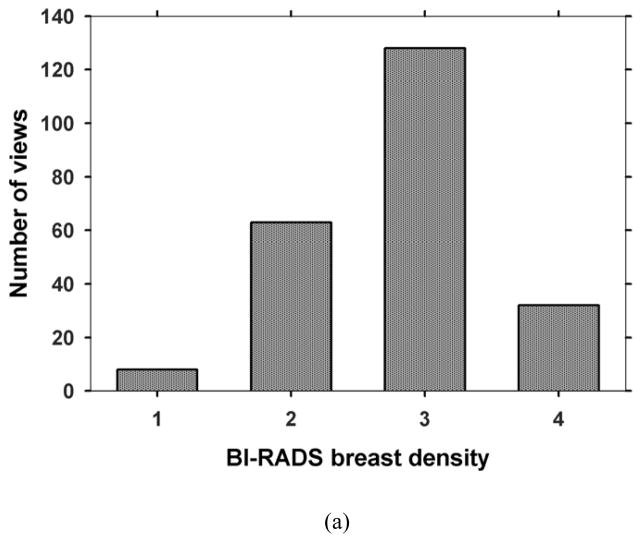
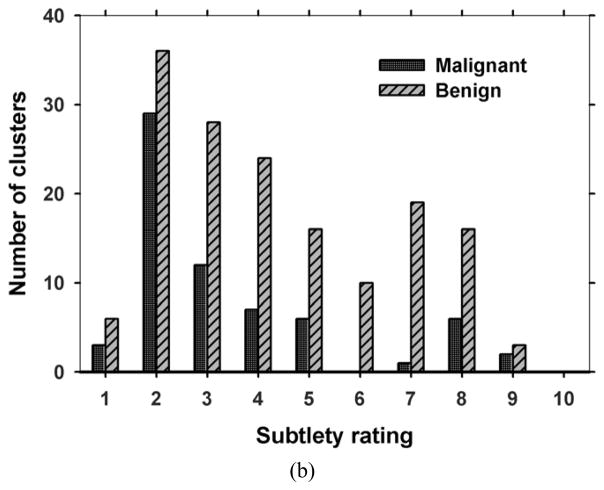
With the approval of Institutional Review Board, patients who were recommended for biopsy of a suspicious (BI-RADS 4 or BI-RADS 5) MC or soft tissue lesion in the breast were recruited with written informed consent in the Department of Radiology at the University of Michigan Health System. For each case, a craniocaudal (CC) view and a mediolateral oblique (MLO) view of the affected breast were taken with a General Electric GEN2 prototype DBT system. The system uses a step-and-shoot design to acquire 21 projections in 3° increments, covering a tomographic angle of 60°. The x-ray source consists of an Rh anode and an Rh filter. Low dose projection mammograms are recorded by a flat panel CsI/a:Si detector with a pixel pitch of 0.1 mm x 0.1 mm. One hundred fifty-four breasts were imaged for this study, including 116 with biopsy-proven MCs (34 malignant, 82 benign) and 38 free of MCs. One view with a malignant MC was lost due to technical difficulties. The acquired DBT data set was divided by case into two independent subsets for training and testing, respectively. The training set consisted of 64 cases (127 views) with 124 MCs and the test set consisted of 52 MC cases with 100 MCs and 38 cases free of MCs (180 views). Each DBT case including the CC and MLO views was exclusively used in either the training or the test set. A Mammography Quality Standards Act (MQSA) approved radiologist marked a 3D box enclosing the biopsy-proven MC in the reconstructed DBT volume based on all clinical data available, and provided a subtlety rating on a scale of 1–10 (1=most visible) for each marked cluster. One of the malignant clusters and 6 of the benign clusters could only be seen in one view so that they were marked and rated on only one view. Fig. 1 shows the distributions of the BI-RADS density categories of 231 views for the breasts with MCs and the subtlety ratings of 66 malignant and 158 benign clusters.
Fig. 1.
Characteristics of data set: (a) BI-RADS density categories of 231 views for the breasts with MCs, (b) subtlety ratings for the 66 malignant and 158 benign clusters. A subtlety rating of 1 corresponds to the most visible cluster.
2.2. Generation of planar projection image
We have shown previously that regularization during reconstruction of DBT improved the conspicuity of microcalcifications (Lu et al., 2012a; Lu et al., 2012b; Lu et al., 2010) and computer detection (Samala et al., 2014). The generation of the PPJ image from the DBT is closely related to the MSBF regularized SART. The SART method and the optimization of the parameters of MSBF-regularized SART have been reported elsewhere (Lu et al., 2012a; Lu et al., 2012b; Zhang et al., 2006). For computer detection of MCs, two iterations of MSBF-regularized SART with relaxation parameter (λ) sequence of 0.5 and 0.3 were chosen for reconstruction of DBT (Samala et al., 2014). The in-plane voxel dimensions are kept at 0.1 mm x 0.1 mm and the slice spacing is constant at 1 mm.
The process for PPJ generation from MSBF-regularized SART is shown in Fig. 2. At the end of each iteration of the SART, each reconstructed DBT slice is separated into high (HF) and low frequency (LF) bands using Laplacian pyramid decomposition (Burt and Adelson, 1983) in three scales. The resulting high frequency bands consist of noise and small structures including microcalcifications. The lower frequency bands consist of background, other larger tissue structures and artifacts. A bilateral filter (BF) (Tomasi and Manduchi, 1998) is applied to the high frequency bands at each scale to enhance the MC and suppress noise. The domain and range kernels of the BF have been chosen (Lu et al., 2012b) to enhance microcalcifications and smooth noise using the contrast-to-noise ratio (CNR) and the full width at half maximum of microcalcifications in breast phantoms as the figures-of-merit. The LF and the filtered HF bands in the Laplacian pyramid are then re-combined into a DBT slice. The DBT slices serve as input to the next iteration of SART.
Fig. 2.
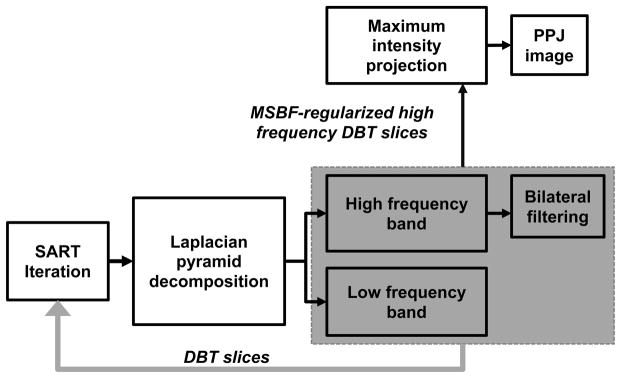
Generation of planar projection (PPJ) image from simultaneous algebraic reconstruction technique (SART) reconstruction of DBT volume using multiscale bilateral filtering (MSBF) regularization.
For the generation of PPJ image, an additional set of high-frequency DBT slices is produced by recombining only the filtered HF bands in the Laplacian pyramid in the final iteration of the SART reconstruction. These high frequency DBT slices therefore do not contain the low frequency structured background of the breast. The PPJ image is then obtained by a maximum intensity projection of the high-frequency DBT volume in the direction perpendicular to the detector plane. The pixel size of the PPJ image is the same as the detector pixel pitch of 0.1 mm X 0.1 mm. The improvement in visual conspicuity of the MC on the PPJ image, compared to that in the DBT slices, can be observed in Fig. 3 for a biopsy-proven case of ductal carcinoma in situ (DCIS).
Fig. 3.

PPJ image of DBT volume with biopsy-proven ductal carcinoma in situ. DBT volume slices from 30–32 are shown. The region shown is 15 x 15 mm (150 x 150 pixels).
In the following discussion, a DBT volume (either CC or MLO view) is defined as the collection of all image slices of the breast volume reconstructed from the 21 projections. A PPJ image is generated from each DBT volume using the process described above.
2.3. Computerized detection of clustered microcalcifications
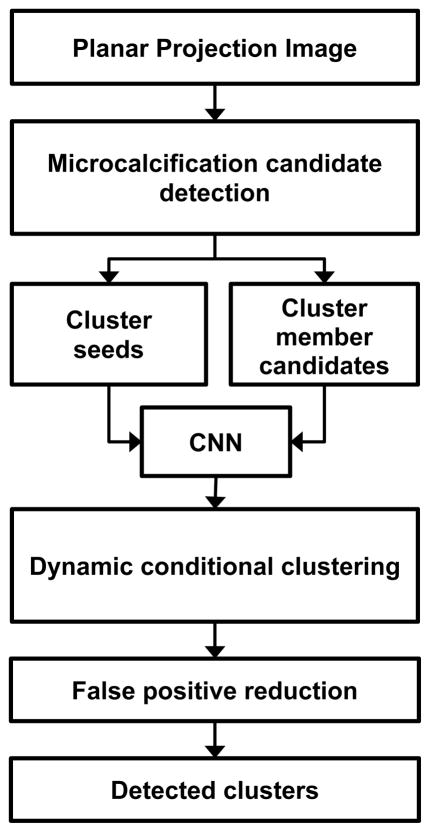
The CADe process can be broadly divided into three phases: generation and screening of microcalcification candidates (Sec. 2.3.1), cluster formation (Sec. 2.3.2) and false positive reduction (Sec. 2.3.3) of clusters as shown in Fig. 4.
Fig. 4.
Schematic of microcalcification cluster detection on PPJ image. CNN: convolution neural network.
2.3.1. Microcalcification candidate detection
Because of the removal of the low frequency band and the MSBF enhancement in the PPJ image, no additional preprocessing for background suppression is necessary. In the PPJ image, iterative gray level thresholding is performed by applying a threshold that automatically steps from high to low value by analysis of the histogram of the PPJ image. At each threshold, the pixels that exceed the threshold value are subjected to region growing using 8-connectivity to form individual objects as microcalcification candidates. The threshold is reduced and the above process is repeated until the number of segmented objects exceeds a desired value Ns. A second stage of segmentation adaptive to the local statistic is then applied to the set of candidate objects to refine the objects. For each object, a 5.1 mm x 5.1 mm region of interest (ROI) is centered at the maximum pixel value location. Starting from this central pixel as the seed location, a pixel i is included as a part of the object if it satisfies the 8-connectivity criterion and its CNR exceeds a threshold, i.e., CNRi > CNRthres., where CNRi is derived from its pixel value Pi, as:
| (1) |
where μg and σg are the mean and standard deviation of the pixel values in the ROI around the pixel excluding any previously segmented objects within the ROI. The CNRobj is defined as the maximum CNR value among all pixels of the segmented object and used as a feature measure of the object. The size and CNR features of the Ns microcalcification candidates after the refined segmentation are used for false positive (FP) reduction in the subsequent stages.
2.3.1.1 Selection of cluster seeds
The Ns segmented objects serve as candidates of cluster seeds and cluster members. They are first ranked by their CNRobj values. The top N candidates (about 10%) with the highest CNRobj values are considered to be indicators of potential cluster locations, referred to as cluster seeds. The N cluster seeds not only include true microcalcifications but also high frequency structures such as edges of fibrous tissue and ducts, as well as artifacts such as the high contrast edges of metal clips from previous biopsy and interplane artifacts from the clips. Examples of true and FP cluster seeds in the training set are shown in Fig. 5.
Fig. 5.
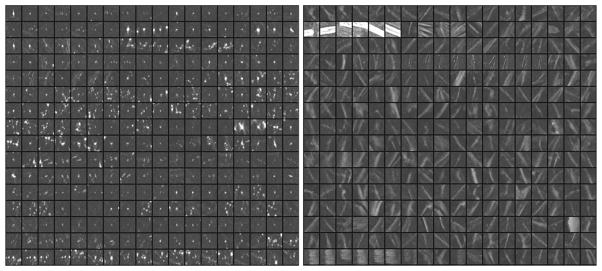
Examples of regions of interest centered at the true microcalcifications (left) and false objects (right) from the N objects in the training set. The ROIs are shown in 3.2 mm x 3.2 mm size and arranged in tile format to facilitate showing the images. The actual ROI area used for CNN training is the central 1.6 mm x 1.6 mm pixels.
2.3.1.2 CNN for reducing false positive cluster seeds
A convolution neural network (CNN) is a type of artificial neural network that can be trained to differentiate patterns of various complexities. Previous studies have shown that a properly trained CNN can effectively reduce FPs for microcalcification detection in mammograms (Chan et al., 1995; Ge et al., 2006; Ge et al., 2007). The PPJ image is similar to a background suppressed mammogram to a certain extent. We therefore expect that FPs can be reduced by screening the cluster seeds with a CNN trained for PPJ images.
A CNN consists of an input layer, multiple hidden layers and an output layer, as shown in Fig. 6. The input to the CNN is an ROI from the PPJ image containing either a true or false microcalcification to be classified. Based on our previous studies, we use CNN architectures with two hidden layers, with the input layer fixed at 1 node group of the same size as the input ROI and the output layer fixed to be a single output node. The two hidden layer nodes are organized in M1 and M2 groups, respectively. The interconnecting weights between a node group in one layer to a node group in the next layer are arranged as filter kernels; the node group values in one layer serve as input image while the node group values in the next layer are generated by a convolution between the filter and the input image, followed by a transformation through an activation function. This allows the response of the nodes in the subsequent layer to be linked to the target pattern relative to its surroundings in the previous layer. There are M1 kernels of size K1 x K1 between the input layer and the first hidden layer and M1 x M2 kernels of size K2 x K2 between the first and second hidden layers. All nodes in the M2 groups of the second hidden layer are fully connected to the single output node. A logistic sigmoid function is used as an activation function at each connection. The network is trained using backpropagation learning rule with sum-of-squares error function. The CNN is trained with a set of ROIs containing TPs and FPs with desired output set to 1 and 0, respectively. For classification of TPs and FPs, a decision threshold on the CNN output values between 0 and 1 may be chosen to separate the two classes, depending on the desired sensitivity and specificity. For simplicity, we denote the CNN architecture as M1-M2-K1-K2 in the following.
Fig. 6.
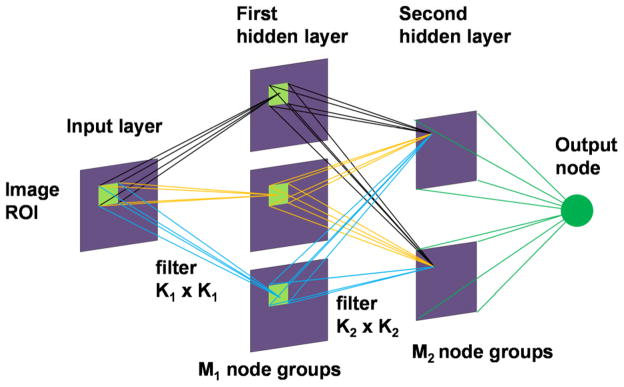
Convolution neural network architecture. Two hidden layers were used in the CNN for FP reduction in PPJ images.
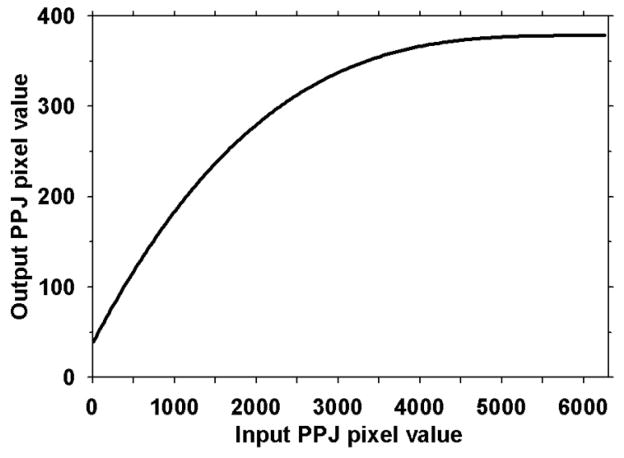
We previously (Chan et al., 1995; Gurcan et al., 2001; Gurcan et al., 2002) performed optimization studies to determine the best CNN architectures and parameters for classification of true microcalcifications and FPs in mammograms. Since the sizes of the microcalcifications in PPJs are similar to those in DMs whereas the characteristics of some FPs are different (e.g., interplane shadows of high contrast objects such as metal clips in PPJ images – see examples in the second and the last row of the FPs in Fig. 5), we trained a new CNN for the PPJ images but limited the search space to three top CNN architectures from our previous studies. An ROI of 1.6 mm x 1.6 mm (16 x16 pixels) centered at the pixel with the maximum CNRobj value of each of the Ns member candidates is automatically extracted from the PPJ image as input to the CNN. Because PPJ image is generated using MSBF and maximum intensity projection of the HF volume, the contrast of some objects in PPJ images are very large. To reduce the range of contrast values of the objects and to increase the CNRs of the subtle objects relative to those of the obvious ones, a nonlinear and convex transformation is applied to the ROI before they are input to the CNN, as shown in Fig. 7. We empirically chose the rising part of a third-order polynomial as the transformation function that maintains a monotonic relationship between the input and output pixel values in the range of interest, with the output pixel value gradually levels off in the region of high input pixel values. A set of cluster seed candidates from the training set was used for training and validation of the CNN.
Fig. 7.
Transformation function for the pixel values in the ROIs from the PPJ images input to the CNN.
2.3.1.3 Adaptive CNR thresholds
From the training set, it was observed that the histogram of the CNRobj of the Ns objects of a given PPJ image can be considered an approximately normal distribution with an extended tail indicating the presence of high contrast objects. The extent of this tail is estimated by the skewness (g) of the CNRobj histogram. Because the distribution of the CNR values of the Ns objects varies from case to case, depending on the x-ray technique, the density of the calcifications and the breast, a set of CNR thresholds (Tt, t = 1, 2, 3) are designed to be adaptive to the distribution in the specific PPJ image:
| (2) |
where, μd and σd are the mean and standard deviation of the distribution. The kt values are chosen based on the types of microcalcifications as shown in Table 1. If g <2.0, kt are increased to set more stringent criteria, i.e., higher thresholds, for medium and obvious CNR objects. The values of kt were estimated experimentally by varying them between 0 and 1 and comparing the rank-sensitivity plots (similar to the process for selection of the number of objects, N, described in Section 3.1) for the training set. Objects with CNRobj lower than the threshold T1 are considered to be noise and eliminated.
Table 1.
kt values used for adaptive CNR threshold based on the skewness (g) of the CNRobj histogram. The Ns objects are categorized into three types as shown.
| Threshold number (t) | Categorization of microcalcifications based on threshold Tt | kt for g ≥ 2.0 | kt for g < 2.0 |
|---|---|---|---|
| 1 | Low CNR calcifications (T1 ≤ CNRobj < T2) | 0.1 | 0.1 |
| 2 | Medium CNR calcifications (T2 ≤ CNRobj < T3) | 0.3 | 0.5 |
| 3 | Obvious CNR calcifications (CNRobj ≥ T3) | 0.4 | 0.5 |
2.3.2. Dynamic conditional clustering of microcalcification candidates
The cluster seeds and member candidates are ranked based on their CNRobj values. The object’s ranking, its distance from a cluster centroid location and CNR thresholds Tt (t =1, 2, 3) for cluster seeds and member candidates are collectively used to form a cluster. The clustering process starts from the highest ranked cluster seed and iteratively searches for new cluster members within a 5 mm radius from the current cluster centroid following the member candidate list based on the CNRobj ranking. The initial cluster centroid is located at the cluster seed and the distance is measured between the cluster seed and the cluster member candidate. With the addition of every new member, the cluster centroid location is updated based on the collective location of the objects in the cluster. The search area dynamically moves and the process continues until the member candidate list is exhausted. The centroid updating process allows a cluster with a diameter greater than 10 mm to be formed. When an object is included as a member in a cluster, it is excluded from the list as a candidate for subsequent cluster formation. The dynamic conditional clustering then starts another cluster from the next location in the cluster seed list. The dynamic clustering has the ability to cluster linear, diffused or regional or grouped (Tse et al., 2008) types of microcalcification distributions.
2.3.3. FP reduction of microcalcification clusters
The size and CNRobj features of microcalcifications and the number of microcalcifications in a cluster are used for FP reduction. Because of the heterogeneous characteristics of microcalcifications and the clusters, a decision tree type of classification was more appropriate for differentiation of TP and FP clusters. Three sets of decision criteria (C1, C2 and C3) are used to identify clusters of different subtlety. C1 is used to identify subtle to obvious clusters, C2 is used to identify medium to obvious clusters and C3 is used to identify clusters that have a seed of strong CNRobj but very few subtle microcalcifications around it. a1, a2, a3 are size thresholds in number of pixels and p1, p2 are thresholds for the number of members in a cluster.
It is assumed for the following cluster types, p1 ≥ p2, a3 ≥ a2 ≥ a1 and T3 ≥ T2 ≥ T1.
C1 for clusters with microcalcifications of small size and low contrast: the number of cluster members with size ≥a1 and CNRobj threshold ≥ T1 should be ≥p1.
C2 for clusters with microcalcifications of medium size and contrast: the number of cluster members with size ≥a2 and CNRobj threshold ≥T2 should be ≥p2.
C3 for clusters with a few microcalcifications of mixed subtlety: a combination of two conditions have to be satisfied: (a) having one or more obvious microcalcifications ≥ T3 and ≥a3, and (b) having other candidates with size ≥a1 and CNRobj threshold ≥T1. The total number of cluster members should be ≥p2.
3. Results
3.1. Comparison of CNRobj between DBT volume and PPJ image
The number of cluster seeds N extracted at the prescreening stage was determined experimentally. A rank-sensitivity plot (Sahiner et al., 2012), which examines the dependence of the fraction of true clusters in the training set that have at least one cluster seed within the bounding box of the true cluster marked by radiologist, was used to guide the selection of N at prescreening. N was varied in the range from 50 to 300 and the value of 50 was chosen based on the best rank-sensitivity plot response. The number of microcalcification candidate objects Ns was taken to be about 10 times of N, or 500. For small breasts that has a breast region less than 150 cm2 on the PPJ image, the N and Ns values are reduced by 65% and 30%, respectively. These values are not very critical as long as the number of candidates extracted will include most of the true microcalcifications while the FP rates are not excessively high to distract the formation of true MCs in the later stages.
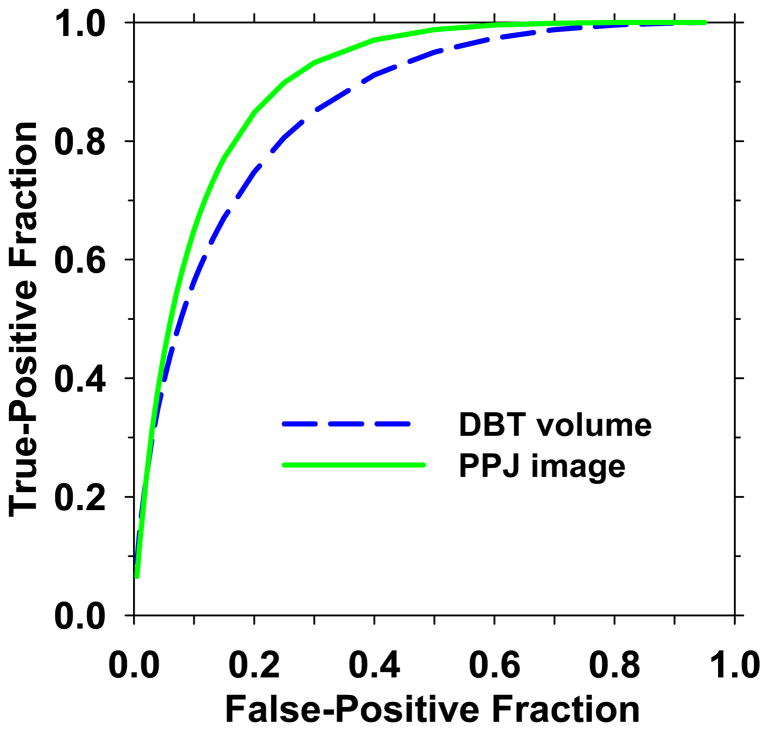
The CNRobj value is the most important feature for a microcalcification to be detected. The CNRobj values between corresponding objects in the MSBF regularization enhanced DBT volume and its PPJ image were compared. Two sets of mutually exclusive objects in the training set were used in the comparison. One set contained individual microcalcifications marked by a medical physicist experienced in breast imaging research in the cluster regions provided by the MQSA radiologist, which were considered true positive (TP) objects. Another set was obtained from the Ns objects detected at the prescreening stage of the CAD system excluding the manually marked locations in the first set, which were considered FP objects. To determine the best CNR threshold, CNRthres, for segmentation of the candidate objects (Section 2.3.1), the separation between the two sets of TP and FP objects was evaluated using the ROCKIT program by Metz et al (Metz et al., 1998) for CNRthres values from 1.5 to 4.0 in increments of 0.5. Based on the area under the receiver operating characteristic (ROC) curve (AUC), CNRthres of 3.0 was chosen for all subsequent steps. For comparison, the CNRobj of the corresponding objects in the DBT volume were calculated in a similar way as that described in Eq. (1) except that a 3D volume of interest of 5.1 mm x 5.1 mm x 5 mm was used instead of the 2D ROI. The CNRthres value for segmentation of the objects in the DBT volumes was previously chosen to be 3.0 (Samala et al., 2014). The ROC curves for differentiation of the TP and FP classes using CNRobj in the DBT volumes and PPJ images are compared in Fig. 8. The AUC value for the PPJ images (0.899±0.008) was significantly higher than that for the DBT volumes (0.858±0.011), indicating the potential of improved MC detection in the PPJ images.
Fig. 8.
ROC curves for CNRobj of objects from DBT volume and PPJ image. The AUC values are 0.858 and 0.899, respectively.
3.2. Training and detection using CNN
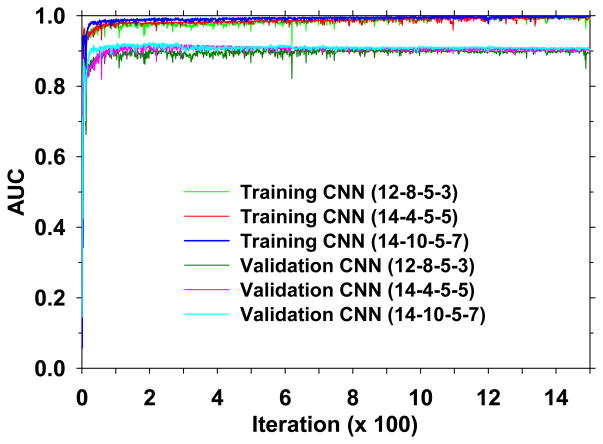
The CNNs were trained to reduce FPs for detection of microcalcifications in the PPJ images. Based on our previous work with CNN for screen-film mammography (Chan et al., 1995) and DM (Ge et al., 2007; Ge et al., 2006), we selected three CNN architectures with the number of node groups and kernel sizes (M1-M2-K1-K2) as (12-8-5-3), (14-4-5-5) and (14-10-5-7). From the training set (127 PPJ images), 40 PPJ images with 294 manually marked microcalcification locations and 38 PPJ images with 414 manually marked microcalcification locations were used as TPs for training and validation, respectively. From the corresponding sets of PPJ images, the computer detected objects at the prescreening stage (N) which did not overlap with the manually marked microcalcification locations were used as FPs for training and validation, respectively. During CNN training, the AUC value for classification of the TPs and FPs was used as figure-of-merit. Fig. 9 shows the dependence of AUC on the number of iterations for the three CNN architectures. Up to 1500 iterations, similar trends of AUC were observed for all three architectures for training and validation.
Fig. 9.
Dependence of AUC on the number of iterations for training and validation for the three selected CNN architectures. The training and validation of the CNN were performed for 1500 iterations.
It can be seen that the AUC values of all CNNs became more stable as the number of iterations increased and the AUC values converged to a plateau region after about 400 iterations. The CNN with more complex architecture (14-10-5-7) converged at smaller iteration number than the CNN with simpler architecture (12-8-5-3) but they reached about the same maximum AUC values. To select the set of weights (or the corresponding iteration) of a given CNN, an automatic search for a stable region of AUC values along its validation curve in Fig. 9 was performed as follows. The absolute difference in the validation AUC values between every two consecutive iterations was calculated. Along the absolute-difference-versus-iteration-number curve, each segment with 5 or more consecutive iterations that have an absolute AUC difference less than a threshold d was labeled as a stable region. The first stable region along the curve beyond 400 iterations was considered to be the iterations where the CNN was well trained and the set of weights at the middle iteration number of the region was chosen for the CNN. With experimentation, the threshold d was set to be 0.002, which was stringent enough such that not too many stable regions were marked in the plateau region but not too stringent such that excessively large number of iterations was needed to meet the criterion.
The selected iteration number for the three CNN architectures (12-8-5-3), (14-4-5-5) and (14-10-5-7) were 1461, 725 and 645 with corresponding validation AUC values of 0.900, 0.908 and 0.908, respectively.
To use the CNN output score to reduce FP ROIs, we determined the threshold values for stratification of the two classes as follows. The CNN threshold for selecting the cluster seeds among the N objects was determined first by comparing the rank-sensitivity plots over the CNN score range from 0 to 1 in increments of 0.1 using the training set while the CNN threshold for the Ns objects was set at 0, i.e., all Ns objects were kept. Each rank-sensitivity plot was generated by using the CNRobj values as a decision variable. After the threshold for the N objects was selected, the CNN threshold for the Ns objects was determined by varying its value from 0 to 1 in increments of 0.1 for different Tt thresholds and selected the combination that provided the highest detection sensitivity. With these experiments, the CNN thresholds for the sets of N and Ns objects were chosen to be 0.6 and 0.5, respectively, to separate the TP and FP classes, as shown in Eq. 3 and Eq. 4. For the Ns objects, both CNN and CNRobj thresholds (Eq. 4) were used to safeguard the microcalcifications with medium CNRobj. Thus, for a given microcalcification candidate (M):
| (3) |
| (4) |
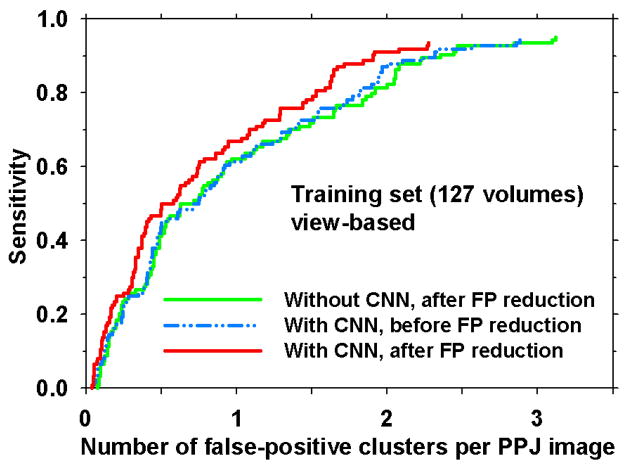
The three CNN architectures resulted in similar free response receiver operating characteristic (FROC) curves for MC detection (not shown) with 1.90, 1.89 and 1.89 FPs/PPJ image at 90% sensitivity for the training set. Because of the similar performance, the CNN architecture of least complexity, (12-8-5-3), was selected for the CADe system. As shown in Fig. 10, after the FP reduction stage, the FROC curves show that the CNN reduced the FP rate from 2.36 to 1.90 at 90% sensitivity. The performance with CNN before the FP reduction stage (2.32 FPs/PPJ image at 90% sensitivity) was similar to that without CNN after FP reduction stage, indicating that the CNN alone was as effective as the FP reduction stage. The overall performance improved when the two FP reduction strategies were combined.
Fig. 10.
View-based FROC curves comparing with and without CNN (12-8-5-3) after the FP reduction stage and with CNN before the FP reduction stage for the training set. Refer to Fig. 4 for the stages of CNN application and FP reduction in the CADe system.
3.3. Effect of FP reduction
The adaptive threshold in Eq. 2 and Table 1 were applied to each Ns object in a given PPJ image for stratifying the object type. After clustering, the decision criteria from Section 2.3.3. were used for differentiation of true and false clusters. The size thresholds a1, a2, a3 were determined experimentally to be 4, 5, 11 and the number of objects in cluster thresholds p1, p2 to be 4, 2 using the training set. Large high contrast objects such as dense benign calcifications and artifacts are removed by using area threshold of 300 pixels. With these parameter values the FP rate was 1.90 FPs/PPJ image at 90% sensitivity using the CNN architecture of 12-8-5-3, as shown in Fig. 10.
3.4. Performance evaluation
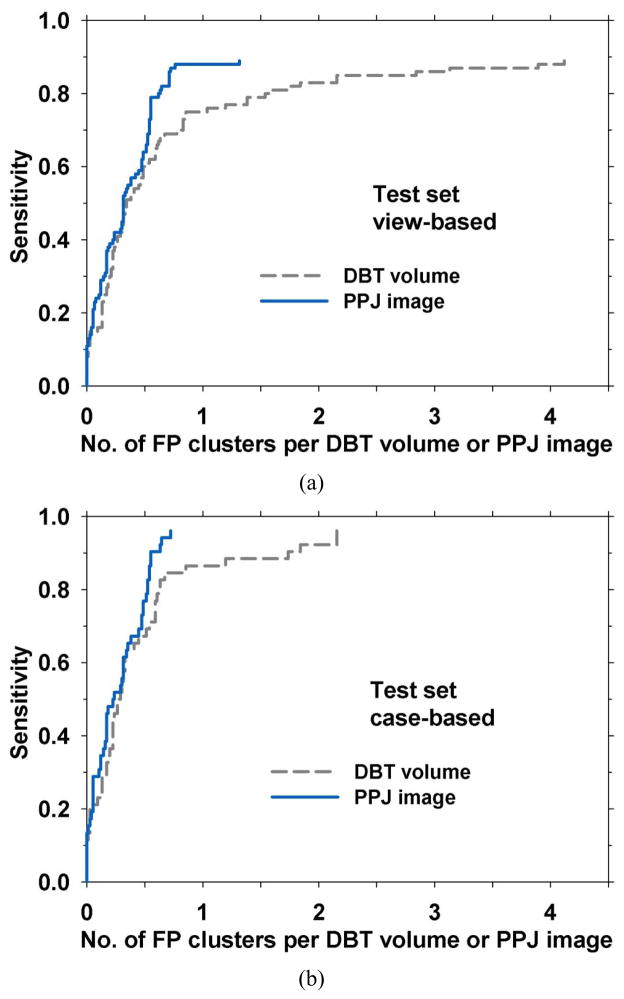
The performance of the CADe system for detection in the PPJ images was compared to our CADe system previously developed for MC detection in the DBT volumes (Samala et al., 2014) using the test set of two-view 52 MC cases and 38 cases free of MCs (180 PPJ images or 180 corresponding DBT volumes). The maximum CNRobj value among the objects included in a cluster was defined as the CNR score for the cluster. This CNR score was used as the decision variable to generate the FROC curve. For a CADe marked cluster to be categorized as a TP, the centroid of the detected cluster has to be enclosed inside the radiologist-marked box in the DBT volume (for detection in DBT volumes) or inside the box projected onto the PPJ plane (for detection in PPJ images). The FROC curve was calculated in two ways: (a) view-based: a cluster in each PPJ image or DBT volume was counted as an independent target so that the test set contained 100 targets, (b) case-based: the cluster in each case (CC and MLO views) was counted as one target so that the test set contained 52 targets and the detection of the cluster in one or both views was considered a TP. For the four test cases of which the MC was seen only in one view, the case-based scoring treated the MC not marked by radiologist as false negative on that view. Fig. 11(a) and 11(b) show the comparison of view-based and case-based FROC curves, respectively.
Fig. 11.
FROC curves comparing CADe systems for MC detection in DBT volume and PPJ image in the test set. The sensitivity was estimated in 52 cases (104 views) with MCs. The FP rate was estimated in 38 cases (76 views) free of MCs. (a) For view-based FROC curve, the MC detected in each view was counted as a TP, relative to the 100 MCs marked by radiologist. (b) for case-based FROC curve, MC detected in either one or both views for each case (CC and MLO views) was counted as a TP, relative to 52 clusters.
Jackknife alternative FROC (JAFROC) analysis (Chakraborty, 2008) was used to estimate the significance of the improvement achieved by the CADe system for the PPJ images over that for the DBT volumes as shown in Table 2.
Table 2.
JAFROC significance testing for the view-based FROC curves between two CADe systems developed for MC detection in DBT volume and PPJ image.
| Treatment | FOM | 95% Confidence interval |
|---|---|---|
| DBT volume | 0.64 | (0.56. 0.72) |
| PPJ image | 0.74 | (0.67, 0.82) |
| p-value | 0.003 |
4. Discussion
Detection of MCs in DBT will continue to be improved through better visualization methods such as synthetic mammograms and thick slab views, optimizing DBT imaging parameters and PV distribution, enhancing image reconstruction and computerized image analysis. The detection of MCs in DBT has to be comparable to DM without additional exposure and excessive reading time in order for DBT to be practical for breast cancer screening. Synthetic mammogram (Skaane et al., 2014) and CADe may address these concerns to a certain extent. Development of CADe on PVs or reconstructed volume has been investigated. A CADe system applied to a PPJ image generated from a DBT volume is a novel way of analyzing microcalcifications on a single plane. The PPJ image is obtained by MSBF-regularized SART reconstruction to enhance microcalcifications and project them onto a single plane. When compared with the reconstructed DBT volume that was also enhanced using MSBF, the enhancement in the CNR values of the true microcalcifications relative to those of the FP objects in the PPJ images were greater than that in the DBT volumes. The separation of the CNRs between TPs and FPs is an important feature for CADe to detect the subtle microcalcifications without increasing the FPs substantially. The AUC values for classification of TPs and FPs in the DBT volume and in the PPJ image for corresponding TP locations were 0.858 and 0.899, respectively. The increase in the separation indicates the potential gain in TP clusters and lower FP rates in subsequent steps.
The screening of the N and Ns objects by the CNN separates microcalcification-like objects from the background tissue structures and other artifacts. For the training set of 127 volumes, at a view-based sensitivity of 90% from Fig. 10, the FP rate decreases from 2.36 to 1.90 with CNN. The histogram of the CNRobj is representative of the distribution of structures within each individual PPJ image. Based on the mean and standard deviation of the histogram, CNRobj thresholds are determined adaptively to classify the microcalcifications from FPs. The skewness also quantifies the spread of the CNRobj values of high contrast objects present in a PPJ image, allowing further refinement of the thresholds. With the identification of microcalcification candidates, the next step is to categorize clusters. The CNRobj thresholds in combination with the size of the objects and the number of objects in a cluster are used to stratify cluster subtlety and reducing FP clusters with different strategies. For the training set and view-based analysis, the FP reduction stage achieved an FP rate of 1.90/PPJ image at 90% sensitivity (Fig. 10) where the FP rate was estimated from cases with MCs.
The performance of the CADe system was evaluated with the independent test set containing biopsy-proven MC and MC-free cases. The FP rate was estimated from the 76 views free of MCs. Fig. 11 shows that the view-based FROC curves achieved an FP rate of 2.16 FPs/DBT volume and 0.71 FPs/PPJ image, respectively, at 85% sensitivity for DBT volume and PPJ image. For case-based analysis, the FP rates at 85% sensitivity were 0.85 FPs/DBT volume and 0.54 FPs/PPJ image, respectively, for DBT volume and PPJ image. It can be observed from the FROC curves that the performances of the CADe system on PPJ image and DBT volume are similar for obvious to medium CNRobj clusters (i.e., clusters detected at high decision thresholds and in the region of low FP rates along the curves). The PPJ image has the distinct advantage for detecting subtle clusters while maintaining a low FP rate. JAFROC analysis shows a significant improvement from the detection of MC in the DBT volumes with p = 0.003 (Table 2).
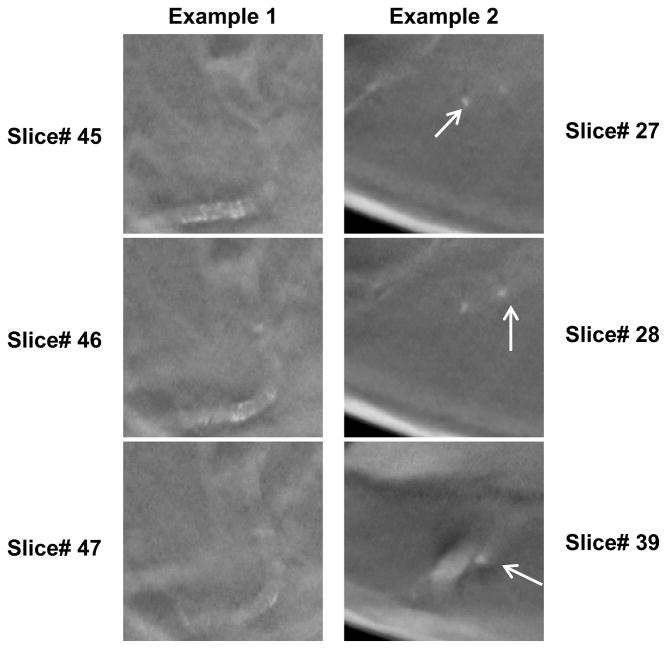
Even with a distinct advantage of detecting subtle clusters, PPJ image suffers from FP clusters formed due to tissue structures many slices apart. Maximum intensity projection of the high-frequency components of the DBT volume can produce MC-like grouping of high contrast objects from objects that are far apart along the depth (Z) direction. Fig. 12 shows the typical FPs due to vascular calcifications and tissues appearing at contiguous and non-contiguous slice locations. Given the possibility that these objects may be identified as separate structures less similar to an MC cluster in the DBT volume, we anticipate that using joint DBT and PPJ information may achieve higher sensitivity and intelligently reduce the FPs, which we will pursue in the future.
Fig. 12.
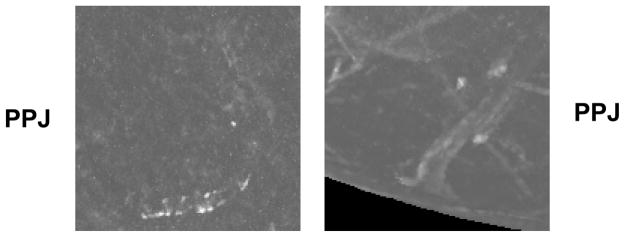
Examples of false positive clusters due to vascular calcifications and tissue. Top three rows: slices in a DBT volume, last row: corresponding PPJ image. Left example: FP cluster due to vascular calcifications. Right example: FP cluster due to tissues and from non-contiguous slices.
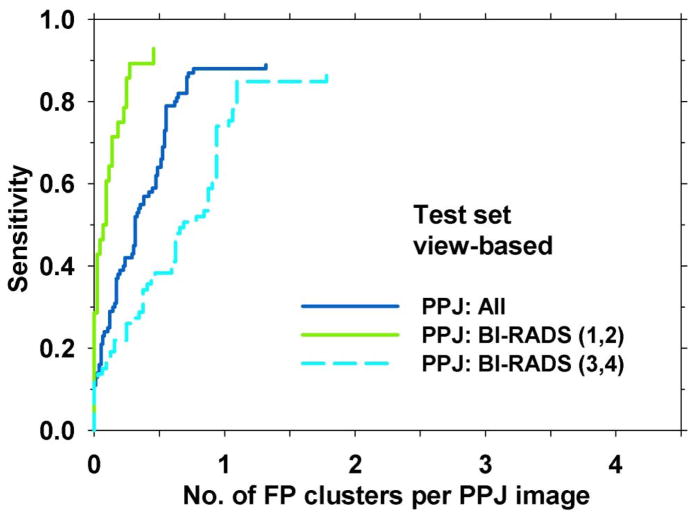
Maximum intensity projection also has the disadvantage of losing subtle microcalcifications if there are other high intensity structures along the projection path in the depth direction, which may be related to the presence of dense tissue in the breast. We grouped the test cases into two subsets; one contained breasts in the BI-RADS 1 and 2 density categories (28 views with MCs and 44 views without MCs) and the other BI-RADS 3 and 4 density categories (76 views with MCs and 32 views without MCs). Comparison of the FROC curves of the two subsets (Fig. 13) showed that the performance in dense breasts was substantially lower than that in less dense breasts, At 85% sensitivity, the FP rates were 0.25 and 1.78 FPs/view for BI-RADS (1, 2) and BI-RADS (3, 4) breasts, respectively. This indicates that MC detection in dense breasts is more challenging and further improvement is needed.
Fig. 13.
FROC curves illustrating the effect of BI-RADS density of the breast on CADe system performance. For the ‘All’ curve, the sensitivity was estimated in the test set of 104 views with MCs and FP rate was estimated in 76 views with MCs. The other two curves were estimated with the test subsets with BI-RADS (1,2) and BI-RADS (3,4) breasts.
Although the total dose due to the DM+DBT combination is within the MQSA limit (Feng and Sechopoulos, 2012; Skaane et al., 2013), radiation dose should still be kept as low as reasonably achievable for annual screening. The compromise between dose and diagnostic accuracy will ultimately depend on the clinical needs (Helvie, 2010). Synthetic mammogram is considered to be an alternative to DM so that the dose due to the DM can be eliminated in the DM+DBT combination. There is considerable interest in generating synthetic 2D mammograms from the DBT volumes which allow radiologists to search for MC on synthetic 2D images. The expected workflow may be that the radiologist reads the synthetic mammogram for suspected MCs and the DBT volume for soft tissue lesions. Given such a scenario, it is beneficial to test the performance of the CADe system on synthetic mammograms. It is expected the CADe for PPJ image can be extended to synthetic mammograms with proper background suppression, which is typically used in CADe systems for mammography (Chan et al., 1987; Giger et al., 2008). Such an application of the CADe system will be investigated when a data set of synthetic mammograms becomes available to us.
There are limitations in this study. The data set was relatively small so that the number of cases for training and testing, and in the subsets for the analysis of the effects of breast density on detection performance was limited. Second, we included most of the malignant cases in the training set with the intention to train the CADe system to detect more suspicious MCs. The test set contained very few malignant cases so that subset analysis to compare the detection performance for malignant and benign MCs was not possible. Nevertheless, the CADe system was developed to be used for screening, aiming at detection of MCs that radiologists consider suspicious and require diagnostic workup under current clinical criteria. All MCs in our current data set had BI-RADS assessments of 4 and 5. Moreover, we believe that the test performance would not be overly optimistic because malignant MCs are less subtle than benign MCs, on average, as can be seen from the histogram of the subtlety ratings of the two groups (Fig. 1(b)) and from previous studies (Bria et al., 2014; Sahiner et al., 2012; Ge et al., 2007). Third, the quality and detectability of MCs in DBT, and thus PPJ, will depend on the acquisition geometry of the DBT system (Chan et al., 2014) and the reconstruction technique, which have not been examined in the current study. The impacts of the various factors on the detection of MCs by the different CADe approaches have to be investigated in the future.
5. Conclusion
The PPJ image is a novel representation of high frequency structures including microcalcifications for DBT on a single plane. The separability of MCs from FPs by computer in PPJ images is significantly better than that in its DBT counterpart. The reduction in search space, improved CNR, coupled with prescreening of microcalcification candidates and use of decision criteria conditioned on cluster types for clustering improved the detection accuracy of subtle MCs while maintaining a low FP rate. Further studies are needed to evaluate the performance of the CADe system on a large data set and investigate the dependence of the performance of different CADe approaches on factors such as DBT acquisition geometry and reconstruction. It is also vital to reduce FPs including benign vascular calcifications and MC-like groupings from the projection of candidates far apart in the DBT volume.
Acknowledgments
This work is supported by USPHS grant RO1 CA151443. The digital breast tomosynthesis system was developed by the GE Global Research Group, with input and some revisions from the University of Michigan investigators, through the Biomedical Research Partnership (USPHS grant CA91713, PI: Paul Carson, Ph.D.) collaboration. The content of this paper does not necessarily reflect the position of the funding agencies and no official endorsement of any equipment and product of any companies mentioned should be inferred.
References
- Allred DC. Ductal Carcinoma In Situ: Terminology, Classification, and Natural History. J Natl Cancer Inst Monogr. 2010;2010:134–8. doi: 10.1093/jncimonographs/lgq035. [DOI] [PMC free article] [PubMed] [Google Scholar]
- Andersson I, Ikeda DM, Zackrisson S, Ruschin M, Svahn T, Timberg P, Tingberg A. Breast tomosynthesis and digital mammography: a comparison of breast cancer visibility and BIRADS classification in a population of cancers with subtle mammographic findings. European Radiology. 2008;18:2817–25. doi: 10.1007/s00330-008-1076-9. [DOI] [PubMed] [Google Scholar]
- Astley S, Connor S, Lim Y, Tate C, Entwistle H, Morris J, Whiteside S, Sergeant J, Wilson M, Beetles U, Boggis C, Gilbert F. A comparison of image interpretation times in full field digital mammography and digital breast tomosynthesis. Proc SPIE. 2013;8673:86730S-S-8. [Google Scholar]
- Bernard S, Muller S, Onativia J. Computer-aided microcalcification detection on digital breast tomosynthesis data: A preliminary evaluation. IWDM 2008 - Lecture Notes in Computer Science. 2008;5116:151–7. [Google Scholar]
- Bria A, Karssemeijer N, Tortorella F. Learning from unbalanced data: A cascade-based approach for detecting clustered microcalcifications. Medical image analysis. 2014;18:241–52. doi: 10.1016/j.media.2013.10.014. [DOI] [PubMed] [Google Scholar]
- Burt PJ, Adelson EH. The Laplacian pyramid as a compact image code. IEEE Transactions on Communications COM-31. 1983:337–45. [Google Scholar]
- Chakraborty DP. Validation and statistical power comparison of methods for analyzing free-response observer performance studies. Academic Radiology. 2008;15:1554–66. doi: 10.1016/j.acra.2008.07.018. [DOI] [PMC free article] [PubMed] [Google Scholar]
- Chan H-P, Doi K, Galhotra S, Vyborny CJ, MacMahon H, Jokich PM. Image feature analysis and computer-aided diagnosis in digital radiography. 1. Automated detection of microcalcifications in mammography. Medical Physics. 1987;14:538–48. doi: 10.1118/1.596065. [DOI] [PubMed] [Google Scholar]
- Chan H-P, Goodsitt MM, Helvie M, Zelakiewicz S, Schmitz A, Noroozian M, Paramagul C, Roubidoux MA, Nees AV, Neal C, Carson P, Lu Y, Hadjiiski LM, Wei J. Digital breast tomosynthesis: Observer performance study of the detection of clustered microcalcifications in breast phantom images acquired with an experimental DBT system using variable scan angles, angular increments, and number of projection views. Radiology. 2014;273:675–85. doi: 10.1148/radiol.14132722. [DOI] [PMC free article] [PubMed] [Google Scholar]
- Chan H-P, Lo SCB, Sahiner B, Lam KL, Helvie MA. Computer-aided detection of mammographic microcalcifications: Pattern recognition with an artificial neural network. Medical Physics. 1995;22:1555–67. doi: 10.1118/1.597428. [DOI] [PubMed] [Google Scholar]
- Ciatto S, Houssami N, Bernardi D, Caumo F, Pellegrini M, Brunelli S, Tuttobene P, Bricolo P, Fantò C, Valentini M, Montemezzi S, Macaskill P. Integration of 3D digital mammography with tomosynthesis for population breast-cancer screening (STORM): a prospective comparison study. The Lancet Oncology. 2013;14:583–9. doi: 10.1016/S1470-2045(13)70134-7. [DOI] [PubMed] [Google Scholar]
- Das M, Gifford HC, O’Connor JM, Glick SJ. Penalized Maximum Likelihood Reconstruction for Improved Microcalcification Detection in Breast Tomosynthesis. IEEE Transactions on Medical Imaging. 2011;30:904–14. doi: 10.1109/TMI.2010.2089694. [DOI] [PMC free article] [PubMed] [Google Scholar]
- Feng SSJ, Sechopoulos I. Clinical Digital Breast Tomosynthesis System: Dosimetric Characterization. Radiology. 2012;263:35–42. doi: 10.1148/radiol.11111789. [DOI] [PMC free article] [PubMed] [Google Scholar]
- Ge J, Hadjiiski LM, Sahiner B, Wei J, Helvie MA, Zhou C, Chan H-P. Computer-aided detection system for clustered microcalcifications: comparison of performance on full-field digital mammograms and digitized screen-film mammograms. Physics in Medicine and Biology. 2007;52:981–1000. doi: 10.1088/0031-9155/52/4/008. [DOI] [PMC free article] [PubMed] [Google Scholar]
- Ge J, Sahiner B, Hadjiiski LM, Chan H-P, Wei J, Helvie MA, Zhou C. Computer aided detection of clusters of microcalcifications on full field digital mammograms. Medical Physics. 2006;33:2975–88. doi: 10.1118/1.2211710. [DOI] [PubMed] [Google Scholar]
- Giger ML, Chan H-P, Boone J. Anniversary Paper: History and status of CAD and quantitative image analysis: The role of Medical Physics and AAPM. Medical Physics. 2008;35:5799–820. doi: 10.1118/1.3013555. [DOI] [PMC free article] [PubMed] [Google Scholar]
- Good WF, Abrams GS, Catullo VJ, Chough DM, Ganott MA, Hakim CM, Gur D. Digital breast tomosynthesis: A pilot observer study. American Journal of Roentgenology. 2008;190:865–9. doi: 10.2214/AJR.07.2841. [DOI] [PubMed] [Google Scholar]
- Gur D, Abrams GS, Chough DM, Ganott MA, Hakim CM, Perrin RL, Rathfon GY, Sumkin JH, Zuley ML, Bandos AI. Digital Breast Tomosynthesis: Observer Performance Study. American Journal of Roentgenology. 2009;193:586–91. doi: 10.2214/AJR.08.2031. [DOI] [PubMed] [Google Scholar]
- Gurcan MN, Chan H-P, Sahiner B, Hadjiiski L, Petrick N, Helvie MA. Optimal neural network architecture selection: Improvement in computerized detection of microcalcifications. Academic Radiology. 2002;9:420–9. doi: 10.1016/s1076-6332(03)80187-3. [DOI] [PubMed] [Google Scholar]
- Gurcan MN, Sahiner B, Chan H-P, Hadjiiski LM, Petrick N. Selection of an optimal neural network architecture for computer-aided detection of microcalcifications - comparison of automated optimization techniques. Medical Physics. 2001;28:1937–48. doi: 10.1118/1.1395036. [DOI] [PubMed] [Google Scholar]
- Haas BM, Kalra V, Geisel J, Raghu M, Durand M, Philpotts LE. Comparison of Tomosynthesis Plus Digital Mammography and Digital Mammography Alone for Breast Cancer Screening. Radiology. 2013;269:694–700. doi: 10.1148/radiol.13130307. [DOI] [PubMed] [Google Scholar]
- Helvie MA. Digital Mammography Imaging: Breast Tomosynthesis and Advanced Applications. Radiologic Clinics of North America. 2010;48:917–29. doi: 10.1016/j.rcl.2010.06.009. [DOI] [PMC free article] [PubMed] [Google Scholar]
- Hu YH, Zhao W. The effect of angular dose distribution on the detection of microcalcifications in digital breast tomosynthesis. Medical Physics. 2011;38:2455–66. doi: 10.1118/1.3570580. [DOI] [PMC free article] [PubMed] [Google Scholar]
- Kopans D, Gavenonis S, Halpern E, Moore R. Calcifications in the Breast and Digital Breast Tomosynthesis. Breast Journal. 2011;17:638–44. doi: 10.1111/j.1524-4741.2011.01152.x. [DOI] [PubMed] [Google Scholar]
- Lu Y, Chan H-P, Wei J, Goodsitt MM, Carson PL, Hadjiiski L, Schmitz A, Eberhard JW, Claus BEH. Image quality of microcalcifications in digital breast tomosynthesis: Effects of projection-view distributions. Medical Physics. 2011;38:5703–12. doi: 10.1118/1.3637492. [DOI] [PMC free article] [PubMed] [Google Scholar]
- Lu Y, Chan H-P, Wei J, Hadjiiski L, Zhou C. Multiscale regularized reconstruction for enhancing microcalcification in digital breast tomosynthesis. Proc SPIE. 2012a;8313:831322. [Google Scholar]
- Lu Y, Chan H-P, Wei J, Hadjiiski LM. Selective-diffusion regularization for enhancement of microcalcifications in digital breast tomosynthesis reconstruction. Medical Physics. 2010;37:6003–14. doi: 10.1118/1.3505851. [DOI] [PMC free article] [PubMed] [Google Scholar]
- Lu Y, Chan H-P, Wei J, Samala RK, Hadjiiski L, Carson PL. Multiscale bilateral regularization in digital breast tomosynthesis (DBT) RSNA Program Book. 2012b:SSE22. [Google Scholar]
- Metz CE, Herman BA, Shen JH. Maximum-likelihood estimation of receiver operating characteristic (ROC) curves from continuously-distributed data. Statistics in Medicine. 1998;17:1033–53. doi: 10.1002/(sici)1097-0258(19980515)17:9<1033::aid-sim784>3.0.co;2-z. [DOI] [PubMed] [Google Scholar]
- Park SC, Zheng B, Wang XH, Gur D. Applying a 2D based CAD scheme for detecting micro-calcification clusters using digital breast tomosynthesis images: An assessment - art. no. 691507. Proc SPIE. 2008;6915:6915071–8. [Google Scholar]
- Poplack SP, Tosteson TD, Kogel CA, Nagy HM. Digital Breast Tomosynthesis: Initial Experience in 98 Women with Abnormal Digital Screening Mammography. American Journal of Roentgenology. 2007;189:616–23. doi: 10.2214/AJR.07.2231. [DOI] [PubMed] [Google Scholar]
- Reiser I, Nishikawa RM, Edwards AV, Kopans DB, Schmidt RA, Papaioannou J, Moore RH. Automated detection of microcalcification clusters for digital breast tomosynthesis using projection data only: A preliminary study. Medical Physics. 2008;35:1486–93. doi: 10.1118/1.2885366. [DOI] [PMC free article] [PubMed] [Google Scholar]
- Rose SL, Tidwell AL, Bujnoch LJ, Kushwaha AC, Nordmann AS, Sexton R. Implementation of Breast Tomosynthesis in a Routine Screening Practice: An Observational Study. American Journal of Roentgenology. 2013;200:1401–8. doi: 10.2214/AJR.12.9672. [DOI] [PubMed] [Google Scholar]
- Sahiner B, Chan H-P, Hadjiiski LM, Helvie MA, Wei J, Zhou C, Lu Y. Computer-aided detection of clustered microcalcifications in digital breast tomosynthesis: A 3D approach. Medical Physics. 2012;39:28–39. doi: 10.1118/1.3662072. [DOI] [PMC free article] [PubMed] [Google Scholar]
- Samala RK, Chan H-P, Lu Y, Hadjiiski LM, Wei J, Sahiner B, Helvie MA. Computer-aided detection of clustered microcalcifications in multiscale bilateral filtering regularized reconstructed digital breast tomosynthesis volume. Medical Physics. 2014;41:021901. doi: 10.1118/1.4860955. [DOI] [PMC free article] [PubMed] [Google Scholar]
- Samala RK, Chan H-P, Lu Y, Hadjiyski L, Wei J, Sahiner B, Helvie M. Detection of microcalcifications in breast tomosynthesis reconstructed with multiscale bilateral filtering regularization. Proc SPIE. 2013;8670:86701L-L-8. [Google Scholar]
- Sechopoulos I, Ghetti C. Optimization of the acquisition geometry in digital tomosynthesis of the breast. Medical Physics. 2009;36:1199–207. doi: 10.1118/1.3090889. [DOI] [PubMed] [Google Scholar]
- Sidky EY, Pan X, Reiser I, Nishikawa RM, Moore RH, Kopans DB. Enhanced imaging of microcalcifications in digital breast tomosynthesis through improved image-reconstruction algorithms. Medical Physics. 2009;36:4920–32. doi: 10.1118/1.3232211. [DOI] [PMC free article] [PubMed] [Google Scholar]
- Skaane P, Bandos A, Gullien R, Eben E, Ekseth U, Haakenaasen U, Izadi M, Jebsen I, Jahr G, Krager M, Hofvind S. Prospective trial comparing full-field digital mammography (FFDM) versus combined FFDM and tomosynthesis in a population-based screening programme using independent double reading with arbitration. European Radiology. 2013;23:2061–71. doi: 10.1007/s00330-013-2820-3. [DOI] [PMC free article] [PubMed] [Google Scholar]
- Skaane P, Bandos AI, Eben EB, Jebsen IN, Krager M, Haakenaasen U, Ekseth U, Izadi M, Hofvind S, Gullien R. Two-View Digital Breast Tomosynthesis Screening with Synthetically Reconstructed Projection Images: Comparison with Digital Breast Tomosynthesis with Full-Field Digital Mammographic Images. Radiology. 2014;271:655–63. doi: 10.1148/radiol.13131391. [DOI] [PubMed] [Google Scholar]
- Spangler ML, Zuley ML, Sumkin JH, Abrams G, Ganott MA, Hakim C, Perrin R, Chough DM, Shah R, Gur D. Detection and Classification of Calcifications on Digital Breast Tomosynthesis and 2D Digital Mammography: A Comparison. American Journal of Roentgenology. 2011;196:320–4. doi: 10.2214/AJR.10.4656. [DOI] [PubMed] [Google Scholar]
- Tomasi C, Manduchi R. Bilateral filtering for gray and color images. 6th International Conference on Computer Vision (Bombay) 1998:839–46. [Google Scholar]
- Tse GM, Tan PH, Pang ALM, Tang APY, Cheung HS. Calcification in breast lesions: pathologists’ perspective. Journal of clinical pathology. 2008;61:145–51. doi: 10.1136/jcp.2006.046201. [DOI] [PubMed] [Google Scholar]
- Wallis MG, Moa E, Zanca F, Leifland K, Danielsson M. Two-view and single-view tomosynthesis versus full-field digital mammography: High-resolution x-ray imaging observer study. Radiology. 2012;262:788–96. doi: 10.1148/radiol.11103514. [DOI] [PubMed] [Google Scholar]
- Wei J, Chan H-P, Hadjiiski LM, Helvie MA, Lu Y, Zhou C, Samala RK. Multi-channel response analysis on 2D projection views for detection of clustered microcalcifications in digital breast tomosynthesis. Medical Physics. 2014;41:041913. doi: 10.1118/1.4868694. [DOI] [PMC free article] [PubMed] [Google Scholar]
- Zhang Y, Chan H-P, Sahiner B, Wei J, Goodsitt MM, Hadjiiski LM, Ge J, Zhou C. A comparative study of limited-angle cone-beam reconstruction methods for breast tomosynthesis. Medical Physics. 2006;33:3781–95. doi: 10.1118/1.223754. [DOI] [PMC free article] [PubMed] [Google Scholar]
- Zuley ML, Bandos AI, Abrams GS, Cohen C, Hakim CM, Sumkin JH, Drescher J, Rockette HE, Gur D. Time to Diagnosis and Performance Levels during Repeat Interpretations of Digital Breast Tomosynthesis: Preliminary Observations. Academic Radiology. 2010;17:450–5. doi: 10.1016/j.acra.2009.11.011. [DOI] [PubMed] [Google Scholar]


