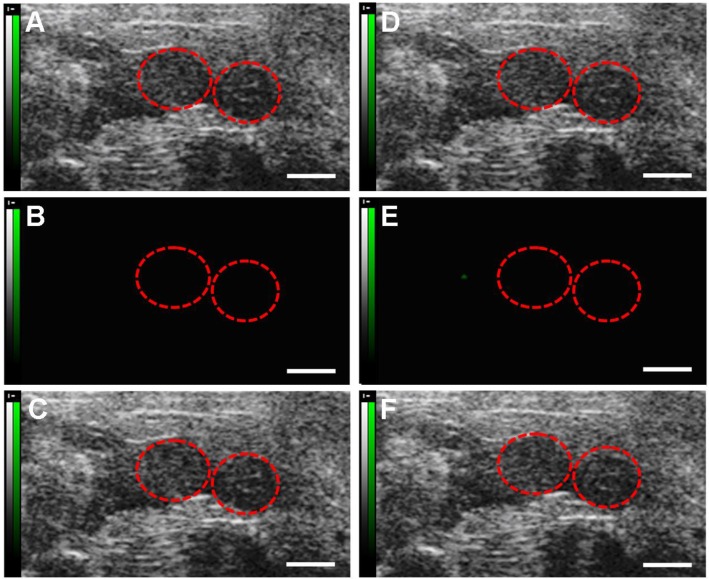
Figure 4.
Molecular sonograms from D0 murine uteruses showing no difference of ultrasonic signals from VEGFR2-targeted UCA and control UCA. (A) Control UCA enhanced B-mode sonogram, (B) color-coded background-subtracted image, and (C) background-subtracted image overlaid on a predestruction B-mode image. (D) VEGFR2-targeted UCA enhanced B-mode sonogram, (E) color-coded background-subtracted image, and (F) background-subtracted image overlaid on a predestruction B-mode image. Red circles are for uteruses. (scale bar = 1 mm)

