

Abstract
OBJECTIVE:
The goal of this study was to generate and report standardized growth curves for weight, height, head circumference, and BMI for non–growth hormone–treated white male and female US subjects with Prader-Willi syndrome (PWS) between 3 and 18 years of age and develop standardized growth charts.
METHODS:
Anthropometric measures (N = 133) were obtained according to standard methods from 120 non–growth hormone–treated white subjects (63 males and 57 females) with PWS between 3 and 18 years of age. Standardized growth curves were developed for the third, 10th, 25th, 50th, 75th, 90th, and 97th percentiles by using the LMS method for weight, height, head circumference, and BMI for PWS subjects along with the normative third, 50th, and 97th percentiles from national and international growth data. The LMS smoothing procedure summarized the distribution of the anthropometric variables at each age using three parameters: power of the Box-Cox transformation λ (L), median μ (M) and coefficient of variation δ (S).
RESULTS:
Weight, height, head circumference, and BMI standardized growth charts representing 7 percentile ranges were developed from 120 non–growth hormone–treated white male and female US subjects with PWS (age range: 3–18 years) and normative third, 50th, and 97th percentiles from national and international data.
CONCLUSIONS:
We encourage the use of syndrome-specific growth standards to examine and evaluate subjects with PWS when monitoring growth patterns and determining nutritional and obesity status. These variables can be influenced by culture, individual medical care, diet intervention, and physical activity plans.
Keywords: children, genetic subtype, Prader-Willi syndrome, standardized growth charts
What’s Known on This Subject:
Syndrome-specific standardized growth curves are not currently available for non–growth hormone–treated subjects with Prader-Willi syndrome and are required for monitoring growth and development in this rare obesity-related disorder.
What This Study Adds:
Standardized growth curves were useful in monitoring growth and development in these subjects with Prader-Willi syndrome and for the management of growth hormone treatment of both genders, particularly those aged 3 to 18 years.
Prader-Willi syndrome (PWS) is a classic genetic disorder characterized by central hypotonia with a poor suck and feeding difficulties that is found in infancy and accompanied by failure to thrive, hypogenitalism/hypogonadism, and growth hormone deficiency. In early childhood, hyperphagia develops, which leads to obesity if left uncontrolled. Additional findings include an IQ of 65 and behavioral problems (eg, rigidity, compulsions, temper tantrums, self-injury), as well as hypopigmentation, small hands and feet, short stature, and a characteristic facial appearance.1–4
PWS occurs in ∼1 in 15 000 live births and is estimated to affect ∼400 000 people worldwide. It is considered the most common syndromic cause of life-threatening obesity1 and arises sporadically in most cases. It is caused by loss of paternally expressed genes in the chromosome 15q11-q13 region, usually due to a deletion in ∼70% of affected subjects.1–4 Approximately 25% of cases have maternal disomy 15 or both 15s from the mother, with the remaining 5% resulting from a defect in the imprinting center controlling the activity of genes in this chromosome region. Life span in PWS is highly variable worldwide depending on the quality of medical and social care, but it is expected to be shortened due to disease-associated physical and neurologic problems. The chance of recurrence is low for deletion and maternal disomy subtypes (<1%), but those with an imprinting center defect may have a recurrence risk as high as 50%.2,4
Classically, 2 distinct stages of clinical course development have been reported in PWS: the first stage is characterized by profound hypotonia and failure to thrive in infancy and the second stage is characterized by onset of hyperphagia and subsequent obesity in early childhood with food foraging and behavioral problems. Recently, a multicenter study identified 7 different nutritional phases and subphases. The first phase describes the PWS infant with hypotonia with or without failure to thrive (age birth to 15 months); phase 2 is associated with weight gain without a significant change in appetite but followed by weight gain with an increased interest in food (median age of onset: 4.5 years); phase 3 is characterized by hyperphagia, food seeking, and lack of satiety (median age of onset: 8 years); and phase 4 indicates that an insatiable appetite may no longer exist and occurs in some adults with this obesity-related disorder.5
Growth hormone therapy is now frequently prescribed, often in early infancy or by early childhood once the diagnosis of PWS has been confirmed. Growth hormone treatment can lead to improved changes in body composition, physical activity, and growth velocity. Because there are syndrome-specific standardized growth charts, our goal was to provide new growth charts of weight, height, head circumference, and BMI for non–growth hormone–treated subjects with PWS between 3 and 18 years of age that can be used in the clinical setting and be helpful in monitoring growth hormone treatment in PWS. These standardized charts would replace the PWS growth charts reported by Butler and Meaney in 19916 of selected anthropometric measurements from subjects aged 2 to 22 years from an earlier era. Our charts are similar to the standardized growth charts recently developed for non–growth hormone–treated PWS infants between age 0 and 3 years.7,8
Methods
Subjects
Growth data were collected from 120 PWS subjects (63 males, 57 females) with genetic confirmation of PWS and no current or previous growth hormone treatment. The data were collected following standardized protocols and using an investigator-approved manual of operation. The majority of subjects were recruited from 2003 to 2013 as a component of a large rare disease consortium on PWS research at sites representing 4 states (Florida, Tennessee, Kansas, and California). The subjects were prospectively and consecutively enrolled after genetic confirmation, often from those followed up previously in the clinical setting. Seventy-six (63%) subjects with PWS had a 15q11-q13 deletion, 42 (35%) had maternal disomy 15, and 2 (2%) had an imprinting defect. The genetic testing included chromosome analysis with fluorescence in situ hybridization, chromosome 15 methylation-specific multiplex ligation-dependent probe amplification copy number and methylation testing, genotyping with polymorphic chromosome 15 markers of proband and parental DNA, and/or chromosomal microarray studies. The inclusion criteria required genetic confirmation of PWS for each subject before growth data were used for the growth chart development; the only exclusion criteria were current or previous growth hormone treatment. All PWS participants were cared for by clinicians, geneticists, and dietitians following medical management recommendations2 and with expertise treating subjects with PWS. Calorie-restricted diets at 60% to 80% of normal for age and activity were followed, and exercise plans (eg, 30 minutes of walking per day) were established for each participant depending on his or her age and obesity status.2,5,9
Ten subjects had repeated measurements for weight, height, and/or head circumference (7 subjects with 2 measurements; 3 subjects with 3 measurements), which produced a total of 133 data points distributed from 3 to 18 years of age. Approximately 56% of the data were available from 3 to 10 years; 25% from 10 to 15 years; and 19% from 15 to 18 years of age. For comparison purposes, the 3 normative percentile curves (third, 50th, and 97th) for each growth chart were plotted from data of normal control subjects from the Centers for Disease Control and Prevention (www.cdc.gov/growthcharts/percentile_data_files.htm)10 for height, weight, and BMI and from Nellhaus11 for head circumference.
Methods and Measurements
The subjects’ anthropometric measurements were obtained by the authors according to standard techniques and following established protocols.6,10,12 The measurements consisted of weight, height, and head circumference. Height was measured to the nearest 0.1 cm in a standing position with a sliding stadiometer fixed to the wall. Head (occipital–frontal) circumference was measured to the nearest millimeter with a steel tape. Weight was recorded to the nearest 0.01 kg with a calibrated balanced beam or electronic digital scale.
Growth reference charts are widely used to observe or track an individual’s clinical measurements in the context of population values. Growth charts for weight, height, head circumference, and BMI were developed for each gender by using the LMS method13,14 as used previously in the development and reporting of standardized growth curves.7 The LMS method is a standard technique for constructing age-related growth references and summarizes the distribution of an anthropometric variable Y at each value of a covariate (age) in terms of 3 parameters: Box-Cox power λ (L), median μ (M), and coefficient of variation σ (S):
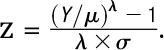 |
The outcome is SD or z scores having a symmetric and nearly standard normal distribution. The optimal value of Box-Cox power to transform the data into near-normality is estimated over the range of age, and its trend is summarized by an L curve. Similarly, the estimated medians and coefficients of variation are summarized by M and S curves over the age range, respectively. Penalized likelihood estimation finds the L, M, and S curves as cubic smoothing splines,15 and the degree of smoothing is indicated in terms of equivalent degrees of freedom (edf). Using LMS Chartmaker 2.4,16 we created a set of percentile curves (third, 10th, 25th, 50th, 75th, 90th, and 97th) for weight, height, head circumference, and BMI according to gender. The deviance test was used to determine the best models, and the Q test was conducted to evaluate the model fit by inspecting the distributions of the calculated z scores.17,18
Results
The distributional properties of the anthropometric variables did not differ over the ranges of age (ie, 3–10, 10–15, 15–18 years) between male or female subjects with the 15q11-q13 deletion and those with other genetic defects, including maternal disomy 15. The properties were therefore combined in the production of individual growth charts for each gender. The normality of data held, except for weight measures in male subjects, which required Box-Cox transformation. Figures 1, 2, 3, and 4 show the percentile curves of weight, height, head circumference, and BMI for non–growth hormone–treated subjects with PWS between 3 and 18 years of age; the percentile curves for normal control subjects are also shown.
FIGURE 1.

Standardized curves for weight of non–growth hormone–treated subjects (male subjects [upper] and female subjects [lower]) with PWS (solid lines) and normative percentile ranges (shaded area) with normative 97th to 50th percentiles in dark shading and 50th to third percentiles in light shading.
FIGURE 2.

Standardized curves for height of non–growth hormone–treated subjects (male subjects [upper] and female subjects [lower]) with PWS (solid lines) and normative percentile ranges (shaded area) with normative 97th to 50th percentiles in dark shading and 50th to third percentiles in light shading.
FIGURE 3.

Standardized curves for head circumference of non–growth hormone–treated subjects (male subjects [upper] and female subjects [lower]) with PWS (solid lines) and normative percentile ranges (shaded area) with normative 97th to 50th percentiles in dark shading and 50th to third percentiles in light shading.
FIGURE 4.

Standardized curves for BMI weight of non–growth–hormone treated subjects (male subjects [upper] and female subjects [lower]) with PWS (solid lines) and normative percentile ranges (shaded area) with normative 97th to 50th percentiles in dark shading and 50th to third percentiles in light shading.
For weight in male subjects (edf = 2, 4, 3), the normative 97th percentile generated from the Centers for Disease Control and Prevention national growth data14 followed between the 25th and 50th percentiles for PWS beginning at 4 years of age and continued to 13 years, when the normative 97th percentile was similar to the PWS 50th percentile. The PWS 75th percentile was consistently above the normative 97th percentile throughout all ages between 3 and 18 years. For weight in female subjects (edf = 1,3,1), the normative 97th percentile followed between the 50th and 75th percentiles for PWS until 10 years of age and between the 75th and 90th percentile in PWS until 15 years of age, when normative weight leveled off. Weight continued rapidly upward for all percentiles for female subjects with PWS from 3 to 18 years. At 18 years of age, the normative 97th percentile was equal to the PWS 50th percentile.
For height in male subjects (edf = 1,4,3), the normative 50th percentile ranged between the 50th and 75th percentile for PWS between 3 and 12 years of age, with height tapering off in PWS by 18 years of age, at which time the normative 50th percentile was equal to the PWS 97th percentile. For height in female subjects (edf = 1,4,3), the normative 50th percentile was between the PWS 75th and 90th percentiles until 10 years of age; thereafter, all PWS percentiles tapered off. For example, the normative third percentile was equal to the PWS 75th percentile by 18 years of age, and the normative 50th percentile was equal to the PWS 97th percentile by this age.
For head circumference in male subjects (edf = 1,4,2), the normative 50th percentile fell between the 50th and 75th percentiles for PWS from 3 to 18 years of age and approached the PWS 50th percentile by 18 years of age. The normative third percentile was similar to the PWS 10th percentile from 6 years of age or later. For head circumference in female subjects (edf = 1,2.5,1), the normative 50th percentile was similar to the 50th percentile for PWS from 3 to 11 years of age, at which time the normative 50th percentile continued to increase with age while the PWS 50th percentile tapered off. By 18 years of age, the normative 50th percentile was equal to the PWS 75th percentile at 18 years of age. The normative third percentile was comparable to the 10th percentile for female subjects with PWS until 11 years of age, which then increased with age to equal the PWS 25th percentile by 16 years of age.
For BMI in male subjects (edf = 1,3,1), the normative 97th percentile was comparable to the 25th percentile for PWS from 6 to 18 years of age; however, at age 3 years, the normative third percentile was comparable to the 25th percentile for PWS, indicating the failure-to-thrive pattern of development seen in PWS at an early age. For BMI in female subjects (edf = 1,3,1), the normative 50th percentile ranged between the third (at 18 years) and the 10th (at 5 years) percentiles for PWS from age 5 to 18 years, again indicating the hyperphagia and increased weight gain, which are common in early childhood and beyond in PWS if caloric intake is not controlled. The normative 97th percentile ranged between the 25th and 50th percentiles in PWS throughout the age range from 3 to 18 years.
Discussion
All PWS participants were white, with no current or previous growth hormone treatment. They were recruited in clinics from 4 states specializing in the diagnosis, treatment, and care of subjects with this rare disorder. Standardized growth curves for height, weight, head circumference, and BMI were generated from non–growth hormone–treated male and female subjects with a genetically confirmed diagnosis of PWS between 3 and 18 years of age and from healthy control subjects from the literature or databases. A deceleration of linear growth in PWS was documented specifically at the age of normal puberty relative to normative data by examining the standardized height curves in non–growth hormone–treated subjects. Although our PWS growth data were primarily cross-sectional in nature, with 133 data points from 120 PWS participants, an exaggerated increase in weight gain with age was seen in both PWS male and female subjects compared with normative data indicative of this obesity-related disorder. Weight and BMI data used to develop standardized curves can be affected by the level of physical activity and degree of monitoring of caloric intake, which may vary per individual (ie, some subjects are more motivated to lose and maintain weight loss and can vary from year to year). No significant differences have been reported in male or female subjects with PWS and the typical 15q11-q13 deletion or those with the nondeletion status (ie, maternal disomy 15 or a defect of the imprinting center controlling the activity of imprinted genes). Our PWS participants do not necessarily reflect the natural history in this syndrome because our health care program at the recruitment sites included restricted caloric intake and planned physical activity to control weight.
No subject had a current or history of growth hormone use, but other factors could affect growth measures in addition to diet and energy expenditure, including sex steroid use, endocrine disturbances (eg, thyroid, pancreas, adrenal), and medications (eg, atypical antipsychotic agents). All subjects with PWS in our study were young (age range: 3–18 years), and the use of sex steroids was infrequent (<10% of subjects) and few were prescribed atypical antipsychotics. In addition, <20% of subjects had a history of diabetes mellitus and <10% were treated for thyroid or adrenal gland problems, reflecting reported frequencies in the PWS population.2,19
Recently, Butler et al20 reported that the growth hormone receptor gene (GHR) in US children with PWS with the common exon 3 deletion polymorphism correlated with advanced height acceleration (similar to children without PWS also receiving growth hormone) compared with those without the GHR gene polymorphism. These observations should be more extensively studied in additional patients and be monitored for clinical outcomes. Growth hormone treatment that leads to improvement in stature, body composition, and metabolism from infancy through young adulthood in PWS21–25 stresses the need for syndrome-specific standardized growth charts for use in monitoring longitudinal growth patterns and response to nutritional and hormone intervention.
Anthropometric or growth standards have been generated for several syndromes and used in the clinical setting for medical management. Specifically, the standardized growth charts developed for infants (0–3 years of age) with PWS are currently in use for monitoring growth parameters and development in this rare genetic obesity-related disorder. Other published growth charts for PWS have been generated. For example, Butler et al6 reported charts from 71 US white subjects with PWS aged 2 to 22 years, and Hauffa et al26 reported charts from German PWS subjects aged 0 to 18 years. The new PWS standardized graphs in our report show similar results with standardized curves from previous reports on US white subjects generated >2 decades6 ago and before growth hormone treatment. Most medical centers nationwide now offer specialized care for treating the unique features seen in PWS. Specifically, the new PWS height curves are similar to the charts previously reported by Butler and Meaney6 and the German PWS graphs reported by Hauffa et al.26 However, according to the new charts for white, US male subjects with PWS, white subjects from the United States may be heavier than German PWS male subjects at comparable ages.
The increased rate of growth in height noted during normal puberty is absent in both male and female subjects with PWS when comparing the standardized data, and this finding can best be explained by the hypogonadism common in PWS.2 Other abnormal physical parameters in addition to height and weight are recognized in PWS, particularly skinfold measurements and hand and foot size.27–29 The abnormal parameters in PWS can be appreciated earlier after comparing data with syndrome-specific standardized growth curves. Medical care in PWS and other genetic syndromes (ie, Down syndrome, Turner syndrome) has become increasingly reliant on growth charts (normal and syndrome specific) to compare growth patterns at an early age due to better diagnostic techniques, more awareness, and availability of hormone replacement (eg, growth hormone).
Conclusions
Growth charts help optimize medical care and treatment in subjects with rare disorders such as PWS who have impaired growth (short stature secondary to growth hormone deficiency) and complicated further by failure to thrive and feeding difficulties in infancy. The onset of hyperphagia in PWS usually occurs in early childhood and leads to rapid weight gain and subsequent obesity, as illustrated by distortions observed in the newly developed growth patterns relative to normative data. Diagnosis is needed at an early age, with caloric restriction and increased physical activity to avoid the onset of obesity and medical comorbidities. Fortunately, better awareness now exists in the medical community, and more appropriate genetic testing methods are available for an early diagnosis and treatment with growth hormone for affected individuals with PWS. With early diagnosis and treatment, the quality of life and clinical outcome in PWS have improved with support of standardized growth curves used by the clinician and dietitian in the care of infants with PWS. However, those health care providers regularly supplying medical care for PWS subjects recognize the need for current standardized growth charts between 3 and 18 years of age to monitor nutrition, growth rate, and obesity. In addition, standardized growth charts can be used to guide growth hormone therapy and monitor for accelerated growth rate, orthopedic problems such as scoliosis, or other clinical features seen in this rare obesity-related genetic disorder. To meet those needs, if they should arise, the authors encourage the use of these newly established syndrome-specific standardized growth charts in the clinic setting for the medical care and treatment of subjects with PWS.
Acknowledgments
We thank Carla Meister for preparation of the manuscript.
Footnotes
Dr Butler recruited subjects and collected growth data, conceptualized and designed the study, and drafted the initial manuscript; Dr Lee analyzed research data, generated figures, and reviewed the manuscript; Dr Manzardo performed the initial analysis of growth data and revised and reviewed the manuscript; and Drs Gold, Miller, Kimonis, and Driscoll recruited subjects, collected growth data, and reviewed the manuscript. All authors approved the final manuscript as submitted.
The content is solely the responsibility of the authors and does not necessarily represent the office views of the National Institutes of Health.
This trial has been registered at www.clinicaltrials.gov (identifier NCT00375089).
FINANCIAL DISCLOSURE: The authors have indicated they have no financial relationships relevant to this article to disclose.
FUNDING: Prader-Willi Syndrome Association (USA) and the Angelman, Rett and Prader-Willi Syndromes Consortium (U54 HD06122), which is part of the National Institutes of Health Rare Diseases Clinical Research Network, supported this research through collaboration between the National Institutes of Health’s Office of Rare Diseases Research at the National Center of Advancing Translational Science and the National Institute of Child Health and Human Development. Funded by the National Institutes of Health (NIH).
POTENTIAL CONFLICT OF INTEREST: The authors have indicated they have no potential conflicts of interest to disclose.
References
- 1.Butler MG. Prader-Willi syndrome: current understanding of cause and diagnosis. Am J Med Genet. 1990;35(3):319–332 [DOI] [PMC free article] [PubMed] [Google Scholar]
- 2.Butler MG, Lee PDK, Whitman BY, eds. Management of Prader-Willi Syndrome. 3rd ed. New York, NY: Springer-Verlag Publishers; 2006 [Google Scholar]
- 3.Butler MG. Prader-Willi syndrome: obesity due to genomic imprinting. Curr Genomics. 2011;12(3):204–215 [DOI] [PMC free article] [PubMed] [Google Scholar]
- 4.Cassidy SB, Schwartz S, Miller JL, Driscoll DJ. Prader-Willi syndrome. Genet Med. 2012;14(1):10–26 [DOI] [PubMed] [Google Scholar]
- 5.Miller JL, Lynn CH, Driscoll DC, et al. Nutritional phases in Prader-Willi syndrome. Am J Med Genet A. 2011;155A(5):1040–1049 [DOI] [PMC free article] [PubMed] [Google Scholar]
- 6.Butler MG, Meaney FJ. Standards for selected anthropometric measurements in Prader-Willi syndrome. Pediatrics. 1991;88(4):853–860 [PMC free article] [PubMed] [Google Scholar]
- 7.Butler MG, Sturich J, Lee J, et al. Growth standards of infants with Prader-Willi syndrome. Pediatrics. 2011;127(4):687–695 [DOI] [PMC free article] [PubMed] [Google Scholar]
- 8.Rosenbloom ST, Butler MG. Development and implementation of electronic growth charts for infants with Prader-Willi syndrome. Am J Med Genet A. 2012;158A(11):2743–2749 [DOI] [PMC free article] [PubMed] [Google Scholar]
- 9.Butler MG. Management of obesity in Prader-Willi syndrome. Nat Clin Pract Endocrinol Metab. 2006;2(11):592–593 [DOI] [PMC free article] [PubMed] [Google Scholar]
- 10.Centers for Disease Control and Prevention. Percentile data files with LMS values. Available at: www.cdc.gov/growthcharts/charts.htm. Accessed April 11, 2014
- 11.Nellhaus G. Head circumference from birth to eighteen years. Practical composite international and interracial graphs. Pediatrics. 1968;41(1):106–114 [PubMed] [Google Scholar]
- 12.Weiner JS, Lourie JA. Human Biology: A Guide to Field Methods. Oxford, United Kingdom: Blackwell Scientific Publications; 1969 [Google Scholar]
- 13.Cole TJ. The LMS method for constructing normalized growth standards. Eur J Clin Nutr. 1990;44(1):45–60 [PubMed] [Google Scholar]
- 14.Cole TJ, Green PJ. Smoothing reference centile curves: the LMS method and penalized likelihood. Stat Med. 1992;11(10):1305–1319 [DOI] [PubMed] [Google Scholar]
- 15.Green PJ. Penalized likelihood for general semi-parametric regression models. Int Stat Rev. 1987;55:245–259 [Google Scholar]
- 16.Pan H, Cole TJ. LMS Chartmaker, A Program for Calculating Age-Related Reference Centiles Using the LMS method [computer program]. Version 2.4. London, United Kingdom: Medical Research Council; 2009
- 17.Pan H, Cole TJ. A comparison of goodness of fit tests for age-related reference ranges. Stat Med. 2004;23(11):1749–1765 [DOI] [PubMed] [Google Scholar]
- 18.Royston P, Wright EM. Goodness-of-fit statistics for age-specific reference intervals. Stat Med. 2000;19(21):2943–2962 [DOI] [PubMed] [Google Scholar]
- 19.Butler MG, Theodoro M, Skouse JD. Thyroid function studies in Prader-Willi syndrome. Am J Med Genet A. 2007;143A(5):488–492 [DOI] [PMC free article] [PubMed] [Google Scholar]
- 20.Butler MG, Roberts J, Hayes J, Tan X, Manzardo AM. Growth hormone receptor (GHR) gene polymorphism and Prader-Willi syndrome. Am J Med Genet A. 2013;161A(7):1647–1653 [DOI] [PMC free article] [PubMed] [Google Scholar]
- 21.Carrel AL, Moerchen V, Myers SE, Bekx MT, Whitman BY, Allen DB. Growth hormone improves mobility and body composition in infants and toddlers with Prader-Willi syndrome. J Pediatr. 2004;145(6):744–749 [DOI] [PubMed] [Google Scholar]
- 22.Lindgren AC, Lindberg A. Growth hormone treatment completely normalizes adult height and improves body composition in Prader-Willi syndrome: experience from KIGS (Pfizer International Growth Database). Horm Res. 2008;70(3):182–187 [DOI] [PubMed] [Google Scholar]
- 23.Sode-Carlsen R, Farholt S, Rabben KF, et al. Body composition, endocrine and metabolic profiles in adults with Prader-Willi syndrome. Growth Horm IGF Res. 2010;20(3):179–184 [DOI] [PubMed] [Google Scholar]
- 24.Höybye C. Endocrine and metabolic aspects of adult Prader-Willi syndrome with special emphasis on the effect of growth hormone treatment. Growth Horm IGF Res. 2004;14(1):1–15 [DOI] [PubMed] [Google Scholar]
- 25.Butler MG, Smith BK, Lee J, et al. Effects of growth hormone treatment in adults with Prader-Willi syndrome. Growth Horm IGF Res. 2013;23(3):81–87 [DOI] [PMC free article] [PubMed] [Google Scholar]
- 26.Hauffa BP, Schlippe G, Roos M, Gillessen-Kaesbach G, Gasser T. Spontaneous growth in German children and adolescents with genetically confirmed Prader-Willi syndrome. Acta Paediatr. 2000;89(11):1302–1311 [DOI] [PubMed] [Google Scholar]
- 27.Butler MG, Meaney FJ. An anthropometric study of 38 individuals with Prader-Labhart-Willi syndrome. Am J Med Genet. 1987;26(2):445–455 [DOI] [PMC free article] [PubMed] [Google Scholar]
- 28.Meaney FJ, Butler MG. The developing role of anthropologists in medical genetics: anthropometric assessment of the Prader-Labhart-Willi syndrome as an illustration. Med Anthropol. 1989;10(4):247–253 [DOI] [PMC free article] [PubMed] [Google Scholar]
- 29.Butler MG, Haynes JL, Meaney FJ. Anthropometric study with emphasis on hand and foot measurements in the Prader-Willi syndrome: sex, age and chromosome effects. Clin Genet. 1991;39(1):39–47 [DOI] [PMC free article] [PubMed] [Google Scholar]