An official website of the United States government
Here's how you know
Official websites use .gov
A
.gov website belongs to an official
government organization in the United States.
Secure .gov websites use HTTPS
A lock (
) or https:// means you've safely
connected to the .gov website. Share sensitive
information only on official, secure websites.

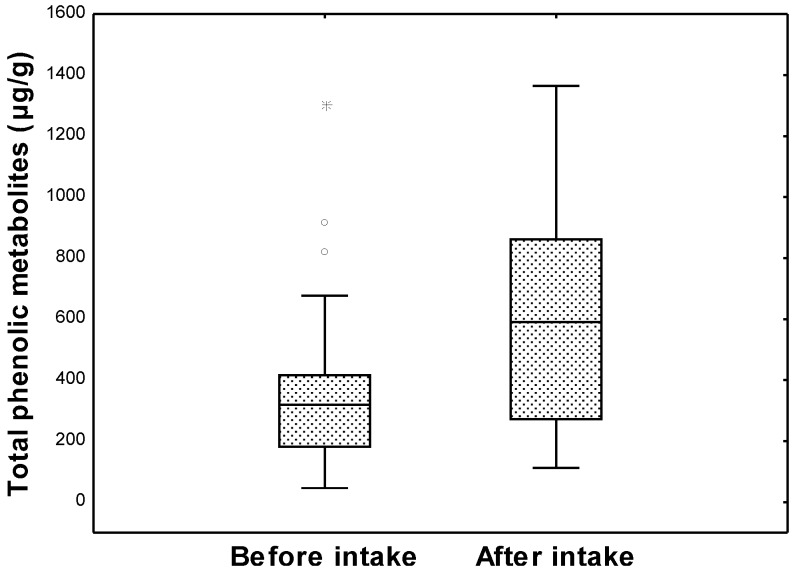
 : 25th–75th percentiles;
  : non-outlier range; ○: outliers;
  : extremes) of the total phenolic metabolites content in the intervention group (n = 33).