Abstract
Background
Effective methods for managing patients with solitary pulmonary nodules (SPNs) depend critically on the predictive probability of malignancy.
Methods
Between July 2009 and June 2011, data on gender, age, cancer history, tumor familial history, smoking status, tumor location, nodule size, spiculation, calcification, the tumor border, and the final pathological diagnosis were collected retrospectively from 154 surgical patients with an SPN measuring 3-30 mm. Each final diagnosis was compared with the probability calculated by three predicted models—the Mayo, VA, and Peking University (PU) models. The accuracy of each model was assessed using area under the receiver operating characteristics (ROC) and calibration curves.
Results
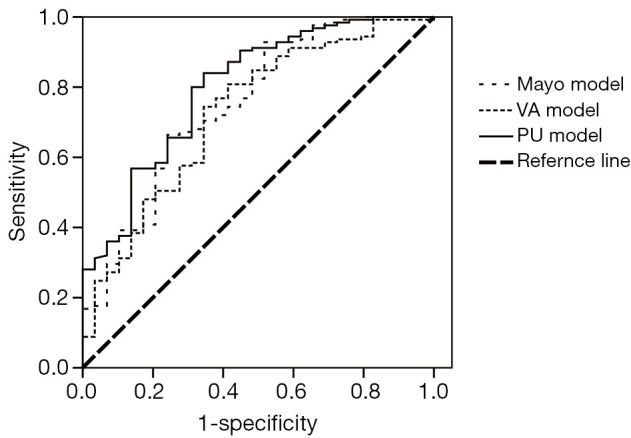
The area under the ROC curve of the PU model [0.800; 95% confidence interval (CI): 0.708-0.891] was higher than that of the Mayo model (0.753; 95% CI: 0.650-0.857) or VA model (0.728; 95% CI: 0.623-0.833); however, this finding was not statistically significant. To varying degrees, calibration curves showed that all three models overestimated malignancy.
Conclusions
The three predicted models have similar accuracy for prediction of SPN malignancy, although the accuracy is not sufficient. For Chinese patients, the PU model may has greater predictive power.
Keywords: Solitary pulmonary nodule (SPN), benign and malignant, model, comparison
Introduction
A solitary pulmonary nodule (SPN) is radiologically defined as an intraparenchymal lung lesion that is less than 3 cm in diameter and is not associated with atelectasis or adenopathy (1). Timely identification of a malignant SPN is essential for prognosis because the treatment strategies for a malignancy are different from those for a benign nodule (2). In patients who are surgical candidates, malignancy should be identified promptly (when present) and receive timely resection. Ideally, surgery should be avoided in patients with nodules that prove to be benign (3). However, identifying a malignant SPN is challenging. Most clinicians diagnose based on their clinical experience, which may be subjective. A mathematical prediction model facilitates this task, avoiding subjective and one-sided judgment. To date, only three organizations have constructed SPN prediction models—the Mayo (4), VA (5), and Peking University (PU) (6) models.
The Mayo Clinic model is defined by the equations: Pre-test probability of a malignant SPN = ex/(1+ex), x= –6.8272+ (0.0391× age) + (0.7917× smoking history) + (1.3388× cancer history) + (0.1274× diameter) + (1.0407 × spiculation) + (0.7838× upper lobe), e is the natural logarithm, and 1 for yes and 0 for no in the smoking history, cancer history, spiculation and upper lobe elements. Diameter indicates the largest nodule measurement (in mm) reported on initial chest radiograph or CT scan. When the probability was <3%, watchful waiting was preferred. When the probability was 3% to 68%, needle biopsy was preferred. When the probability was >68%, surgery was preferred.
The VA model is defined by the equations: Pre-test probability of a malignant SPN = ex/(1+ex), x= –8.404+ (2.061× smoking history) + (0.779× age10) + (0.112× diameter) – (0.567× yearsquit10), e is the natural logarithm, and 1 for yes and 0 for no in the smoking history; age10 indicates age in years at the time of nodule identification, divided by 10; diameter indicates the largest nodule measurement (in mm) reported on initial chest radiograph or CT scan; and yearsquit10 indicates the number of years since quitting smoking, divided by 10 (0 indicates not applicable). When the probability was <20%, watchful waiting was preferred. When the probability was 20% to 69%, needle biopsy was preferred. When the probability was >69%, surgery was preferred.
The PU model is defined by the equations: Pre-test probability of a malignant SPN = ex/ (1+ex), x= –4.496+ (0.07× age) + (0.676× diameter) + (0.736× spiculation) + (1.267× family history of cancer) – (1.615× calcification) – (1.408× border), e is the natural logarithm, and 1 for yes and 0 for no in the last four elements. Diameter indicates the largest nodule measurement (in cm) reported on initial chest radiograph or CT scan. When the probability was <46.3%, the nodule should be considered benign. When the probability was >46.3%, the nodule should be considered malignant.
This study aimed to evaluate the sensitivity of the three models in verifying a malignant SPN using a set of data using calibration and receiver operating characteristics (ROC) curves.
Materials and methods
We retrospectively reviewed the medical records of 160 patients with SPNs who underwent surgical resection between July 2009 and June 2011. The present study recruited patients who underwent computed tomography (CT) scans at Guangdong General Hospital and without a previous diagnosis of lung cancer. Patients with extrathoracic cancer within 5 years of nodule identification were excluded (n=6). A total of 154 patients were finally enrolled in our study, comprising 88 males and 66 females, mainly from the south of China. This study was approved by the hospital ethics committee.
Clinical data were collected, including age, gender, smoking history, history of a previous cancer diagnosis, family history of cancer, pathological diagnosis, and radiology characteristics.
All patients underwent surgical resection of SPNs and pathological diagnoses were obtained. Pulmonary wedge resection and lobectomy were performed in these patients.
Clinical data of 154 patients were calculated by three models separately. The calculation outcomes of the Mayo, VA, and PU models were compared. Analyses were performed using commercially available software packages (SPSS for Windows version 17.0 and Medcalc for Windows version 11.4.2.0). Values of P<0.05 were deemed to indicate statistical significance. ROC curves were created, and the areas under the curve (AUCs) were calculated and compared using the Medcalc software (version 11.4.2.0).
According to the predicted probabilities, we divided the entire dataset into five equal groups. By plotting the median probability of each group, a calibration curve that described the distinction between the predicted probability and observed frequency of malignancy for that group was created.
Results
Pathological results
Of all SPN patients, 29 (18.8%) cases were benign, including 5 tuberculomas, 6 hamartomas, 11 inflammatory pseudotumors, 3 pulmonary sclerosing hemangiomas, 2 atypical adenomatous hyperplasia, 1 fibrosis nodule, and 1 lung adenoma. One hundred and twenty-five (81.2%) cases were malignant, including 104 adenocarcinomas, 14 squamous carcinomas, 2 small-cell carcinomas, 4 large-cell carcinomas, and 1 neuroendocrine carcinoma.
Comparison of the malignant and benign groups
Fifty-seven percent of the patients were males, with a mean age of 58.1 years. As shown in Table 1, age, size, spiculation and border were significantly different between malignant and benign SPNs. However, family history of cancer, previous cancer history >5 years, and smoking history were not significantly different between the malignant and benign groups.
Table 1. Clinical data of the malignant and benign groups.
| Clinical features | Full sample (n=154) | Benign (n=29) | Malignant (n=125) | P |
|---|---|---|---|---|
| Age in years [range] | 58.1 [30-88] | 51.0 [30-67] | 59.7 [32-88] | <0.001* |
| Gender, N (%) | ||||
| Male | 88 (57.1) | 18 (62.1) | 70 (56.0) | 0.552 |
| Female | 66 (42.9) | 11 (37.9) | 55 (44.0) | |
| Family history of cancer, N (%) | ||||
| Yes | 17 | 0 (0) | 17 (13.6) | 0.076 |
| No | 137 | 29 (100.0) | 108 (86.4) | |
| Previous cancer history >5 years, N (%) | ||||
| Yes | 2 | 0 (0) | 2 (1.6) | 1.000† |
| No | 152 | 29 (100.0) | 123 (98.4) | |
| Smoking history, N (%) | ||||
| Never smoker | 105 | 22 (75.9) | 83 (66.4) | 0.324‡ |
| Current or former smoker | 49 | 7 (24.1) | 42 (33.6) | |
| Current smoker | 39 | 7 (24.1) | 32 (25.6) | |
| Former smoker | 10 | 0 (0) | 10 (8.0) | |
| Mean pack-years [range] | 38.3 [0-120] | 36.4 [0-120] | 38.7 [0-80] | 0.801 |
| Mean years quit | 6.0 | 0 | 6.0 | |
| Location of SPN, N (%) | ||||
| Upper lobe | 82 | 17 (58.6) | 65 (52.0) | 0.520 |
| Middle or lower lobe | 72 | 12 (41.4) | 60 (48.0) | |
| Median nodule size in mm [range] | 20 [3-30] | 17 [3-29] | 21 [6-30] | 0.001 |
| Spiculation, N (%) | ||||
| Yes | 112 | 12 (41.4) | 100 (80.0) | <0.001 |
| No | 42 | 17 (58.6) | 25 (20.0) | |
| Border, N (%) | ||||
| Clear | 46 | 17 (58.6) | 29 (23.2) | <0.001 |
| Not clear | 108 | 12 (41.4) | 96 (76.8) | |
| Calcification, N (%) | ||||
| Yes | 7 | 1 (3.4) | 6 (4.8) | 1.000§ |
| No | 147 | 28 (96.6) | 119 (95.2) |
Data presented as N (%) unless otherwise indicated. t-tests were performed for continuous variables. χ2 tests were performed for categorical variables. ‡, P values were obtained by comparison of the never smoker and current or former smoker groups; *, Wilcoxon’s rank-sum test; †, Fisher’s exact test; §, Continuity correction. SPN, solitary pulmonary nodule.
Validation of the Mayo model
Based on the applicable conditions of the Mayo model, we excluded six patients who had a previous cancer history of more than 5 years. Of the remaining 154 patients, we constructed the ROC curve and calculated the AUC to be 0.753 [95% confidence interval (CI): 0.650-0.857].
Validation of the VA model
The applicable conditions of the VA model included patients with a previous cancer history of more than 5 years. These SPNs tend to be malignant and were suggested to undergo surgical resection, so we excluded these six cases. The area under the ROC curve was 0.728 (95% CI: 0.623-0.833). If the six cases were included, the area under the ROC curve was 0.736 (95% CI: 0.635-0.838). If only male patients were included, the area under the ROC curve of the 88 male patients was 0.707 (95% CI: 0.580-0.834). If only smokers were included, the area under the ROC curve of the 49 smoker patients was 0.701 (95% CI: 0.513-0.889).
Validation of the PU model
According to the applicable conditions of the PU model, we also excluded six patients who had a previous cancer history of more than 5 years. For the remaining 154 patients, the area under the ROC curve was 0.800 (95% CI: 0.708-0.891).
Comparison of areas under the ROC curve
Using the Medcalc software, we compared the AUCs among the three models. The p values were 0.82 between the Mayo and VA models, 0.49 between the Mayo and PU models, and 0.35 between the VA and PU models. Therefore, the AUCs of the three models did not demonstrate statistically significant differences. Figure 1 shows the ROC curves of the three models.
Figure 1.

Receiver operating characteristics (ROC) curves of the three models. VA, Department of Veterans Affairs; PU, Peking University.
Predicted probabilities of the three models
Table 2 shows the interval distribution of each model according to the predicted results, recommended strategies, and pathological diagnosis.
Table 2. Predicted results and interval distribution of the three models.
| Model | Probability (%) | Pathological results (No.) |
Accuracy (positive predict value) (%) | |
|---|---|---|---|---|
| Benign | Malignant | |||
| Mayo model | <3 | 2 | 0 | 100 |
| 3-68 | 25 | 102 | ||
| >68 | 2 | 23 | 92.0 | |
| VA model | <20 | 19 | 42 | 31.1 |
| 20-69 | 9 | 60 | ||
| >69 | 1 | 23 | 95.8 | |
| PU model | <46.3 | 18 | 20 | 47.4 |
| >46.3 | 11 | 105 | 90.5 | |
Mayo model: sensitivity =100%, specificity =50%; VA model: sensitivity =35.4%, specificity =95%; PU model: sensitivity =84%, specificity =62.1%. VA, Department of Veterans Affairs; PU, Peking University.
Calibration curves of the three models
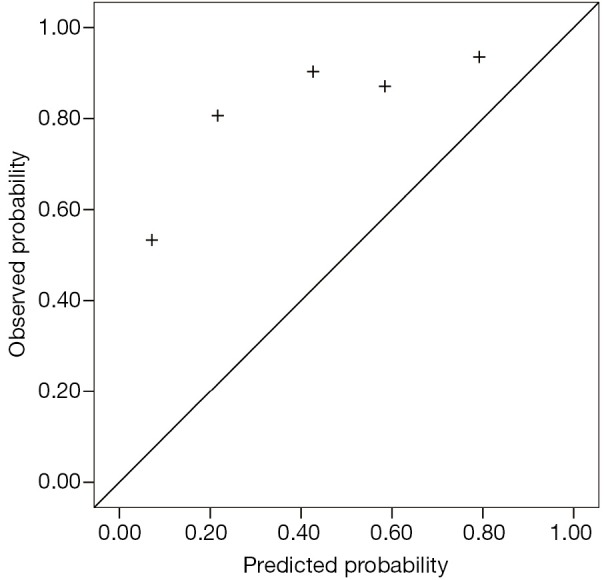
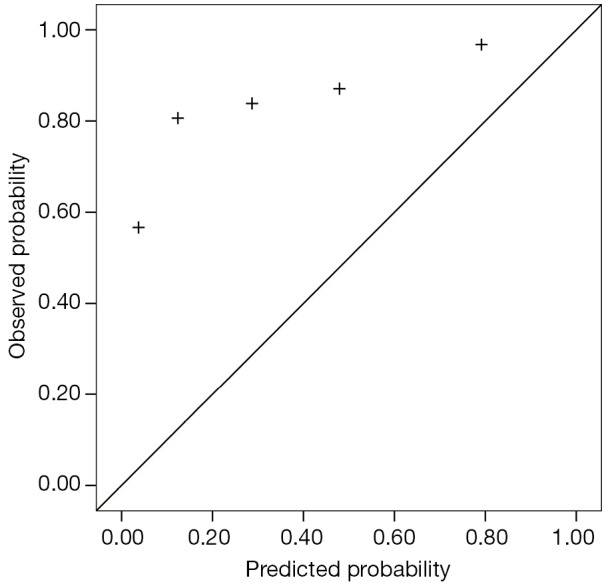
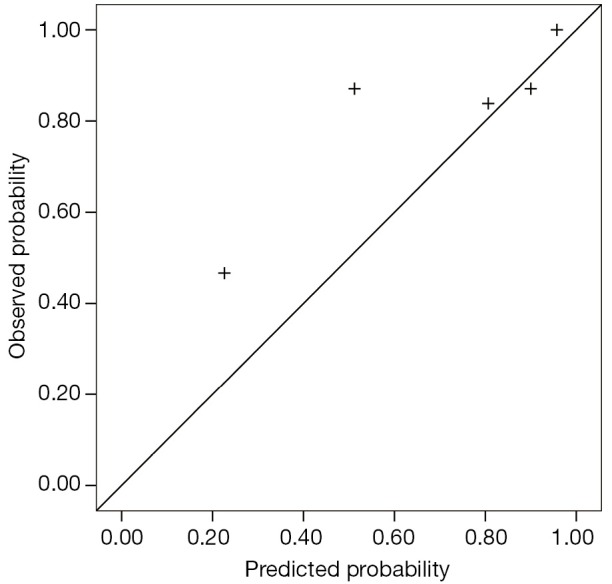
The calibration curves for the Mayo, VA and PU model, describing the distinction between the predicted probability and observed frequency of malignancy, is shown in Figures 2,3,4.
Figure 2.

The calibration curve for the Mayo model.
Figure 3.

The calibration curve for the VA model. VA, Department of Veterans Affairs.
Figure 4.

The calibration curve for the PU model. PU, Peking University.
Discussion
The Mayo, VA, and PU models were validated in terms of the accuracy of SPN diagnosis by collecting clinical and imaging information. Our study reveals that the accuracies of the three models were not significantly different.
The Mayo model, published in 1997, was the first to focus on SPN. Between 1984 and 1986, Swensen et al. at the Mayo Clinic retrospectively reviewed the medical records and imaging tests of 629 SPN patients (51% male) newly discovered with a malignancy rate of 23%. This group of patients lived locally for at least 20 years; thus, limitations in the data existed. However, in our results, the area under the ROC curve of the Mayo model was 0.753, which was higher than that of the VA model. With a classified process of three intervals, the false-positive (8%) and false-negative (0%) rates were low, providing reliable suggestions to clinicians. The calibration curve showed that the Mayo model underestimated the probability of malignancy in low-risk patients.
The VA model was established in 2007 using the records of 375 SPN cases were collected from the Department of Veterans Affairs. The data were unbalanced because 98% of patients were male, and 94% had a smoking history. Thus, we found that smoking history has heavy weightings in the VA model, indicating that if a patient does not smoke, the calculated probability of the model may change considerably. This explains why the VA model showed poor accuracy. Additionally, a large proportion (68.9%) of patients was in the <20% probability interval, producing malignant pathological results. The area under the ROC curve did not improve in the male or smoker group. The calibration curve also showed that the Mayo model underestimated the probability of malignancy in low-risk patients, different from the actual situation.
The PU model was presented in 2011, and comprised 371 SPN patients who underwent surgery at the People’s Hospital of PU. The area under the ROC curve (0.800) was higher than those of the other two models; however, with the judgment of a spot, half of the patients had undergone unnecessary surgeries. We suggested dividing the entire region into three probability intervals; i.e., malignant, benign, and further examination. The calibration curve showed that the five groups of the PU model matched more closely the true circumstance than the other two models, excluding the second group. High-resolution CT should be performed on patients in the PU model because imaging characteristics are necessary factors in the calculation.
Although medical records with inferior radiological technology were collected during 1984 to 1986 in Mayo model, it revealed high predictive value in this study. We suggested that Mayo model could be applied in some undeveloped area or some hospital without high-resolution CT scans. However, PU model, which collected medical records including high-resolution CT scans, showed the highest AUC and the best calibration curve. Accordingly, PU model set higher requirements to the doctors and equipments in medical image center.
As a high percentage (81.2%) of malignant SPN patients existed in our population, the calibration curve did not perform well. Because the observed probability of malignancy of the five groups was higher than the predicted values, particularly for low-risk patients, the curve tended to underestimate malignant probability.
Schultz and colleagues (7) calculated an AUC of 0.80 (95% CI: 0.72-0.88) for the Mayo model and 0.73 (95% CI: 0.64-0.82) for the VA model. Data characteristics of this study were similar to those of the VA model, with 96% male patients and 89% smokers. The difference between the two models was not statistically significant.
In conclusion, clinicians should use an SPN predictive model based on the local epidemiology of lung cancer. Another study showed that if the SPN malignancy rate of the hospital was similar to that of one of the selected models, a higher diagnostic accuracy would result (8). The AUC of the Peking model was the highest of the three models, and the calibration curve fit better with our results. Thus, the PU model should be applied in the south of China.
In conclusion, clinicians should choose an SPN predictive model based on the local epidemiology of lung cancer. And, the PU model should be applied in the China and similar area.
Acknowledgements
Guarantor: Xue-Ning Yang takes responsibility for the content of the manuscript, including the data and analysis.
Authors’ contributions: Hong-Hong Yan directed and confirmed the statistical methods. Xuan Zhang collected data and wrote the manuscript. Jun-Tao Lin, Ze-Hua Wu, Jia Liu and Xu-Wei Cao collected data. Xue-Ning Yang designed the study and confirmed that the study objectives and procedures are honestly disclosed.
Funding: This research was granted by the initiative research scheme for college student, Guangdong, China (No. 1212110046).
Disclosure: The authors declare no conflict of interest.
References
- 1.Tan BB, Flaherty KR, Kazerooni EA, et al. The solitary pulmonary nodule. Chest 2003;123:89S-96S. [DOI] [PubMed] [Google Scholar]
- 2.Ost D, Fein AM, Feinsilver SH. Clinical practice. The solitary pulmonary nodule. N Engl J Med 2003;348:2535-42. [DOI] [PubMed] [Google Scholar]
- 3.Gould MK, Sanders GD, Barnett PG, et al. Cost-effectiveness of alternative management strategies for patients with solitary pulmonary nodules. Ann Intern Med 2003;138:724-35. [DOI] [PubMed] [Google Scholar]
- 4.Swensen SJ, Silverstein MD, Ilstrup DM, et al. The probability of malignancy in solitary pulmonary nodules. Application to small radiologically indeterminate nodules. Arch Intern Med 1997;157:849-55. [PubMed] [Google Scholar]
- 5.Schultz EM, Sanders GD, Trotter PR, et al. Validation of two models to estimate the probability of malignancy in patients with solitary pulmonary nodules. Thorax 2008;63:335-41. [DOI] [PMC free article] [PubMed] [Google Scholar]
- 6.Li Y, Chen KZ, Wang J. Development and validation of a clinical prediction model to estimate the probability of malignancy in solitary pulmonary nodules in Chinese people. Clin Lung Cancer 2011;12:313-9. [DOI] [PubMed] [Google Scholar]
- 7.Schultz EM, Sanders GD, Trotter PR, et al. Validation of two models to estimate the probability of malignancy in patients with solitary pulmonary nodules. Thorax 2008;63:335-41. [DOI] [PMC free article] [PubMed] [Google Scholar]
- 8.Isbell JM, Deppen S, Putnam JB, Jr, et al. Existing general population models inaccurately predict lung cancer risk in patients referred for surgical evaluation. Ann Thorac Surg 2011;91:227-33; discussion 233. [DOI] [PMC free article] [PubMed] [Google Scholar]


