

Lymphocyte function–associated antigen 1 (LFA-1) and its ligands are essential for immune cell interactions. LFA-1 is regulated through conformational changes. The relationship between molecular conformation and function is unclear. Förster resonance energy transfer is used to assess LFA-1 conformation under real-time signaling conditions.
Abstract
Lymphocyte function–associated antigen 1 (LFA-1, CD11a/CD18, αLβ2-integrin) and its ligands are essential for adhesion between T-cells and antigen-presenting cells, formation of the immunological synapse, and other immune cell interactions. LFA-1 function is regulated through conformational changes that include the modulation of ligand binding affinity and molecular extension. However, the relationship between molecular conformation and function is unclear. Here fluorescence resonance energy transfer (FRET) with new LFA-1–specific fluorescent probes showed that triggering of the pathway used for T-cell activation induced rapid unquenching of the FRET signal consistent with extension of the molecule. Analysis of the FRET quenching at rest revealed an unexpected result that can be interpreted as a previously unknown LFA-1 conformation.
INTRODUCTION
LFA-1 plays a significant role in the pathogenesis of numerous autoimmune and inflammatory diseases (Yusuf-Makagiansar et al., 2002; Hyun et al., 2009). Blocking integrin-dependent adhesion and using LFA-1 as a target for drug delivery represent possible therapeutic approaches in the treatment of multiple hematologic malignancies (Schmidmaier and Baumann, 2008; Phongpradist et al., 2010). Therefore our understanding of LFA-1 physiology is essential for the success of future LFA-1–related therapeutic applications.
LFA-1–dependent cell adhesion is regulated by a series of conformational changes within the molecule that are induced by signaling triggered by other cell receptors. Numerous immune receptor ligands, chemoattractants, and chemokines can initiate this so-called “inside-out” signaling cascade (Laudanna et al., 2002; Alon and Feigelson, 2009; Zarbock and Ley, 2009). This pathway serves as a basis for cell adhesion, retention, and chemotaxis toward sites of inflammation and secondary lymphoid tissues (Ley et al., 2007). Integrin activation represents a mechanism for the arrest of rolling leukocytes on the endothelial surface under shear flow (Laudanna and Alon, 2006). A model for rapid LFA-1 integrin activation includes at least three conformations: folded (bent) low affinity, extended low or intermediate affinity, and extended high affinity (Laudanna and Alon, 2006; Hogg et al., 2011). LFA-1 extension is implicated in LFA-1–mediated rolling (Salas et al., 2004, 2006; Chigaev and Sklar, 2012a).
Previously we developed a fluorescence resonance energy transfer (FRET)–based approach for studying molecular extension of another leukocyte integrin, very late antigen-4 (VLA-4), on live cells and in real time (see Figure 1 in Chigaev et al., 2007; also see Chigaev et al., 2003). This approach has been used to identify several previously unknown VLA-4 conformations (Chigaev et al., 2007, 2009) and decode the complexity of VLA-4 conformational regulation through “inside-out” signaling pathways (Chigaev et al., 2008; Chigaev and Sklar, 2012a). The present work provides the first description of a novel FRET-based methodology for detecting the molecular extension of LFA-1 that includes a set of novel fluorescent probes, based on use of the LFA-1–specific allosteric antagonists BIRT 377 and XVA-143 and a novel lipid acceptor probe. A real-time flow cytometry approach allowed us to conduct experiments on live cells and at natural receptor abundance. No transfected cells or engineered or overexpressed proteins were used in this study.
Because the distance between ligand-binding sites for the two probes is comparable to the Förster distance for the two fluorophores, we detected a significant difference between quenching kinetics for BIRT 377– and XVA-143–based probes. Very rapid signal quenching detected for the XVA-143–based probe suggests that at rest, without cell activation, the XVA-143 ligand-binding site is located in close proximity to the membrane. Triggering the signaling pathway relevant to the activation of T-cells induced rapid unquenching of the FRET signal, which is consistent with rapid extension of the molecule. The extension was found to be calcium dependent. Thus the FRET-based LFA-1 extension assay provides essential information for our understanding of LFA-1 conformational regulation of leukocyte adhesion.
RESULTS
FRET probes binding sites
BIRT 377 and XVA-143 (Figure 1) belong to two distinct classes of allosteric antagonists, α I allosteric antagonists and α/β I–like allosteric antagonists (Shimaoka and Springer, 2003). The BIRT 377 binding site is located within the I domain of the αL integrin subunit, and it binds in the hydrophobic pocket underneath the C-terminal α-helix (Figure 2). The XVA-143 site is located between the αL β-propeller and the β2 subunit I–like domain. To estimate the distance between the two ligand-binding sites, we built a three-dimensional (3D) homology model of the LFA-1 structure and placed two allosteric antagonists into the binding sites. The crystal structure of the complex of the LFA-1 (CD11a) αL I domain with lovastatin (Protein Data Bank: 1CQP) was used as a template for placement of both BIRT 377 and XVA-143 ligands. We used the Molecular Operating Environment (MOE) software to estimate the distance between these two ligands (Figure 2). Because the estimate obtained (∼43 Å) was comparable to the Förster distance (R0) for the fluorescein–rhodamine FRET pair (55 Å; Chigaev et al., 2003, and references therein), we compared FRET between fluorescein-conjugated analogues of BIRT 377 and XVA-143 and membrane-incorporated lipid acceptors, as was done previously for VLA-4 (Chigaev et al., 2003, 2007). We hypothesized that the difference in the distance between probe binding sites would directly affect the distance of closest approach (rc) to the cell membrane. Thus FRET could serve as an “intramolecular ruler” to provide information about relative positions of the probes in different integrin activation states (Figure 2).
FIGURE 1:

Structure of LFA-1 allosteric antagonist–based fluorescent probe donors and FRET acceptor. (A) BIRT-FITC and (B) XVA-FITC donor probes were designed and synthesized at the Department of Chemistry and Chemical Biology, University of New Mexico, by Y.Z. and W.W. Allosteric antagonist moieties are indicated in blue. Fluorescein moiety is shown in green. (C) The structure of PKH 26 fluorescent dye used as FRET acceptor is not available from Sigma-Aldridge; however, according to Life Technologies, the PKH 26 dye is structurally identical to DiIC18(3), 1,1′-dioctadecyl-3,3,3′,3′-tetramethylindocarbocyanine perchlorate, shown in the figure.
FIGURE 2:

Homology model of LFA-1 integrin in bent and extended conformations built as described in Materials and Methods. LFA-1 domains are colored and labeled according to Shimaoka and Springer (2003). Two allosteric antagonists placed into the corresponding binding sites shown as gray and red space-filling models are highlighted by a red circle for BIRT 377 and a blue circle for XVA-143. The distance between antagonist binding sites (42.92 Å) is shown. The distances of closest approach (rc) between PKH 26 acceptors (shown schematically) incorporated into the membrane and donor probes are shown using arrows. For fully extended LFA-1, rc can be >200 Å. I-EGF, integrin-epidermal growth factor domain; PSI, plexin/semaphorin/integrin domain.
The quenching kinetics of XVA– and BIRT–fluorescein isothiocyanate at rest (without activation) revealed a dramatic difference
Previously, to perform real-time FRET assays, we used octadecyl rhodamine B as an acceptor that incorporates into the plasma membrane and induces rapid probe quenching. However, as a single-chain lipid, it has a tendency to undergo rapid flip-flop between the outer and inner leaflets, as well as get internalized in the cytosolic space. A reduction in acceptor density in the outer leaflet results in the gradual diminution of FRET over time, with a half-time of ∼10 min (Chigaev et al., 2003). To overcome this limitation, we tested a number of fluorescent lipids and selected PKH26, a dye sold by Sigma-Aldrich (St. Louis, MO). It has two C18 chains (Figure 1), exhibits appropriate absorption characteristics, and provides a better stability of signal.
Addition of saturating concentrations of the donor probes induced rapid probe binding, which reached equilibrium within 2–3 min. Addition of PKH26 resulted in quenching of both probes. However, the real-time kinetics was dramatically different. For XVA–fluorescein isothiocyanate (FITC), quenching reached its maximum during the first minute after the addition of lipid acceptor. For the BIRT-FITC probe, quenching required several minutes (Figure 3). The difference between the quenching kinetics for BIRT 377 and XVA-143 fluorescein-conjugated analogues was maintained over a range of PKH26 concentration (0.25–4 μM; Figure 3, C and D).
FIGURE 3:

Binding and quenching kinetics for two LFA-1–specific probes. The experiment involves sequential additions of fluorescent donor probes (XVA-FITC, 100 nM [A, C], or BIRT-FITC, 60 nM [B, D]) and the PKH 26 acceptor probe, 0.5 μM (A, B), 0.25–2 μM (C), and 0.25–4 μM (D). Control samples were treated with vehicle (DMSO). A representative experiment of three independent experiments is shown. Each experimental point represents an average of several hundred events acquired with 1-s time resolution. Initial parts of the quenching curves were fitted to a single-exponential decay equation. Decay constants (k) are indicated on C and D.
Quenching kinetics of XVA- and BIRT-FITC was independent of the other allosteric antagonist and cell metabolic activity
The unexpected difference in the quenching kinetics of XVA-FITC and BIRT-FITC probes promoted a series of experiments aimed at identifying possible reasons for this observation. Because energy transfer depends on the distance of closest approach between the FRET donor and acceptor and does not discriminate vertical and horizontal probe separation, lateral probe segregation or partitioning into different phases of lipids could directly affect quenching efficiency (Buranda et al., 2010). However, because both probes are targeting the same receptor on the cell surface (LFA-1), selective lipid acceptor segregation is unlikely.
Another possibility is that ligands by themselves can actively affect integrin conformation. Based on cell rolling data and epitope exposure, it has been proposed that XVA-143 induces an extended conformation of LFA-1 (Salas et al., 2004), whereas BIRT 377 blocks the induction of the mAb24-activated integrin reporter epitope and stabilizes a bent, low-intermediate affinity conformation (Woska et al., 2001; Larson et al., 2005; Green et al., 2006). To study the effect of XVA-143 on BIRT-FITC quenching kinetics and vice versa, we sequentially treated cells with the fluorescent ligand as donor and a large excess (10-fold) of the unlabeled allosteric antagonists (Figure 4, A and B). No significant change was detected. Thus the addition of unlabeled XVA-143 and BIRT 377 had no significant effect on the real-time quenching kinetics of BIRT-FITC and XVA-FITC probes, respectively.
FIGURE 4:
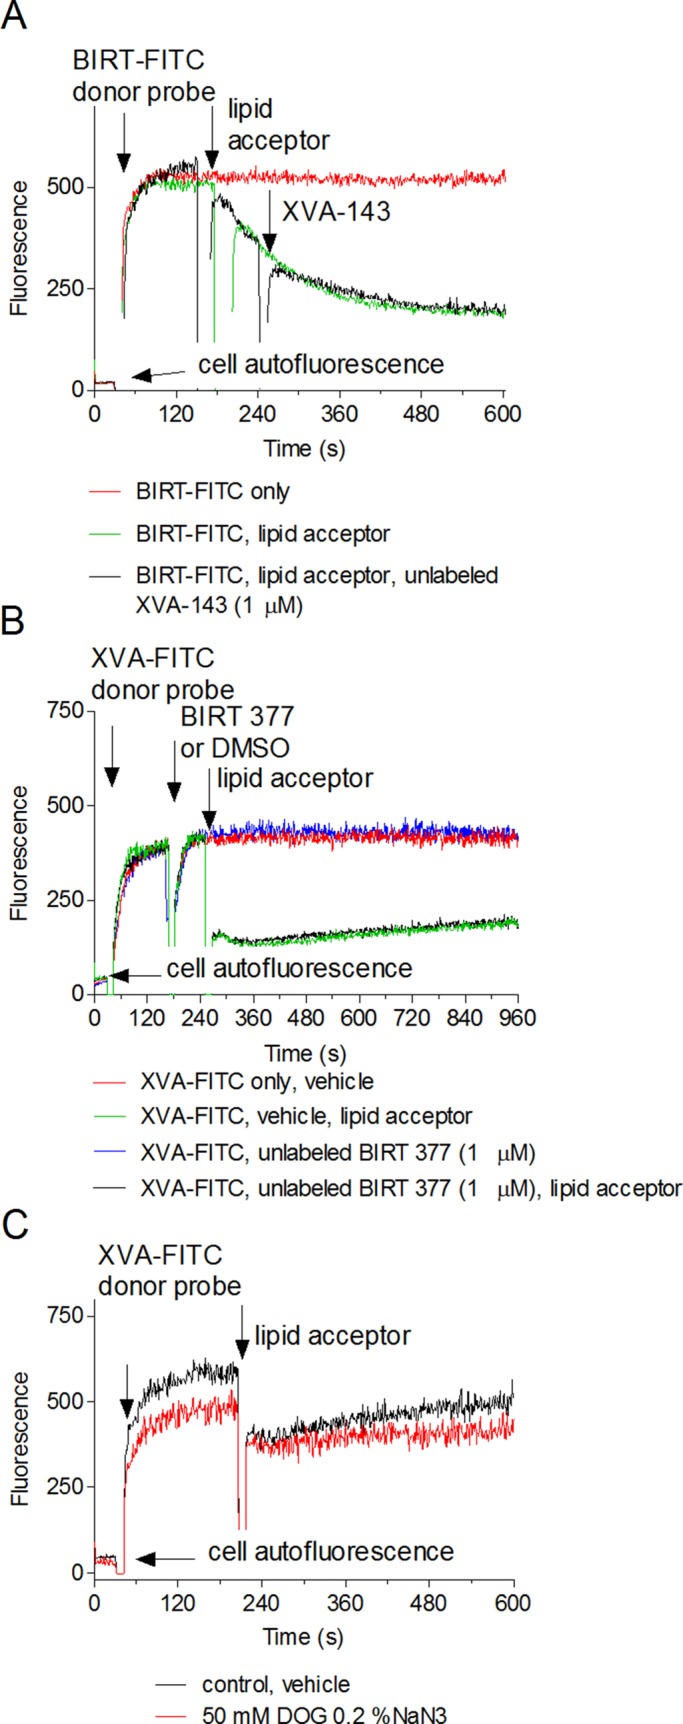
Effect of unlabeled allosteric antagonists (A, B) and cell metabolic activity (C) on real-time quenching of FRET donors. Cell were sequentially treated with 60 nM BIRT-FITC (A), 100 nM XVA-FITC, the PKH 26 acceptor (0.5 μM), and 1 μM unlabeled XVA-143 (A), or BIRT 377 (B). Controls were treated with vehicle (DMSO). The order of compound addition is indicated by arrows. (C) Before the experiment, cells were preincubated with a mixture of metabolic inhibitors (0.2% sodium azide and 50 nM 2-deoxy-d-glucose) for 5 min at 37°C. Control sample was pretreated with vehicle (DMSO). Next fluorescent donor (XVA-FITC, 100 nM) and acceptor (PKH 26, 0.5 μM) were sequentially added to the cell mixture. Each experimental point represents an average of several hundred events acquired with 1-s time resolution. Each line represents a mean of two runs (n = 2) calculated on a point-by-point basis. One representative experiment of three experiments is shown.
Finally, because the integrin state, mediated by receptor cytoplasmic domains, depends on active cellular metabolism (O'Toole et al., 1994), we treated cells with the mixture of metabolic inhibitors, sodium azide, and 2-deoxy-d-glucose. In our experience (unpublished data), this mixture rapidly down-regulates the affinity of activated VLA-4 to its resting state. No significant effect on the quenching kinetics of XVA-FITC or BIRT-FITC was detected (Figure 4C). In all experiments, the initial rate of XVA-FITC quenching was faster than for BIRT-FITC. Thus the difference in the kinetics of the LFA-1xspecific ligand quenching was independent of the presence of unlabeled XVA-143 and BIRT 377 or cellular metabolism.
Estimated difference between the distances of closest approach for XVA-143 and BIRT 377 at rest is similar to the distance between the two ligand-binding sites
In our experiments, addition of PKH26 as the FRET acceptor to the cell suspension results in rapid partitioning of the molecules into the cell membrane. This process can be monitored in FL2 (the red fluorescence channel of the FACScan) and did not reach equilibrium for >∼5000 s. Therefore a real-time quenching curve represents a loss of donor fluorescence induced by an increasing acceptor surface density over time due to continuous acceptor incorporation. Because we are focusing on the initial time interval after PKH26 addition, acceptor incorporation can be considered linear. A precise quantitative determination of the acceptor density (ac/R02) in the vicinity of a particular receptor represents a complex task, in part due to membrane heterogeneity (Buranda et al., 2010). However, assuming that membrane lipid incorporation is not significantly affected by the binding of small ligands, in which the binding sites have no direct membrane contact (Figure 2), we can use the difference in the initial quenching rates to estimate the relative difference in the distance of closest approach.
We plotted energy transfer as a function of acceptor density for multiple distances of closest approach expressed in terms of the Förster distance (rc/R0) according to the calculations of Wolber and Hudson (1979; see later discussion of Eq. 4; Figure 5A). Next we evaluated the initial rates of acceptor quenching as the slopes of the dashed lines for every distance of closest approach. We then normalized slopes relative to the slope of the line corresponding to 0R0 or 0.7R0 distance (rc/R0 = 0 or 0.7, slope = 1) and show them below the graph in Figure 5A.
FIGURE 5:

Energy transfer as a function of donor distance of closest approach expressed in terms of R0 according to the calculations of Wolber and Hudson (Eq. 4) and the estimated relative difference between the distance of closest approach (rc) for BIRT-FITC and XVA-FITC probes bound to LFA-1. (A) Theoretical quenching curves calculated according to Eq. 4 and initial rates of acceptor quenching. The absolute initial quenching rates were evaluated as the slopes of the dashed lines for each distance of closest approach. Next slopes were normalized, assuming the slope of the line corresponding to 0R0 or 0.7R0 distance is equal to 1 (rc/R0 = 0 or 0.7, slope = 1) and summarized in Table 1. (B) Experimentally determined initial quenching rates as for the experiments shown in Figure 3. Kinetic curves were normalized assuming that the initial signal before the addition of the acceptor is equal to 1 and maximal donor quenching at its peak is equal to 0. Next slopes of the initial quenching curves were calculated (see Figure 3, slope) and normalized to the slope of the XVA-FITC curve. Average values of three experimental determinations. Normalized values ± SEM are shown next to the bars. Asterisk, significantly different (p < 0.05) as estimated by unpaired t test using Prism software. (C) Proposed model of the LFA-1 resting conformation. Slower quenching rates for the BIRT-FITC probe can be interpreted as if the distance of the closest approach for this probe (rc2) is ∼(0.6–1.0)R0 larger than the distance for XVA-FITC probe (rc1), and thus the BIRT 377 binding site is positioned farther away from the membrane. Red arrow and a question mark indicate the proposed position of the α I domain, where the BIRT 377 site is located.
To estimate the relative initial rates of acceptor quenching in cells, we used real-time quenching curves. Because the Wolber and Hudson model is only valid for acceptor densities <0.5 acceptor/R02, we focused on the analysis of the early quenching kinetics, for which acceptor densities are the lowest. We evaluated the slopes of the lines starting at the point of lipid acceptor addition (dashed lines in Figure 3). We normalized quenching curves, assuming that the initial fluorescence (before PKH26 addition) is equal to 1 and maximal quenching is equal to 0. Because the addition of the acceptor creates a 5- to 10-s gap in the time course and the majority of XVA-FITC quenching occurs during this time, the rate of XVA-FITC quenching should be considered a lower limit (the actual rate can be faster). No such problem exists for BIRT-FITC because the quenching is slow (Figure 3B). Next we plotted the slopes and normalized them to the slope of XVA-FITC (Figure 5B). These data are compared with the theoretical data presented in Figure 5A (numbers in red).
Rapid quenching of XVA-FITC as compared with the BIRT-based probe can be interpreted as indicating that, at rest, the XVA-143 binding site is closer to the membrane. According to the theory, the initial slope of the quenching curve changes about one order of magnitude (from 1.00 to 0.09) when the distance of closest approach changes from 0R0 to 1.3R0 (Figure 5A). With this result, we can use the experimental slope difference to estimate the relative distance between the two binding sites. Because the absolute position of the XVA-143 site relative to the membrane is unknown, several assumptions can be made. If the XVA-FITC resides close to the membrane (rc/R0 = 0), a relative slope of ∼0.3 corresponds to a distance of ∼rc/R0 = 1 (Figure 5A). If XVA-FITC is positioned farther away from the membrane (rc/R0 = 0.7), the relative slope value of ∼0.3 results in rc/R0 = 1.3, and Δ(rc/R0) = (1.3 − 0.7)R0 = 0.6R0. Thus, depending on the initial position of XVA-FITC binding site, the observed difference in the quenching slopes can be attributed to the relative distance of (0.6–1)R0. With R0 in the range 50–55 Å, this puts an estimated difference between distances of closest approach for XVA-143 and BIRT 377 close to the estimate obtained using the 3D structure of LFA-1 model (∼43 Å). Thus the experimentally observed difference in the initial slopes of quenching curves for BIRT-FITC and XVA-FITC can be attributed to the distance between probe binding sites.
These data provide insight into the position of the LFA-1 I domain on the surface of resting cells. According to the current model of LFA-1 conformation, the αL I domain position is envisioned as being aligned with the β2 subunit I–like domain (Figure 2) specifically because of a direct involvement of the C-terminal I domain α7-helix and so-called intrinsic (endogenous) ligand in the regulation of the αL I domain conformation (Alonso et al., 2002; Shimaoka and Springer, 2004). However, the resting integrin state with an inactive I-like domain and free intrinsic ligand creates the possibility for αL I domain flexibility (Figure 5C). Such a conformation could explain the difference in the initial slopes of quenching curves when the distance of closest approach between the BIRT 377 binding site and cell membrane (rc2) is larger than the distance of closest approach for XVA-143 (rc1) by ∼(0.6–1)R0.
Inside-out cell activation results in the unquenching of the donor signal for both allosteric antagonist-based probes
LFA-1 activation is known to be regulated through inside-out signaling by intracellular pathways. The signaling occurs through the cytoplasmic domain and creates multiple conformational states. The molecular extension (unbending) is believed to represent one of the major events that lead to rapid and reversible changes in cellular adhesive properties. For LFA-1, the extended conformation is envisioned as a part of intermediate- and high-affinity states (Lefort and Ley, 2012). It can be observed, for example, using transmission electron microscopy with engineered purified integrins (Nishida et al., 2006). To our knowledge, no prior reports demonstrate an extension of naturally expressed, unmodified LFA-1 integrin on live cells in real time.
To determine whether integrin conformation could be affected by inside-out signaling, we used the human T-cell acute lymphoblastic leukemia cell line. This line can be activated by a mixture of phorbol ester (12-O-tetradecanoylphorbol-13-acetate [TPA]) in combination with thapsigargin (TG) or other Ca2+-elevating agent (Lyubchenko et al., 2001). This drug combination is a substitute for T-cell stimulation via the T-cell receptor (TCR)/CD3 T-cell–specific signaling pathway, and either compound alone is not sufficient to induce full activation (Lyubchenko et al., 2001; and references therein). Cells were sequentially treated with fluorescent probes (XVA-FITC or BIRT-FITC; Figure 6, first arrow), vehicle (dimethyl sulfoxide [DMSO], green lines), or PKH26 (red and blue lines) to induce quenching of the signal (Figure 6, second arrow) and activated with TPA/TG mixture (red and green lines) or control (DMSO, no activation, blue line; Figure 6, third arrow). Cell activation using TPA/TG resulted in the unquenching of the probe signal to a level equivalent to the unquenched controls samples, for which no lipid acceptor was added (green lines). This complete unquenching of the signal suggests that the donor probes moved away from the acceptor, and the distance of closest approach is much larger than the Förster distance (rc >> R0). This result is expected for fully extended LFA-1, for which the estimated molecular length is >200 Å (Figure 2). It also suggests that the majority of integrins, occupied by the probe, responded to activation stimuli. Because each experimental point represents an average of 500–1000 events acquired by a flow cytometer every second, the majority of cells in the population also responded to the treatment. Thus physiologically relevant inside-out activation results in significant extension of LFA-1.
FIGURE 6:
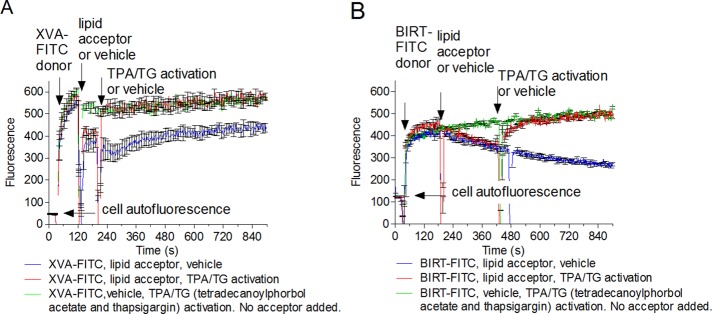
Energy transfer on TALL-104 cells between XVA-FITC (A) and BIRT-FITC (B) donor probes and 1,1′-dioctadecyl-3,3,3′,3′-tetramethylindocarbocyanine (PKH 26) acceptor probe. Real-time FRET experiments are as described in Figure 3, except that cells were treated with (A) XVA-143 donor (100 nM) or (B) BIRT-FITC (60 nM), PKH 26 acceptor (0.5 μM), and a mixture of TPA (500 nM) with TG (10 μM), red line. Control samples were treated with the same concentrations of donor probes, acceptor or vehicle, or a mixture of TPA/TG or vehicle. Each line represents the mean of two determinations (n = 2) calculated on a point-by-point basis. SEM is shown for every 10-s time point.
Phorbol ester alone is not sufficient to induce full donor signal unquenching, and thapsigargin, an intracellular calcium releaser, is necessary to promote full LFA-1 extension
Phorbol esters activate conventional protein kinase Cs (PKCs) by mimicking diacylglycerol in the absence of Ca2+ signaling. To determine whether TPA alone produces a conformational unbending of LFA-1, we performed the FRET assay (Figure 7). Cells were treated with XVA-FITC or BIRT-FITC probes. Next the probe fluorescence was quenched with PKH 26. Cells were then activated by TPA/TG mixture or TPA alone (Figure 7, blue and green lines). DMSO was used as a negative control (Figure 7, black line). Thapsigargin, an inhibitor of sarcoendoplasmic reticulum Ca2+−ATPases that elevates cytoplasmic calcium concentration by depleting intracellular stores, was also later added to TPA-treated cells (Figure 7, red line). Cells treated with TPA alone showed a small decrease in donor fluorescence right after compound addition, followed by slow signal unquenching (Figure 7, green lines). However, by the end of the experiment, it did not reach the level of the fully unquenched signal induced by the TPA/TG mixture. Addition of thapsigargin resulted in a rapid unquenching of the FRET donor (Figure 7, red line) that at the end of the experiment went to the level equivalent to the TPA/TG-activated cells. This result suggests that the distance of closest approach between the probe binding sites and the membrane (rc in Figure 2) was much larger than the Förster distance (rc >> R0) in both cases. Thus cytosolic calcium elevation is necessary for the full extension of LFA-1 integrin.
FIGURE 7:
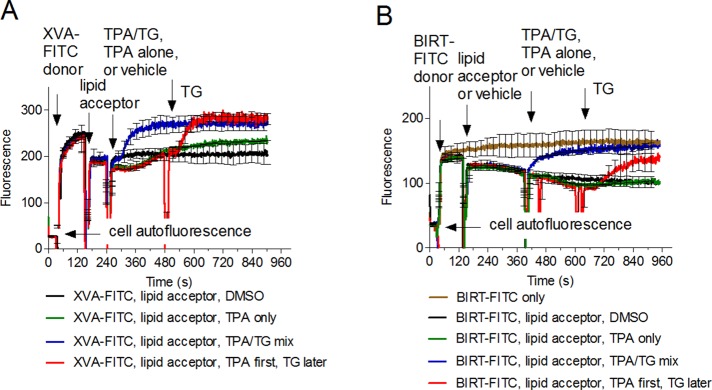
Effect of thapsigargin on energy transfer between donor probes and PKH 26 acceptor probe. Cells were treated with 100 nM XVA-FITC (A) or BIRT-FITC (B), PKH 26 acceptor (0.5 μM), or vehicle (DMSO). Next phorbol ester alone (TPA, green line), TPA/TG mixture (blue line), or vehicle (black line) was added. In addition a sample treated with TPA alone was treated with TG (red line). Note the rapid signal unquenching after the addition of TG (red line), which reaches the level of the TPA/TG mixture (blue line), and the unquenched control (gray line, B). Compound concentrations were analogous to Figure 6. One representative experiment of four experiments is shown. Each line represents the mean of two determinations (n = 2) calculated on a point-by-point basis. SEM is shown for every 25-s time point.
No visible segregation or clustering of LFA-1 molecules can be detected after cell activation
Based on current knowledge about LFA-1 activation and conformational changes, it is tempting to attribute rapid unquenching of the donor fluorescence to the increase in the distance of closest approach between donor and acceptor probes solely due to the straightening of the integrin “legs” from a bent to an extended conformation. However, the FRET models used here do not, on their own, discriminate between lateral and vertical separation distances between the donor and acceptor probes (Chigaev et al., 2003). It is possible that lateral segregation or clustering of the molecules can contribute to the changes in FRET. To address this issue, we tested whether cell treatment affects the gross surface distribution of LFA-1 molecules on the time scale relevant to our experiments. Cells treated in a manner analogous to the flow cytometry experiments were fixed, and LFA-1 molecules were stained using primary labeled monoclonal antibodies (mAbs; Supplemental Figure S3).
We found that the surface distribution of the LFA-1 integrin on TALL-104 cells was moderately diffuse. Minor uneven surface distribution of the fluorescence often described as “integrin clusters” (Supplementary Figure 3, blue arrows) corresponds to the sites of microvilli (Chigaev et al., 2003), as the presence of an additional quantity of membrane in these sites may account for the additional fluorescence. Next we examined the ability of inside-out activation to affect the distribution of LFA-1 molecules (Supplemental Figure S3, C and D). After treatment with the TPA/TG mixture, no observable changes in the lateral distribution of the fluorescence signal within 3–6 min were detected. Thus, on the time scale corresponding to the real-time FRET experiments, no visible changes in redistribution or surface expression of LFA-1 was detected. However, because of the limited resolution of the microscope optical system, these experiments cannot rule out the existence, rapid de novo formation, or dissociation of nanometer-size domains, lipid rafts, or protein clusters. Rapid segregation of the donor probe bound to the receptor protein from the acceptor probe in the membrane for a distance comparable to the Förster distance (R0 ≈ rc) would result in modification of the energy transfer.
DISCUSSION
FRET-based approaches are essential for understanding protein molecular dynamics
Obtaining the crystal structure of a protein usually initiates a large number of studies aimed at understanding the “working cycle” of a specific molecular nanomachine. For integrins, one of the major classes of adhesion molecules, the finding of a “severely bent” extracellular portion (Xiong et al., 2001) resulted in the hypothesis that the bent conformation represents the resting inactive integrin state and the extended state corresponds to the active integrin (Beglova et al., 2002). This hypothesis relied on the exposure of conformationally sensitive mAb epitopes that are described for a large number of integrins. Alone, they can induce (or stabilize) specific integrin conformations (Byron et al., 2009). Additional approaches, including electron microscopy of purified mutated integrins, together with molecular dynamics simulations revealed a complex picture of multiple conformational states that can be directly translated into the different cell adhesive behavior (Shimaoka et al., 2003b; Nishida et al., 2006; Askari et al., 2009; Campbell and Humphries, 2011). However, according to Askari et al. (2009), multiple key questions remain, including that of the relationship of integrin extension and activation.
To understand the role of VLA-4 conformational regulation in cell adhesion, we developed an alternative approach. It relies on fluorescent ligand–mimicking probes that can be used to study modulation of the ligand binding affinity, as well as integrin extension, using a FRET-based approach (Chigaev et al., 2001, 2003, 2007; Chigaev and Sklar, 2012b). FRET is established between a small, integrin-specific ligand donor bound to the integrin head group at saturating concentration, and fluorescent lipid acceptors are incorporated into the cell membrane. These studies can be conducted on naturally expressed, unmodified integrins in primary cells or cell lines under the control of inside-out signaling pathways. The use of real-time flow cytometry in which live, unfixed cells maintained at 37°C are resuspended and continuously mixed in a physiologically relevant solution allows for the addition of various natural or artificial ligands to explore interactions of multiple signaling pathways (Chigaev et al., 2008, 2011a). Thus this approach is very useful for real-time studies of VLA-4 conformation. However, until recently, we were unable to apply this approach to studies of LFA-1.
LFA-1 ligand binding poses additional challenges
Our recent findings indicate that in the absence of inside-out activation, the binding of a small ligand-mimicking probe based on a direct (competitive) antagonist to LFA-1 is extremely slow, as opposed to VLA-4, for which the association rate (kon) for the ligand-mimicking probe is close to the diffusion-limited rate and largely independent of the integrin activation state (Chigaev et al., 2011b; Chigaev and Sklar, 2012a). This makes it impossible to perform a FRET-based extension assay in a manner analogous to VLA-4. To overcome this obstacle, we used fluorescent donors based on LFA-1 allosteric antagonists that bind to LFA-1 integrin without activation (at rest). Because binding sites for these compounds are known and separated by distance similar to the Förster distance (R0) for our donor/acceptor pair, the use of the two probes creates a molecular ruler that can be used to obtain positional information.
Position of allosteric antagonist-based probes at rest
A majority of current LFA-1 conformational models agree on the overall structure of the resting (inactive) conformation of LFA-1. It is depicted as a bent structure, similar to the crystal structure of αXβ2 integrin (Xie et al., 2010), with the α I domain (von Willebrand factor-A, αA domain) pointing downward, or at least parallel to the membrane. To our surprise, the real-time quenching kinetics for the two probes was dramatically different and consistent with an estimate that BIRT-FITC probe was localized ∼(0.6–1)R0 from the XVA-FITC probe and farther from the lipid donor incorporated in the cell membrane. To our knowledge, no such conformations were proposed before (Figure 5C). However, it is also possible that this conformation is a result of the LFA-1 ligation by BIRT 377 and thus a stabilization of an inactive (Woska et al., 2001) and somewhat artificial conformation. The quenching of the XVA-FITC probe was comparable to the quenching of LDV-FITC probe previously used for VLA-4 experiments. Both probes occupy a homologous binding site that is located between the α-subunit β-propeller and β subunit I–like domain (β A domain; Shimaoka and Springer, 2003). Thus, for both VLA-4 and LFA-1 at rest, this site is located close to the membrane-incorporated lipid acceptors.
Distance of closest approach: vertical versus lateral separation
FRET is a distance-dependent interaction between the electronic excited states of two fluorophores for which excitation is transferred from an excited donor to an acceptor. Thus the FRET-based approach used here does not discriminate between lateral and vertical separation distances between the donor and acceptor probes. Moreover, our microscopy data cannot rule out the formation of nanoscopic clusters of integrins or other membrane molecules that could potentially form a “sheath” around integrin receptors “shielding” donor probes from acceptor quenching. One can also hypothesize that lipid acceptors can rapidly partition into a lipid raft or a nonraft microdomain that is laterally separated from donor molecules. However, several experimental results argue that the distance change represents the vertical rather than the horizontal separation between donors and acceptors.
The use of two donor probes bound to two different binding sites on the same receptor molecule creates a unique situation in which the quenching kinetics induced by the incorporation of lipid acceptors can be directly compared. Our observation that the initial rates of the donor probe quenching are dramatically different from the very beginning of the experiment suggests that the probe positioning rather than lateral receptor segregation or lipid acceptor incorporation is important. Moreover, a large excess (10-fold) of the other unlabeled probe introduced into the experimental medium together with each fluorescent donor probe had no effect on the overall quenching kinetics (Figure 4). These experiments suggest that the binding of the probe to the extracellular part of LFA-1 has no significant effect on LFA-1 conformation or on lipid membrane domain structure and composition to the point that it will interfere with the incorporation of the lipid molecules into the membrane. Therefore the difference in the quenching kinetics at rest is more likely attributed to the different probe positioning within the LFA-1 receptor (Figure 8, A and B).
FIGURE 8:

Schematic depiction of energy transfer between donor probes (green) and PKH 26 acceptor probe (red) for different conformational states of LFA-1. Insets schematically show quenching and unquenching kinetics. At rest, the XVA-FITC probe bound to the LFA-1 head group (A) requires a lower density of acceptors and in real-time experiments show rapid quenching kinetics because the probe binding site is located closer to the membrane. BIRT-FITC probe bound to α I domain (B) is located farther away from the membrane. Therefore a higher acceptor density is required for quenching. In real time, this is translated into slower quenching kinetics (compare A and B insets). After LFA-1 extension induced by inside-out activation (arrows on C and D insets), we observed complete unquenching of the probe fluorescence. This suggests that the integrin “leg” extension is sufficient to move both probes out of the FRET range (rc >> R0).
Integrin extension upon activation was first described as a result of the analysis of atomic models and epitope exposure and the analysis of electron microscopy (EM) of purified integrins (Takagi et al., 2002). Based on EM models, the estimated distance between the membrane and the ligand-binding site of the α I domain ranges from 8 to 74 Å for the resting state (bent conformation). On activation, it increases to 230–250 Å (extended conformation; Nishida et al., 2006). Our experimental data are in a good agreement with these distance estimates. At rest, fluorescent probes bound to the LFA-1 head group and the α I domain can be both successfully quenched, as if the distance of closest approach was comparable to the Förster distance (R0 ≈ rc, Table 1; R0 = 50–60 Å). The inside-out activation resulted in the complete unquenching of both donor probes (Figure 6). This suggests that probes were moved out of the FRET range (rc >> R0), which for our pair of fluorophores is >100 Å. Thus, to the best of our knowledge, LFA-1 integrin extension upon activation represents the most plausible explanation for the observed fluorescence intensity changes (Figure 8).
TABLE 1:
Calculated values of R0 for XVA-FITC, BIRT-FITC, and PKH26 pairs for two different dipole–dipole orientation factors, κ2.
| R0 for FRET donor PKH26 pair (Å) | ||
|---|---|---|
| κ2 | XVA-FITC | BIRT-FITC |
| 2/3 | 57.8 | 50.2 |
| 0.476 | 54.6 | 47.4 |
| Average | 56.2 | 48.8 |
Values were calculated as described in Estimation of the Förster distance.
Allosteric antagonists and molecular extension
One of the features assigned to the XVA-143 allosteric antagonist is the ability to induce the extended conformation of β2-integrins without any additional signaling requirements. This notion was based on two types of observations: enhancement of cell rolling and adhesion, and exposure of KIM127 mAb epitope mapped to the residues within the I-EGF-2 domain (a “genu”; Figure 2) of the β2 subunit (Salas et al., 2004, 2006). It is envisioned that the extension of the integrin genu leads to the epitope exposure (Beglova et al., 2002). This idea was also somewhat supported by EM of purified αXβ2-integrins, for which, in the presence of XVA-143, only ∼40% of clasped integrin constructs adopted an open conformation and 60% remained bent. The fact that the unclasped constructs show greater sensitivity to XVA-143 is not crucial since the unclasping by itself was sufficient to induce the extended conformation in ∼75% of cases (Figure 2, C and D, in Nishida et al., 2006).
In our experiments, if the addition of XVA-143 would have been sufficient to shift the dynamic state equilibrium and induce the extended LFA-1 state, we would expect to have detected a time-dependent unquenching of the fluorescent signal. We did in fact observe a slow increase in the donor fluorescence when the XVA-FITC probe was used (Figures 3A, 6A, and 7A). Previously this drift was attributed to the acceptor lipid flip-flop between the outer and inner leaflets, as well as acceptor internalization (Chigaev et al., 2003). In this report, the use of PKH26 dye with two C18 chains provided better signal stability. However, in the absence of the inside-out activation, the quenched XVA-FITC donor signal never reached the unquenched control, for which no lipid was acceptor added.
We also attempted to see whether the addition of the unlabeled allosteric antagonist to the cells labeled with the fluorescent probe based on the other antagonist resulted in a signal change that can be interpreted as molecular extension. No statistically significant change was detected (Figure 4, A and B). Thus no extension induced by XVA-143 was detected using a FRET-based approach.
Extension after cell activation
Activation of the inside-out signaling pathways using a combination of phorbol ester and thapsigargin induced rapid unquenching of donor fluorescence. This combination of drugs produces activation of the TALL-104 cell line, which is analogous to the TCR/CD3 T-cell–specific signaling pathway (Lyubchenko et al., 2001). The fact that donor fluorescence reaches the level of the unquenched positive control can be interpreted as an extension of the molecule, and the distance of the closest approach between the cell membrane and the probe binding site is severalfold larger than the Förster distance for the two fluorophores. Because the length of the LFA-1 extracellular domain is >200 Å (Figure 2), this interpretation appears to be realistic.
It is worth noting that for VLA-4 inside-out activation, the donor fluorescence never reached the level of the unquenched control, similar to LFA-1. At best, after activation, the signal increased up to 40–50% of the initial value. This was interpreted as if the change in distance of closest approach was close to R0 (Chigaev et al., 2003, 2007). An alternative interpretation is that only a small fraction of integrins on the cell surface, or only a fraction of cells, responded to the activating signal. Because acquisition rates in kinetics experiments can reach several hundreds of events per second, with averaging of the signal, it is impossible to distinguish between these possibilities (Chigaev et al., 2003, 2007).
The other important feature of integrin extension is the calcium dependence. Previously we found that treatment of cells with phorbol ester alone was insufficient to induce an extension of VLA-4, as detected using FRET. Addition of the Ca2+ ionophore resulted in the rapid unquenching of the donor fluorescence (Chigaev et al., 2007). We tested whether LFA-1 extension exhibited a similar feature. We found that unquenching of both LFA-1–specific probes was in fact dependent on the release Ca2+ from intracellular stores (Figure 7). The data were strikingly similar despite all the differences between the two studies: different cell lines, integrins, donor and acceptor probes, and Ca2+-elevating compounds were used (compare Figure 3C in Chigaev et al., 2007, and Figure 7 in the present article). Thus LFA-1 allosteric antagonist–based fluorescent probes can be used for real-time studies of integrin extension. This approach will provide invaluable information concerning conformational regulation of LFA-1 on live cells and help to answer a number of the key remaining questions that describe the structure–function relationships of LFA-1 (Askari et al., 2009).
Multiple states and integrin regulation
Current models of LFA-1 conformational regulation include multiple conformational states. In the classical model, three distinct conformations classified according to ligand binding affinity and extension have been described: low-affinity, bent; intermediate-affinity, extended; and high-affinity, extended states. Introduction of a lateral shear force or “opposing” force (or counter force from ICAM-1 binding) can modify LFA-1 conformation and creates various activation states (Hogg et al., 2011). In previous studies, for a different leukocyte integrin (VLA-4), we reported that TPA alone was capable of inducing the high-affinity conformation without molecular extension detected in a FRET-based assay (Chigaev et al., 2007). The data supported the existence of multiple conformational states independently regulated by both inside-out signaling and ligand binding (Chigaev et al., 2009). Data presented in the present report suggest that LFA-1 extension is regulated in a manner that is similar to VLA-4. The elevation of cytoplasmic calcium is essential for the molecular extension (compare Figure 3C in Chigaev et al., 2007, and Figure 7 in the present article). However, for LFA-1, which possesses an additional α I domain, conformational regulation is expected to be even more complex. We propose that this complexity, which originates from an evolutionary divergence among ancient and more modern leukocyte integrins, can be directly linked to different functional roles of LFA-1– and VLA-4–dependent adhesive interactions (Chigaev and Sklar, 2012a).
In addition, two probes based on LFA-1 allosteric antagonists showed somewhat different responses to phorbol TPA and TG treatment. TPA alone induces slight unquenching of XVA-FITC signal, and no significant signal change was detected for the case of BIRT377-FITC (Figure 7). This result can possibly indicate some degree of extension of LFA-1 after treatment with TPA. According to our model, the probe that initially located closer to the membrane and quenched at lower acceptor density would exhibit a higher sensitivity to small changes in the position of the integrin head group (Figure 8). Therefore XVA-FITC probe fluorescence will be more sensitive to the small changes in the distance of the closest approach (rc). Alternatively, allosteric antagonists bound to two different sites within the LFA-1 molecule can modify dynamic conformational equilibrium and favor different conformations of the receptor. Therefore, since BIRT 377 treatment has been reported to stabilize a certain specific LFA-1 conformation (Woska et al., 2001; Green et al., 2006), it is possible that LFA-1 extension in the presence of BIRT 377 is somewhat constrained.
MATERIALS AND METHODS
Cells
The human acute lymphoblastic leukemia cell line TALL-104 was purchased from the American Type Culture Collection (Rockville, MD; CRL-11386). Cells were grown at 37°C in a humidified atmosphere of 10% CO2 and 90% air in Iscove's modified Dulbecco's medium (supplemented with 100 U/ml recombinant human interleukin-2, 2 mM l-glutamine, 100 U/ml penicillin, 100 μg/ml streptomycin, 10 mM 4-(2-hydroxyethyl)-1-piperazineethanesulfonic acid, pH 7.4, and 20% heat-inactivated fetal bovine serum; Life Technologies, Carlsbad, CA). Cells were counted using the Coulter Multisizer/Z2 analyzer (Beckman Coulter, Brea, CA). For experiments, cells were suspended in Iscove's modified Dulbecco's medium at 1 × 10⁶ cells/ml at 37°C and used immediately. All other reagents were from Sigma-Aldrich (St. Louis, MO).
Probes for FRET
The LFA-1–specific ligands BIRT 377 (Woska et al., 2001), XVA-143 (Welzenbach et al., 2002) and fluorescent (fluorescein-conjugated) analogues BIRT-FITC and -FITC (Figure 1) were synthesized by Wei Wang at the Department of Chemistry and Chemical Biology, University of New Mexico. Fluorescent dye PKH26 (Figure 1) was purchased from Sigma-Aldrich (PKH26GL). Fluorescein analogues were used as FRET donors and PKH26 as acceptor. For experiments, stock solutions were prepared in DMSO at concentrations ∼1000-fold higher than the final concentration. Usually, 1 μl of stock solution was added to 1 ml of cell suspension, yielding a final 0.1% DMSO concentration. Control samples were treated with an equal amount of pure DMSO (vehicle).
The binding of BIRT-FITC was first studied in our laboratory in 2005 (Larson et al., 2005). The dissociation constant (Kd) and dissociation rate (koff) were ∼70–100 nM, and ∼0.04–0.1 s−1, respectively. This places the calculated association rate constant (kon) in the range ∼(0.4–1.4) × 106 M−1 s−1, which approaches the diffusion-limited rate for ligands of similar size (Chigaev et al., 2011b). Moreover, binding of the probe did not require cell activation, and ligand-binding affinity was essentially independent of cell activation (Larson et al., 2005).
XVA-143, also referenced as Roche compound #5, inhibited binding of β2-integrin to its ligands with an IC50 value of 60 ± 10 nM, blocked LFA-1–mediated cell adhesion to ICAM-1 with IC50 > 10 nM, and inhibited the LFA-1/ICAM-1–dependent mouse mixed leukocyte reaction with IC50 ≈ 20–40 nM (see Figure 2 in Shimaoka et al., 2003a). Our data (Supplemental Figure S2) suggest that the Kd for unlabeled XVA-143 binding is ∼80–90 nM, and the koff for the FITC-labeled XVA-FITC probe is ∼0.04 ± 0.003 s−1. Thus the ligand-binding affinity of XVA-143 is similar to the affinity of BIRT 377.
Fluorescence resonance energy transfer
General considerations.
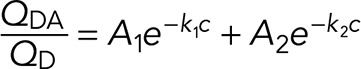
FRET is a distance-dependent interaction between the electronic excited states of two fluorophores in which excitation is transferred from an excited donor (D*) molecule to an acceptor (A) molecule without emission of a photon. The characteristic distance at which the donor fluorescence and FRET are equally probable is defined as R0, the Förster distance. On a surface, the efficiency of FRET is determined from the reduction in the emission quantum yield of the donor according to the following equation, where QD refers to the emission yield of the donor in the absence of acceptors, and QDA refers to the donor emission yield in the presence of acceptors expressed in terms of acceptors per unit area as acceptors/R02 (Wolber and Hudson, 1979):
 (1) (1)
|
Determination of the relative fluorescence quantum yield.
Conjugation (coupling) of fluorophores typically decreases the fluorescence quantum yield. To determine the relative quantum yield of the LFA-1–specific fluorescent probes, absorption- matched samples of carboxyfluorescein and the fluorescent LFA-1 probes (at 490 nm) were used to acquire emission spectra (Supplemental Figure S1). The relative quantum yield for XVA-FITC was determined as ∼0.70 and for BIRT-FITC was ∼0.30. These coefficients were used to calculate R0 values.
Estimation of the Förster distance.
R0 was calculated according to
|
|
where J is the donor–acceptor spectral overlap, QD is the quantum yield of the donor in the absence of acceptor, κ2 is the dipole–dipole orientation factor (usually taken as 2/3), and n is the refractive index (1.333) of the medium (Lakowicz, 2010). For randomized static orientations of donors and acceptors, κ2 = 0.476. In the case of LFA-1–specific probes immobilized by LFA-1 and PKH26 embedded in the cell membrane, a combination of dynamic and static factors is likely in place.
J is the overlap integral that expresses the degree of overlap between the donor emission and acceptor absorption,
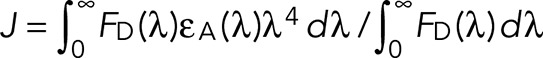 (3) (3)
|
FD(λ) is dimensionless intensity, representing a corrected emission spectrum of the donor normalized to unity at the band maximum, εA(λ) is an extinction coefficient expressed in units of M−1 cm−1, and λ is wavelength in centimeters. The overall units of J are cm3 M−1. The calculated value of J for the fluorescein–PKH26 pair is 2.8 × 10⁻¹³ cm3 M−1. This is slightly than reported for a fluorescein–rhodamine pair (Chigaev et al., 2003) due to the difference in acceptor absorption spectra. Calculated values of R0 for XVA-FITC, BIRT-FITC. and PKH26 pairs are given in Table 1. Thus, for our experiments, R0 is in the range 50–55 Å.
Energy transfer in two dimensions.
Energy transfer data were analyzed by expressions that describe energy transfer between random distributions of donors and acceptors on lipid membrane surfaces (Fung and Stryer, 1978; Wolber and Hudson, 1979; Dewey and Hammes, 1980; Doody et al., 1983). We used an approach (Wolber and Hudson, 1979) that involves the calculation of the distance of closest approach (rc) between randomly distributed donors and acceptors on an infinite plane and is described by a simple series approximation as
 (4) (4)
|
where c = acceptors/R02, acceptor density (ac/R02).
The values of A1, k1, A2, and k2 were taken from Table 1 in Wolber and Hudson (1979) and correspond to the exact solution to the series approximation for different values of rc expressed as a function of R0. It is important to note that the values of k2 for rc/R0 = 1.1 and 1.3 in the original reference (Wolber and Hudson, 1979) have been corrected from 0.4654 and 0.5633 to 0.04654 and 0.005633, respectively (see Table 15.2 in Lakowicz, 2010). This approach is valid for 0 < c < 0.5 and when the distance of closest approach is <1.3R0. Outside of this range, FRET is significantly overestimated. The curves generated using this approach were used to estimate the relative difference between the distance of closest approach (rc) between BIRT-FITC and XVA-FITC probes bound to LFA-1.
FRET experimental design.
Addition of the fluorescent cationic amphiphilic lipids used as FRET acceptors to live cells results in rapid partitioning of the molecules into the cell membrane, which can be monitored in real time using a flow cytometer (Chigaev et al., 2003; Buranda et al., 2010). This time-dependent increase in FRET acceptor density results in the quenching of membrane-associated FRET donors of different origin. For integrin ligands bound to the integrin head group, rapid conformational extension of the molecule results in donor unquenching that was interpreted as the change in the distance of closest approach (rc) between receptor-bound ligands and the cell membrane (Chigaev et al., 2003, 2007; Larson et al., 2005). Because of the inability of the LFA-1 receptor to bind a small ligand-mimicking fluorescent probe in the absence of integrin activation (Chigaev et al., 2011b; Chigaev and Sklar, 2012a), it was impossible to use it as a FRET donor as previously done for VLA-4 integrin (Chigaev and Sklar, 2012b). Therefore we created fluorescent probes based on LFA-1–specific allosteric antagonists that are known to bind to LFA-1 without activation (BIRT 377 and XVA-143).
Real-time FRET experiments were performed as described previously(Chigaev and Sklar, 2012b). Flow cytometric data were acquired continuously using a FACScan (Becton Dickinson) flow cytometer at constant temperature (37°C), and the samples were stirred continuously at 300 rpm with a 5 × 2 mm magnetic stir bar (Bel-Art Products). Cells suspended in Iscove's modified Dulbecco's medium at 1 × 10⁶ cells/ml were transferred into a FACScan tube, and samples were analyzed for 30–120 s to establish a baseline for unstained cells marked as “cell autofluorescence.” Next the fluorescent probes that served as FRET donors (BIRT- or XVA-FITC) were added, and acquisition was reestablished, creating a 5- to 10-s gap in the time course, which can be observed in the figures. A few minutes later, after donor probe equilibration, the FRET acceptor (PKH26) was added, and donor quenching was followed continuously up to 1024 s. For real-time signaling experiments, to elicit signaling responses, cells were treated with appropriate compounds (TPA, TG, and others). In several experiments, cells were treated sequentially with two or more compounds. Acquisition was reestablished, and data were acquired continuously up to 1024 s. Kinetic curves were analyzed using the FCSQuery software developed by Bruce S. Edwards (University of New Mexico).
Estimation of total LFA-1 (CD11a/LFA-1α) expression
The expression of CD11a was measured with primary labeled (phycoerythrin) fluorescent mAbs (mouse anti-human CD11a/LFA-1α, clone HI111 [PE] from BD Biosciences) and quantified by comparison with a standard curve generated using Quantum Simply Cellular anti-mouse immunoglobulin G beads (Bangs Laboratories) stained in parallel with the same mAb. This produces an estimate of the total mAb binding sites/cell. Typically, we find 1,000,000–1,200,000 LFA-1 sites/TALL-104 cell. This high CD11a expression justified our choice of the cell line and produced an excellent signal-to-background ratio. Because of the high expression of the CD11a subunit, our data primarily describe the CD11a/CD18 (LFA-1) integrin.
Statistical analysis
Curve fits and statistics were performed using Prism, version 4.00 for Windows (GraphPad Software, San Diego, CA). Each experiment was repeated at least three times. The experimental curves represent the mean of two or more independent runs. SEM was calculated using Prism.
LFA-1 model
The 3D structure of LFA-1 (αLβ2) integrin in the bent, closed conformation was obtained by assembling the x-ray structure of the β2 subunit with the homology model of the αL subunit built based on the x-ray structure of the αX subunit (Xie et al., 2010). The sequence of the human αL integrin was extracted from the Uniprot database (Boutet et al., 2007) in Fasta format and was automatically aligned using the T-coffee server (Poirot et al., 2003) with the sequence of the human αX integrin obtained from the RSCB Protein Data Bank (accession code 3K6S; Xie et al., 2010). The alignment of the amino acid sequences generated by the T-coffee server was manually refined using as a guide the 3D structure of the template in order to avoid deletions or insertions in the transmembrane domains and preserve the highly conserved amino acid motifs. When necessary, the deletions and insertions were merged into a single piece per loop and placed in the most adequate point in accordance with the template structure. The homology modeling package Modeller version 9v7 (Sali and Blundell, 1993; Eswar et al., 2007) was used to generate the 3D models for αL integrin based on the x-ray structure of human αX integrin using the sequence alignment. The extended conformation of LFA-1 was obtained by adjusting the torsion angles at the knees of α and β subunits, and the upper and lower legs were considered as two rigid systems. The resulting models were refined to reduce the steric clashes of the side chains without changing the receptor backbone using the Biopolymer module from the Sybyl software suite (Sybyl 7.3; Tripos International).
Confocal microscopy
TALL-104 cells suspended in complete Iscove's modified Dulbecco's medium at 1 × 10⁶ cells/ml were treated with appropriate compounds (TPA, TG) in a manner analogous to flow cytometry experiments described in FRET experimental design. Next cell aliquots were removed and immediately fixed in ice-cold 2% paraformaldehyde before cell activation and 3 and 6 min after the addition of TPA/TG mixture and stored at 4°C overnight. The next day, cells were washed with ice-cold PBS and stained with primary labeled (phycoerythrin) fluorescent mAbs (mouse anti-human CD11a/LFA-1α, clone HI111 [PE] from BD Biosciences, San Jose, CA) for 30–40 min on ice according to manufacturer's instructions. Samples were mounted using SlowFade Gold Antifade Mountant with 4′,6-diamidino-2-phenylindole (Life Technologies). Fluorescence microscopy was performed with a confocal microscope (Zeiss 510 Laser Scanning Microscope 510-META) using an oil immersion objective lens at the University of New Mexico Fluorescence Microscopy and Cell Imaging Shared Resource facility. Images were obtained and processed using ZEN 2009 image analysis software (Carl Zeiss MicroImaging).
Supplementary Material
Acknowledgments
This work was supported by National Institutes of Health Grants HL081062 and U54 MH074425-03S2 (to L.A.S.), Leukemia and Lymphoma Society Grant 7388-06 (to L.A.S.), and the Oxnard Foundation (to A.C.). Images were generated in the University of New Mexico and Cancer Center Fluorescence Microscopy Shared Resource, funded as detailed on hsc.unm.edu/crtc/microscopy/acknowledgement.shtml. Specifically, we thank Genevieve Phillips for help with image acquisition.
Abbreviations used:
- BIRT 377
(5R)-5-[(4-bromophenyl)methyl]-3-(3,5-dichlorophenyl)-1,5-dimethyl-2,4-imidazolidinedione
- DMSO
dimethyl sulfoxide
- FITC
fluorescein isothiocyanate
- FRET
fluorescence resonance energy transfer
- ICAM-1
intercellular adhesion molecule 1, CD54
- LFA-1
lymphocyte function–associated antigen-1, CD11a/CD18, αLβ2 integrin
- mAb
monoclonal antibody
- MOE
molecular operating environment
- PBS
phosphate-buffered saline
- PKC
protein kinase C
- PKH 26
1,1′-dioctadecyl-3,3,3′,3′-tetramethylindocarbocyanine perchlorate
- TCR
T-cell receptor
- TG
thapsigargin
- TPA
12-O-tetradecanoylphorbol-13-acetate
- VCAM-1
vascular cell adhesion molecule 1, CD106
- VLA-4
very late antigen 4, CD49d/CD29, α4β1 integrin
- XVA 143
(S)-2-[4-(3-hydroxybenzyl carbamoyl)-2,6-dichlorobenzoyl amino]-3-(3,5-dihydroxybenzoylamino) propionic acid.
Footnotes
This article was published online ahead of print in MBoC in Press (http://www.molbiolcell.org/cgi/doi/10.1091/mbc.E14-06-1050) on November 5, 2014.
REFERENCE
- Alon R, Feigelson SW. Chemokine signaling to lymphocyte integrins under shear flow. Microcirculation. 2009;16:3–16. doi: 10.1080/10739680802026076. [DOI] [PubMed] [Google Scholar]
- Alonso JL, Essafi M, Xiong JP, Stehle T, Arnaout MA. Does the integrin alphaA domain act as a ligand for its betaA domain. Curr Biol. 2002;12:R340–R342. doi: 10.1016/s0960-9822(02)00852-7. [DOI] [PubMed] [Google Scholar]
- Askari JA, Buckley PA, Mould AP, Humphries MJ. Linking integrin conformation to function. J Cell Sci. 2009;122:165–170. doi: 10.1242/jcs.018556. [DOI] [PMC free article] [PubMed] [Google Scholar]
- Beglova N, Blacklow SC, Takagi J, Springer TA. Cysteine-rich module structure reveals a fulcrum for integrin rearrangement upon activation. Nat Struct Biol. 2002;9:282–287. doi: 10.1038/nsb779. [DOI] [PubMed] [Google Scholar]
- Boutet E, Lieberherr D, Tognolli M, Schneider M, Bairoch A. UniProtKB/Swiss-Prot. Methods Mol Biol. 2007;406:89–112. doi: 10.1007/978-1-59745-535-0_4. [DOI] [PubMed] [Google Scholar]
- Buranda T, Wu Y, Perez D, Chigaev A, Sklar LA. Real-time partitioning of octadecyl rhodamine B into bead-supported lipid bilayer membranes revealing quantitative differences in saturable binding sites in DOPC and 1:1:1 DOPC/SM/cholesterol membranes. J Phys Chem B. 2010;114:1336–1349. doi: 10.1021/jp906648q. [DOI] [PMC free article] [PubMed] [Google Scholar]
- Byron A, Humphries JD, Askari JA, Craig SE, Mould AP, Humphries MJ. Anti-integrin monoclonal antibodies. J Cell Sci. 2009;122:4009–4011. doi: 10.1242/jcs.056770. [DOI] [PMC free article] [PubMed] [Google Scholar]
- Campbell ID, Humphries MJ. Integrin structure, activation, and interactions. Cold Spring Harb Perspect Biol. 2011;3 doi: 10.1101/cshperspect.a004994. a004994. [DOI] [PMC free article] [PubMed] [Google Scholar]
- Chigaev A, Blenc AM, Braaten JV, Kumaraswamy N, Kepley CL, Andrews RP, Oliver JM, Edwards BS, Prossnitz ER, Larson RS, Sklar LA. Real time analysis of the affinity regulation of alpha 4-integrin. The physiologically activated receptor is intermediate in affinity between resting and Mn(2+) or antibody activation. J Biol Chem. 2001;276:48670–48678. doi: 10.1074/jbc.M103194200. [DOI] [PubMed] [Google Scholar]
- Chigaev A, Buranda T, Dwyer DC, Prossnitz ER, Sklar LA. FRET detection of cellular alpha4-integrin conformational activation. Biophys J. 2003;85:3951–3962. doi: 10.1016/S0006-3495(03)74809-7. [DOI] [PMC free article] [PubMed] [Google Scholar]
- Chigaev A, Sklar LA. Aspects of VLA-4 and LFA-1 regulation that may contribute to rolling and firm adhesion. Front Immunol. 2012a;3:242. doi: 10.3389/fimmu.2012.00242. [DOI] [PMC free article] [PubMed] [Google Scholar]
- Chigaev A, Sklar LA. Overview: assays for studying integrin-dependent cell adhesion. Methods Mol Biol. 2012b;757:3–14. doi: 10.1007/978-1-61779-166-6_1. [DOI] [PMC free article] [PubMed] [Google Scholar]
- Chigaev A, Smagley Y, Sklar LA. Nitric oxide/cGMP pathway signaling actively down-regulates alpha4beta1-integrin affinity: an unexpected mechanism for inducing cell de-adhesion. BMC Immunol. 2011a;12:28. doi: 10.1186/1471-2172-12-28. [DOI] [PMC free article] [PubMed] [Google Scholar]
- Chigaev A, Smagley Y, Zhang Y, Waller A, Haynes MK, Amit O, Wang W, Larson RS, Sklar LA. Real-time analysis of the inside-out regulation of lymphocyte function-associated antigen-1 revealed similarities to and differences from very late antigen-4. J Biol Chem. 2011b;286:20375–20386. doi: 10.1074/jbc.M110.206185. [DOI] [PMC free article] [PubMed] [Google Scholar]
- Chigaev A, Waller A, Amit O, Halip L, Bologa CG, Sklar LA. Real-time analysis of conformation-sensitive antibody binding provides new insights into integrin conformational regulation. J Biol Chem. 2009;284:14337–14346. doi: 10.1074/jbc.M901178200. [DOI] [PMC free article] [PubMed] [Google Scholar]
- Chigaev A, Waller A, Amit O, Sklar LA. Galphas-coupled receptor signaling actively down-regulates alpha4beta1-integrin affinity: a possible mechanism for cell de-adhesion. BMC Immunol. 2008;9:26. doi: 10.1186/1471-2172-9-26. [DOI] [PMC free article] [PubMed] [Google Scholar]
- Chigaev A, Waller A, Zwartz GJ, Buranda T, Sklar LA. Regulation of cell adhesion by affinity and conformational unbending of alpha4beta1 integrin. J Immunol. 2007;178:6828–6839. doi: 10.4049/jimmunol.178.11.6828. [DOI] [PubMed] [Google Scholar]
- Dewey TG, Hammes GG. Calculation on fluorescence resonance energy transfer on surfaces. Biophys J. 1980;32:1023–1035. doi: 10.1016/S0006-3495(80)85033-8. [DOI] [PMC free article] [PubMed] [Google Scholar]
- Doody MC, Sklar LA, Pownall HJ, Sparrow JT, Gotto AM, Jr., Smith LC. A simplified approach to resonance energy transfer in membranes, lipoproteins and spatially restricted systems. Biophys Chem. 1983;17:139–152. doi: 10.1016/0301-4622(83)80008-8. [DOI] [PubMed] [Google Scholar]
- Eswar N, Webb B, Marti-Renom MA, Madhusudhan MS, Eramian D, Shen MY, Pieper U, Sali A. Comparative protein structure modeling using MODELLER. Curr Protoc Protein Sci. 2007 doi: 10.1002/0471140864.ps0209s50. Chapter 2, Unit 2.9. [DOI] [PubMed] [Google Scholar]
- Fung BK, Stryer L. Surface density determination in membranes by fluorescence energy transfer. Biochemistry. 1978;17:5241–5248. doi: 10.1021/bi00617a025. [DOI] [PubMed] [Google Scholar]
- Green CE, Schaff UY, Sarantos MR, Lum AF, Staunton DE, Simon SI. Dynamic shifts in LFA-1 affinity regulate neutrophil rolling, arrest, and transmigration on inflamed endothelium. Blood. 2006;107:2101–2111. doi: 10.1182/blood-2005-06-2303. [DOI] [PMC free article] [PubMed] [Google Scholar]
- Hogg N, Patzak I, Willenbrock F. The insider's guide to leukocyte integrin signalling and function. Nat Rev Immunol. 2011;11:416–426. doi: 10.1038/nri2986. [DOI] [PubMed] [Google Scholar]
- Hyun YM, Lefort CT, Kim M. Leukocyte integrins and their ligand interactions. Immunol Res. 2009;45:195–208. doi: 10.1007/s12026-009-8101-1. [DOI] [PMC free article] [PubMed] [Google Scholar]
- Lakowicz JR. Principles of Fluorescence Spectroscopy. New York: Springer; 2010. [Google Scholar]
- Larson RS, Davis T, Bologa C, Semenuk G, Vijayan S, Li Y, Oprea T, Chigaev A, Buranda T, Wagner CR, Sklar LA. Dissociation of I domain and global conformational changes in LFA-1: refinement of small molecule-I domain structure-activity relationships. Biochemistry. 2005;44:4322–4331. doi: 10.1021/bi048187k. [DOI] [PubMed] [Google Scholar]
- Laudanna C, Alon R. Right on the spot. Chemokine triggering of integrin-mediated arrest of rolling leukocytes. Thromb Haemost. 2006;95:5–11. [PubMed] [Google Scholar]
- Laudanna C, Kim JY, Constantin G, Butcher E. Rapid leukocyte integrin activation by chemokines. Immunol Rev. 2002;186:37–46. doi: 10.1034/j.1600-065x.2002.18604.x. [DOI] [PubMed] [Google Scholar]
- Lefort CT, Ley K. Neutrophil arrest by LFA-1 activation. Front Immunol. 2012;3:157. doi: 10.3389/fimmu.2012.00157. [DOI] [PMC free article] [PubMed] [Google Scholar]
- Ley K, Laudanna C, Cybulsky MI, Nourshargh S. Getting to the site of inflammation: the leukocyte adhesion cascade updated. Nat Rev Immunol. 2007;7:678–689. doi: 10.1038/nri2156. [DOI] [PubMed] [Google Scholar]
- Lyubchenko TA, Wurth GA, Zweifach A. Role of calcium influx in cytotoxic T lymphocyte lytic granule exocytosis during target cell killing. Immunity. 2001;15:847–859. doi: 10.1016/s1074-7613(01)00233-3. [DOI] [PubMed] [Google Scholar]
- Nishida N, Xie C, Shimaoka M, Cheng Y, Walz T, Springer TA. Activation of leukocyte beta2 integrins by conversion from bent to extended conformations. Immunity. 2006;25:583–594. doi: 10.1016/j.immuni.2006.07.016. [DOI] [PubMed] [Google Scholar]
- O'Toole TE, Katagiri Y, Faull RJ, Peter K, Tamura R, Quaranta V, Loftus JC, Shattil SJ, Ginsberg MH. Integrin cytoplasmic domains mediate inside-out signal transduction. J Cell Biol. 1994;124:1047–1059. doi: 10.1083/jcb.124.6.1047. [DOI] [PMC free article] [PubMed] [Google Scholar]
- Phongpradist R, Chittasupho C, Okonogi S, Siahaan T, Anuchapreeda S, Ampasavate C, Berkland C. LFA-1 on leukemic cells as a target for therapy or drug delivery. Curr Pharm Des. 2010;16:2321–2330. doi: 10.2174/138161210791920450. [DOI] [PMC free article] [PubMed] [Google Scholar]
- Poirot O, O'Toole E, Notredame C. Tcoffee@igs: a web server for computing, evaluating and combining multiple sequence alignments. Nucleic Acids Res. 2003;31:3503–3506. doi: 10.1093/nar/gkg522. [DOI] [PMC free article] [PubMed] [Google Scholar]
- Salas A, Shimaoka M, Kogan AN, Harwood C, von Andrian UH, Springer TA. Rolling adhesion through an extended conformation of integrin alphaLbeta2 and relation to alpha I and beta I-like domain interaction. Immunity. 2004;20:393–406. doi: 10.1016/s1074-7613(04)00082-2. [DOI] [PubMed] [Google Scholar]
- Salas A, Shimaoka M, Phan U, Kim M, Springer TA. Transition from rolling to firm adhesion can be mimicked by extension of integrin alphaLbeta2 in an intermediate affinity state. J Biol Chem. 2006;281:10876–10882. doi: 10.1074/jbc.M512472200. [DOI] [PMC free article] [PubMed] [Google Scholar]
- Sali A, Blundell TL. Comparative protein modelling by satisfaction of spatial restraints. J Mol Biol. 1993;234:779–815. doi: 10.1006/jmbi.1993.1626. [DOI] [PubMed] [Google Scholar]
- Schmidmaier R, Baumann P. ANTI-ADHESION evolves to a promising therapeutic concept in oncology. Curr Med Chem. 2008;15:978–990. doi: 10.2174/092986708784049667. [DOI] [PubMed] [Google Scholar]
- Shimaoka M, Salas A, Yang W, Weitz-Schmidt G, Springer TA. Small molecule integrin antagonists that bind to the beta2 subunit I-like domain and activate signals in one direction and block them in the other. Immunity. 2003a;19:391–402. doi: 10.1016/s1074-7613(03)00238-3. [DOI] [PubMed] [Google Scholar]
- Shimaoka M, Springer TA. Therapeutic antagonists and conformational regulation of integrin function. Nat Rev Drug Discov. 2003;2:703–716. doi: 10.1038/nrd1174. [DOI] [PubMed] [Google Scholar]
- Shimaoka M, Springer TA. Therapeutic antagonists and the conformational regulation of the beta2 integrins. Curr Top Med Chem. 2004;4:1485–1495. doi: 10.2174/1568026043387575. [DOI] [PubMed] [Google Scholar]
- Shimaoka M, Xiao T, Liu JH, Yang Y, Dong Y, Jun CD, McCormack A, Zhang R, Joachimiak A, Takagi J, et al. Structures of the alpha L I domain and its complex with ICAM-1 reveal a shape-shifting pathway for integrin regulation. Cell. 2003b;112:99–111. doi: 10.1016/s0092-8674(02)01257-6. [DOI] [PMC free article] [PubMed] [Google Scholar]
- Takagi J, Petre BM, Walz T, Springer TA. Global conformational rearrangements in integrin extracellular domains in outside-in and inside-out signaling. Cell. 2002;110:599–11. doi: 10.1016/s0092-8674(02)00935-2. [DOI] [PubMed] [Google Scholar]
- Welzenbach K, Hommel U, Weitz-Schmidt G. Small molecule inhibitors induce conformational changes in the I domain and the I-like domain of lymphocyte function-associated antigen-1. Molecular insights into integrin inhibition. J Biol Chem. 2002;277:10590–10598. doi: 10.1074/jbc.M110521200. [DOI] [PubMed] [Google Scholar]
- Wolber PK, Hudson BS. An analytic solution to the Forster energy transfer problem in two dimensions. Biophys J. 1979;28:197–210. doi: 10.1016/S0006-3495(79)85171-1. [DOI] [PMC free article] [PubMed] [Google Scholar]
- Woska JR, Jr, Shih D, Taqueti VR, Hogg N, Kelly TA, Kishimoto TK. A small-molecule antagonist of LFA-1 blocks a conformational change important for LFA-1 function. J Leukoc Biol. 2001;70:329–334. [PubMed] [Google Scholar]
- Xie C, Zhu J, Chen X, Mi L, Nishida N, Springer TA. Structure of an integrin with an alphaI domain, complement receptor type 4. EMBO J. 2010;29:666–679. doi: 10.1038/emboj.2009.367. [DOI] [PMC free article] [PubMed] [Google Scholar]
- Xiong JP, Stehle T, Diefenbach B, Zhang R, Dunker R, Scott DL, Joachimiak A, Goodman SL, Arnaout MA. Crystal structure of the extracellular segment of integrin alpha Vbeta3. Science. 2001;294:339–345. doi: 10.1126/science.1064535. [DOI] [PMC free article] [PubMed] [Google Scholar]
- Yusuf-Makagiansar H, Anderson ME, Yakovleva TV, Murray JS, Siahaan TJ. Inhibition of LFA-1/ICAM-1 and VLA-4/VCAM-1 as a therapeutic approach to inflammation and autoimmune diseases. Med Res Rev. 2002;22:146–167. doi: 10.1002/med.10001. [DOI] [PubMed] [Google Scholar]
- Zarbock A, Ley K. Neutrophil adhesion and activation under flow. Microcirculation. 2009;16:31–42. doi: 10.1080/10739680802350104. [DOI] [PMC free article] [PubMed] [Google Scholar]
Associated Data
This section collects any data citations, data availability statements, or supplementary materials included in this article.