

Abstract
Purpose
Physical inactivity has been associated with higher mortality risk among survivors of colorectal cancer (CRC), but the independent effects of pre- versus postdiagnosis activity are unclear, and the association between watching television (TV) and mortality in survivors of CRC is previously undefined.
Methods
We analyzed the associations between prediagnosis (n = 3,797) and postdiagnosis (n = 1,759) leisure time physical activity (LTPA) and TV watching and overall and disease-specific mortality among patients with CRC. We used Cox proportional hazards regression to estimate hazard ratios (HRs) and 95% CIs, adjusting for known mortality risk factors.
Results
Comparing survivors of CRC reporting more than 7 hours per week (h/wk) of prediagnosis LTPA with those reporting no LTPA, we found a 20% lower risk of all-cause mortality (HR, 0.80; 95% CI, 0.68 to 0.95; P for trend = .021). Postdiagnosis LTPA of ≥ 7 h/wk, compared with none, was associated with a 31% lower all-cause mortality risk (HR, 0.69; 95% CI, 0.49 to 0.98; P for trend = .006), independent of prediagnosis activity. Compared with 0 to 2 TV hours per day (h/d) before diagnosis, those reporting ≥ 5 h/d of TV before diagnosis had a 22% increased all-cause mortality risk (HR, 1.22; 95% CI, 1.06 to 1.41; P trend = .002), and more postdiagnosis TV watching was associated with a nonsignificant 25% increase in all-cause mortality risk (HR, 1.25; 95% CI, 0.93 to 1.67; P for trend = .126).
Conclusion
LTPA was inversely associated with all-cause mortality, whereas more TV watching was associated with increased mortality risk. For both LTPA and TV watching, postdiagnosis measures independently explained the association with mortality. Clinicians should promote both minimizing TV time and increasing physical activity for longevity among survivors of CRC, regardless of previous behaviors.
INTRODUCTION
Colorectal cancer (CRC) is the third most commonly diagnosed cancer and the third leading cause of cancer death in the United States.1 With improvements in early detection and treatment, 5-year survival rates have reached 90% for localized and 69% for regional tumors, leading to an estimated one million colon cancer survivors in the United States.2 Despite known health benefits of achieving recommended physical activity levels,3,4 many survivors of CRC do not meet physical activity guidelines.5,6 Television (TV) viewing, the most prevalent leisure-time sedentary behavior, has also been associated with poorer survival in the general population.7 More than 55% of survivors of CRC report watching ≥ 3 hours per day (h/d) of TV,8 but whether TV viewing is associated with mortality among survivors of CRC is unknown.
Pooled estimates from a recent meta-analysis among survivors of CRC showed inverse associations between both pre- and postdiagnosis leisure time physical activity (LTPA) and mortality based on seven prospective cohorts.9 Three of the studies included in the meta-analysis9 measured LTPA before diagnosis and found a 23% to 28% reduced all-cause mortality risk comparing higher to lower activity levels,10–12 whereas another study showed no association.13 Studies of LTPA measured after CRC diagnosis (median, 1 to 2.7 years after diagnosis) have shown a 25% to 60% lower risk of all-cause and disease-specific deaths among more active individuals.10,12–17
Despite this emerging evidence, there are gaps in understanding how LTPA relates to survival, including differences in health benefits at various points along the cancer experience.18 Previous studies have not measured these exposures more than 3 years after diagnosis when survivors are moving beyond treatment and recovery. Survivors of cancer and clinicians want to know how they can enhance survival and reduce risk of recurrence and thus whether behavioral choices (eg, LTPA or sitting and watching TV) after the diagnosis and treatment phases may provide benefit. Although prolonged TV watching has been associated with higher risk of mortality in healthy adults, the only previous study on leisure time sedentary behavior and survival in patients with CRC reported an approximate 30% increased mortality risk with ≥ 6 h/d of sedentary time.10 Confirming this finding could add a behavioral approach (reducing TV time) that would complement the message for survivors of CRC to participate regularly in LTPA. Also, we are unaware of previous studies that have reported on joint effects of LTPA and sedentary time on mortality risk. In the this study, we investigated moderate- to vigorous-intensity LTPA and TV viewing time in relation to total and cause-specific mortality among survivors of CRC, with particular interest in distinguishing the contributions of pre- and postdiagnosis measures.
METHODS
Study Population
The National Institutes of Health (NIH)–AARP Diet and Health Study has been previously described. Briefly, the NIH-AARP cohort included 566,398 AARP members (age 50 to 71 years) who completed a mailed baseline questionnaire in 1995 to 1996. Participants resided in one of six US states or two metropolitan areas. In 1996 to 1997, an additional risk factor questionnaire including more questions about physical activity was mailed to participants without self-reported colon, breast, or prostate cancers at baseline (response rate, 67%).
Patients with cancer were identified by linking cohort members to eight original state cancer registries and three additional state registries through December 31, 2006. Cancer registries provided information on cancer diagnosis date, histology, stage, grade, and first course of treatment reported within 1 year of diagnosis. We classified patients with invasive CRC using histology codes from the International Classification of Diseases (ICD) for Oncology, Third Edition (codes C180 to 189, C199, and C209).19 Incident cancer identification was estimated to be 90% complete.20 Of the 300,352 men and women considered at risk for CRC, we observed 4,685 patients with CRC.
After excluding individuals diagnosed with stage 0 (in situ; n = 339) or metastatic disease (n = 450) and those who were diagnosed with cancer or died before exposure assessment (n = 99), 3,797 patients (1,541 deaths) remained in the analysis. Individuals missing TV data (n = 13) were excluded from TV analyses, leaving 3,784 patients. In 2004 to 2005, a follow-up questionnaire was mailed to baseline participants. Of those included in the prediagnosis analysis, 1,759 individuals had postdiagnosis physical activity data (412 deaths), and 1,630 individuals had postdiagnosis TV viewing data. Key characteristics of the subcohort that had only prediagnosis information compared with the subcohort that had both pre- and postdiagnosis information are listed in the Data Supplemental. The NIH-AARP Diet and Health Study was approved by the Special Studies Institutional Review Board of the US National Cancer Institute.
Mortality Ascertainment
Vital status was ascertained annually by linkage to the Social Security Administration Death Master File and the National Death Index Plus through December 31, 2011. We used ICD-9 and ICD-10 codes to classify deaths caused by cardiovascular disease (CVD; IDC-9 codes 390 to 398, 401 to 404, 410 to 438, 440 to 448; and ICD-10 codes I00 to I13, I20 to I51, I60 to I69, and I70 to I78), colon cancer (ICD-9 codes 153 and 159.0, and ICD-10 codes C18 to C26.0), and rectal cancer (ICD-9 codes 154.0 and 154.1, and ICD-10 codes C19 to C20).
Exposure Assessment
The timing of data collection and analytic follow-up time are presented in Figure 1. The risk factor questionnaire assessed moderate- to vigorous-intensity activities performed in the 10 years prior. LTPA examples included tennis, golf, biking, swimming, heavy gardening, fast walking/dancing, and aerobics/jogging. This questionnaire was not validated directly but has demonstrated expected inverse associations with colon, rectal, and endometrial cancer risk in this cohort.21,22 Participants reported LTPA hours per week using categories of never, rarely, less than 1, 1 to 3, 4 to 7, and more than 7 h/wk. Participants also reported hours per day spent sitting watching TV or videos in the prior year, choosing from response categories of none, less than 1, 1 to 2, 3 to 4, 5 to 6, 7 to 8, and ≥ 9 h/d. TV viewing was grouped as 0 to 2, 3 to 4, and ≥ 5 h/d for analysis.
Fig 1.
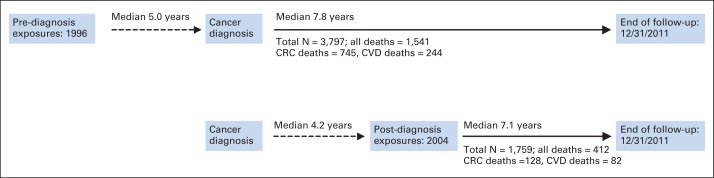
Timeline of data collection and analytic follow-up. Dashed line indicates lag time, whereas solid line indicates the follow-up time calculated in models. Thus, for prediagnosis analyses, follow-up started at age at colorectal cancer (CRC) diagnosis and ended at age at death or end of follow-up at December 31, 2011, whichever occurred first. In postdiagnosis models, follow-up time started at age at postdiagnosis questionnaire and ended at age at death or censoring. CVD, cardiovascular disease.
The follow-up questionnaire had separate line items for walking for exercise, jogging/running, tennis/squash/racquetball, golf, swimming laps, bicycling, other aerobic exercise, and weight training/lifting. Participants estimated average weekly time (none, 5 minutes, 15 minutes, 30 minutes, 1 hour, 1.5 hours, 2 to 3 hours, 4 to 6 hours, 7 to 10 hours, or > 10 hours) spent performing each activity over the prior 12 months. A nearly identical LTPA questionnaire has been previously validated with physical activity diaries.23,24 We summed these individual line items and categorized postdiagnosis LTPA to reflect the less detailed categories from the prediagnosis questionnaire as follows: 0 (referent), less than 1, 1 to less than 4, 4 to less than 7, and ≥ 7 h/wk. Postdiagnosis TV viewing was reported as typical hours per day in the prior year spent sitting watching TV, videos, or DVDs using categories of none, less than 3, 3 to 4, 5 to 6, 7 to 8, 9 to 10, 11 to 12, or > 12 h/d. TV viewing hours were assigned the midpoint of the queried categories and then categorized as 0 to 2, more than 2 to 4, and more than 4 h/d to mimic prediagnosis categories.
Statistical Analysis
We used IVEware 2.0 (http://iveware.org) to impute values for missing variables, using 10 iterations and five imputations. Hazard ratios (HRs) and 95% CIs were estimated using Cox proportional hazards models with age as the underlying time metric. PROC MIANALYZE (SAS Institute, Cary, NC) was used to combine results from the five imputed datasets. Trend tests were performed by coding LTPA and TV categories as ordinal and treating the variable as linear.
We examined all factors in Table 1 as potential confounders and, in regression models, included covariates associated with the main exposures and mortality in previous analyses. Final models included adjustment for sex, cancer site (colon or rectum), tumor grade, tumor stage, surgery, radiation therapy, chemotherapy, body mass index (BMI) at baseline, smoking status at baseline, self-reported health (baseline for prediagnosis models and follow-up questionnaire for postdiagnosis models), and TV watching or LTPA, as appropriate. We also created postdiagnosis models adjusted for prediagnosis exposures to explore questions about independent effects of exposure timing. Because BMI and health status may be in the causal pathway, modeled estimates in tables are shown with and without adjustment for these covariates. In addition, we created joint effects models by dichotomizing LTPA and TV into the following four groups: low LTPA (< 1 h/wk)/high TV (> 2 h/d) (referent), low LTPA/low TV (0 to 2 h/d), high LTPA (≥ 1 h/wk)/high TV, and high LTPA/low TV.
Table 1.
Baseline Characteristics of Patients With Colorectal Cancer in the NIH-AARP Diet and Health Study Population by Moderate- to Vigorous-Intensity LTPA Reported Before Diagnosis
| Characteristic | Prediagnosis LTPA (N = 3,797) |
||||
|---|---|---|---|---|---|
| Never/Rare | < 1 h/wk | 1-3 h/wk | 4-7 h/wk | > 7 h/wk | |
| Colorectal cancer diagnosis site | |||||
| Colon, No. | 479 | 318 | 719 | 655 | 609 |
| Deaths, No. | 230 | 122 | 307 | 258 | 213 |
| Rectum, No. | 140 | 100 | 275 | 241 | 261 |
| Deaths, No. | 65 | 46 | 111 | 96 | 113 |
| Mean age at LTPA assessment, years | 64.3 | 64.4 | 64.4 | 64.7 | 64.9 |
| Mean age at cancer diagnosis, years | 68.9 | 69.2 | 69.0 | 69.3 | 69.5 |
| Sex, % women | 32.0 | 34.0 | 34.1 | 34.4 | 34.0 |
| Body mass index, kg/m2 | 29.2 | 28.2 | 27.4 | 26.8 | 26.4 |
| Education, % | |||||
| < High school/high school graduate | 32.6 | 28.0 | 22.1 | 24.1 | 27.0 |
| > High school/some college | 31.5 | 33.0 | 39.0 | 33.0 | 35.6 |
| College or graduate degree | 33.0 | 35.7 | 37.2 | 40.0 | 35.4 |
| Race/ethnicity, % | |||||
| Non-Hispanic white | 89.7 | 91.6 | 94.0 | 94.8 | 94.5 |
| African American | 5.2 | 3.1 | 3.1 | 1.9 | 1.7 |
| Other | 3.6 | 2.6 | 2.0 | 2.7 | 2.8 |
| Self-reported diabetes, % | 17.8 | 13.6 | 11.5 | 10.2 | 7.5 |
| Self-reported health, % | |||||
| Excellent/very good | 33.6 | 41.6 | 49.5 | 59.4 | 61.5 |
| Good | 41.2 | 40.7 | 39.4 | 31.5 | 29.4 |
| Fair | 19.2 | 16.0 | 8.9 | 7.3 | 6.4 |
| Poor | 4.7 | 0.7 | 0.9 | 0.5 | 0.6 |
| Smoke, % | |||||
| Never | 26.8 | 27.5 | 30.5 | 32.3 | 32.0 |
| Former | 52.2 | 55.5 | 55.0 | 56.1 | 56.3 |
| Current | 16.6 | 13.9 | 11.0 | 8.5 | 8.2 |
| Hours spent watching TV daily, % | |||||
| 0-2 | 14.5 | 16.3 | 16.7 | 19.2 | 25.9 |
| 3-4 | 25.4 | 28.2 | 29.4 | 32.1 | 32.0 |
| ≥ 5 | 25.5 | 29.0 | 30.0 | 28.7 | 27.9 |
| Red meat intake, MPED, oz/d | 2.4 | 2.5 | 2.4 | 2.0 | 2.1 |
| Alcohol intake, g/d | 17.2 | 18.0 | 15.4 | 16.6 | 17.1 |
| Tumor summary stage, % | |||||
| Localized | 33.4 | 30.9 | 28.9 | 31.4 | 33.2 |
| Regional | 32.5 | 29.2 | 32.8 | 30.7 | 29.0 |
| Unknown | 34.1 | 40.0 | 38.3 | 38.0 | 37.8 |
| Tumor grade at diagnosis, % | |||||
| Well differentiated | 12.6 | 11.2 | 11.0 | 12.7 | 11.4 |
| Moderately differentiated | 55.4 | 59.1 | 61.6 | 57.4 | 59.1 |
| Poorly differentiated | 16.0 | 12.9 | 13.3 | 13.5 | 14.7 |
| Undifferentiated | 0.3 | 0.7 | 0.4 | 1.2 | 0.6 |
| Unknown | 15.7 | 16.0 | 13.8 | 15.2 | 14.3 |
| First course of cancer treatment, % | |||||
| Surgery | 83.2 | 82.3 | 80.7 | 83.5 | 84.0 |
| Chemotherapy | 23.8 | 25.1 | 26.9 | 27.8 | 26.8 |
| Radiation | 6.6 | 8.1 | 8.1 | 8.9 | 10.0 |
Abbreviations: LTPA, leisure time physical activity; MPED, My Pyramid Equivalent Database; NIH, National Institutes of Health; TV, television.
In sensitivity analyses, we performed analyses excluding those who died within a year of answering pre- and postdiagnosis questionnaires. To assess reverse causation, we also excluded individuals who answered the questionnaire within a year of diagnosis. We also stratified analyses by sex; median diagnosis age; cancer site (colon or rectum), stage, grade, and first course of treatment; health status; smoking status; median BMI; and median lag time between questionnaires and diagnosis. We created interaction terms for these covariates with the exposure of interest and tested for statistical significance using the Wald test. We tested the proportional hazards assumption by including an interaction term between person-time and the continuous exposure of interest in the models and assessed its significance using the Wald test. The proportional hazards assumption was met (all P interaction > .10). Statistical analyses were performed using SAS 9.3 (SAS Institute), and Figures 2 and 3 were produced using GraphPad Prism 6 (GraphPad Software, San Diego, CA).
Fig 2.

Joint effects of (A) prediagnosis and (B) postdiagnosis leisure time physical activity (LTPA) and television (TV) viewing and mortality among individuals diagnosed with colorectal cancer. Low LTPA was categorized as < 1 h/wk of moderate- to vigorous-intensity physical activity, and high LTPA was categorized as ≥ 1 h/wk. Low TV was categorized as 0 to 2 h/d of TV watching, and high TV was categorized as ≥ 3 h/d. Models used age as the underlying time metric and adjusted for sex (male, female), cancer site (colon, rectum), tumor grade, tumor stage (local, regional), surgery (yes, no), radiation (yes, no), chemotherapy (yes, no), body mass index (continuous), self-reported health (excellent/very good, good, fair, poor), and smoking status (never, former, current).
Fig 3.
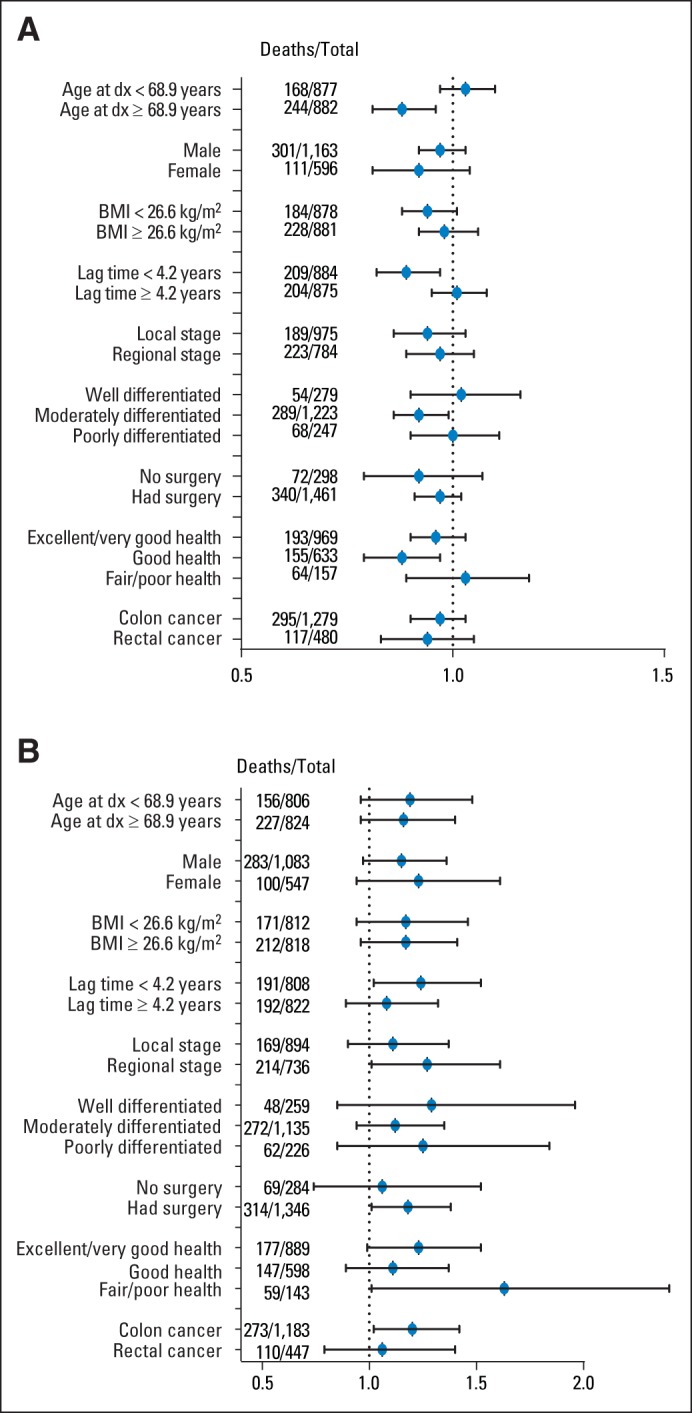
(A) All-cause mortality hazard ratios per 2.5-hour increase per week in postdiagnosis leisure time physical activity (LTPA). (B) All-cause mortality hazard ratios per 3.5-hour increase in postdiagnosis television (TV) viewing. Models were stratified by median value or category. Models were adjusted for sex (male, female), tumor site (colon, rectum), tumor grade, tumor stage (local, regional, unknown), surgery (yes, no), radiation (yes, no), chemotherapy (yes, no), body mass index (continuous), time reported watching TV (for panel A; 0 to 2, > 2 to 4, > 4 h/d) or time reported in physical activity (for panel B; 0, < 1, 1 to < 4, 4 to < 7, ≥ 7 h/wk), self-reported health (excellent/very good, good, fair, poor), and smoking status (never, former, current). Lag time was defined as the time from cancer diagnosis to follow-up questionnaire. LTPA and TV were treated as continuous and scaled by the median (2.5 h/wk and 3.5 h/d, respectively). BMI, body mass index; dx, diagnosis.
RESULTS
The median time from the prediagnosis questionnaire to cancer diagnosis was 5.0 years, whereas the median time from diagnosis to the follow-up questionnaire was 4.2 years (Fig 1). Among those reporting more prediagnosis LTPA, we observed a lower BMI, less reported diabetes, less TV viewing, more non-Hispanic white individuals, better self-reported health, and more never-smokers (Table 1). There were no differences in tumor stage, grade, or first course of treatment by LTPA level. Comparing those who were only in the prediagnosis analysis with those who were in both the pre- and postdiagnosis analyses, we found that individuals included in both analyses were slightly younger at diagnosis, were more educated, reported better health status, and were more likely to be never-smokers and have localized disease stage (Data Supplement).
Physical Activity
When we compared survivors of CRC reporting more than 7 h/wk of prediagnosis LTPA with those reporting no LTPA, we found a 20% lower all-cause mortality risk (HR, 0.80; 95% CI, 0.68 to 0.95; P for trend = .02; Table 2). Comparing survivors of CRC reporting more than 7 h/wk of LTPA with those reporting never/rare LTPA, we observed inverse, but not statistically significant, protective associations for CRC mortality (HR, 0.84; 95% CI, 0.66 to 1.07; P for trend = .28) and CVD mortality (HR, 0.78; 95% CI, 0.52 to 1.15; P for trend = .24) after fully adjusting models for BMI and health status.
Table 2.
HRs for Prediagnosis and Postdiagnosis LTPA and Mortality Among Individuals Diagnosed With Colorectal Cancer in the NIH-AARP Study
| Mortality | Prediagnosis LTPA (n = 3,797) |
Postdiagnosis LTPA (n = 1,759) |
||||||||||||||||||
|---|---|---|---|---|---|---|---|---|---|---|---|---|---|---|---|---|---|---|---|---|
| Never/Rarely HR | < 1 h/wk |
1-3 h/wk |
4-7 h/wk |
> 7 h/wk |
P (trend) | 0 h/wkHR | 0 to < 1 h/wk |
1 to < 4 h/wk |
4 to < 7 h/wk |
≥ 7 h/wk |
P (trend) | |||||||||
| HR | 95% CI | HR | 95% CI | HR | 95% CI | HR | 95% CI | HR | 95% CI | HR | 95% CI | HR | 95% CI | HR | 95% CI | |||||
| All-cause deaths, No. | 293 | 163 | 412 | 352 | 321 | 88 | 66 | 129 | 57 | 72 | ||||||||||
| Model 1* | 1.00 | 0.75 | 0.62 to 0.91 | 0.80 | 0.68 to 0.92 | 0.72 | 0.62 to 0.84 | 0.67 | 0.57 to 0.78 | < .001 | 1.00 | 0.80 | 0.58 to 1.10 | 0.65 | 0.50 to 0.85 | 0.48 | 0.34 to 0.67 | 0.49 | 0.36 to 0.67 | < .001 |
| Model 2† | 1.00 | 0.76 | 0.62 to 0.92 | 0.82 | 0.70 to 0.95 | 0.76 | 0.64 to 0.89 | 0.70 | 0.60 to 0.83 | < .001 | 1.00 | 0.86 | 0.63 to 1.20 | 0.72 | 0.55 to 0.94 | 0.54 | 0.38 to 0.75 | 0.55 | 0.40 to 0.75 | < .001 |
| Model 3‡ | 1.00 | 0.80 | 0.66 to 0.98 | 0.90 | 0.77 to 1.05 | 0.84 | 0.71 to 0.98 | 0.80 | 0.68 to 0.95 | .021 | 1.00 | 0.99 | 0.71 to 1.38 | 0.92 | 0.71 to 1.19 | 0.70 | 0.50 to 1.00 | 0.75 | 0.53 to 1.05 | .022 |
| Model 4§ | 1.00 | 1.00 | 0.72 to 1.39 | 0.88 | 0.65 to 1.19 | 0.66 | 0.46 to 0.94 | 0.69 | 0.49 to 0.98 | .006 | ||||||||||
| CRC deaths, No. | 126 | 75 | 199 | 183 | 162 | 26 | 19 | 45 | 19 | 19 | ||||||||||
| Model 1* | 1.00 | 0.90 | 0.67 to 1.19 | 0.90 | 0.72 to 1.12 | 0.89 | 0.71 to 1.12 | 0.81 | 0.64 to 1.02 | .159 | 1.00 | 0.80 | 0.44 to 1.44 | 0.78 | 0.48 to 1.26 | 0.56 | 0.31 to 1.02 | 0.45 | 0.25 to 0.81 | .004 |
| Model 2† | 1.00 | 0.82 | 0.61 to 1.11 | 0.89 | 0.71 to 1.13 | 0.89 | 0.71 to 1.13 | 0.81 | 0.64 to 1.03 | .178 | 1.00 | 0.85 | 0.47 to 1.54 | 0.86 | 0.53 to 1.40 | 0.62 | 0.34 to 1.14 | 0.50 | 0.28 to 0.92 | .014 |
| Model 3‡ | 1.00 | 0.83 | 0.62 to 1.11 | 0.93 | 0.74 to 1.17 | 0.91 | 0.72 to 1.16 | 0.84 | 0.66 to 1.07 | .281 | 1.00 | 0.97 | 0.53 to 1.78 | 1.07 | 0.64 to 1.78 | 0.80 | 0.43 to 1.48 | 0.66 | 0.35 to 1.24 | .155 |
| Model 4§ | 1.00 | 0.98 | 0.53 to 1.81 | 0.96 | 0.57 to 1.62 | 0.69 | 0.36 to 1.29 | 0.53 | 0.27 to 1.03 | .041 | ||||||||||
| CVD deaths, No. | 60 | 23 | 65 | 46 | 50 | 17 | 12 | 30 | 6 | 17 | ||||||||||
| Model 1* | 1.00 | 0.51 | 0.31 to 0.82 | 0.61 | 0.43 to 0.86 | 0.44 | 0.30 to 0.65 | 0.49 | 0.34 to 0.71 | < .001 | 1.00 | 0.73 | 0.35 to 1.53 | 0.77 | 0.43 to 1.40 | 0.26 | 0.10 to 0.66 | 0.58 | 0.29 to 1.13 | .026 |
| Model 2† | 1.00 | 0.51 | 0.32 to 0.83 | 0.67 | 0.47 to 0.95 | 0.50 | 0.34 to 0.74 | 0.55 | 0.38 to 0.81 | .002 | 1.00 | 0.80 | 0.38 to 1.69 | 0.86 | 0.47 to 1.58 | 0.28 | 0.11 to 0.73 | 0.66 | 0.33 to 1.31 | .065 |
| Model 3‡ | 1.00 | 0.58 | 0.35 to 0.94 | 0.82 | 0.57 to 1.18 | 0.66 | 0.44 to 0.98 | 0.78 | 0.52 to 1.15 | .239 | 1.00 | 0.88 | 0.42 to 1.87 | 1.11 | 0.59 to 2.06 | 0.39 | 0.15 to 1.02 | 0.87 | 0.43 to 1.77 | .361 |
| Model 4§ | 1.00 | 0.90 | 0.42 to 1.92 | 1.11 | 0.59 to 2.12 | 0.40 | 0.15 to 1.05 | 0.89 | 0.42 to 1.86 | .382 | ||||||||||
Abbreviations: CRC, colorectal cancer; CVD, cardiovascular disease; HR, hazard ratio; LTPA, leisure time physical activity; NIH, National Institutes of Health.
Model 1 used age as the underlying time metric and was adjusted for sex (male, female).
Model 2 was additionally adjusted for tumor site (colon, rectum), tumor grade, tumor stage (local, regional, unknown), surgery (yes, no), radiation (yes, no), chemotherapy (yes, no), time reported watching television (0 to 2, 3, ≥ 4 h/wk), and smoking status (never, former, current).
Model 3 was adjusted for all covariates in model 2 and also for body mass index (continuous kg/m2) and self-reported health (excellent/very good, good, fair, poor).
Model 4 used the same adjusting variables as model 3, but was mutually adjusted for pre- and postdiagnosis LTPA.
Postdiagnosis LTPA of ≥ 7 h/wk compared with no LTPA was associated with a 31% lower risk of all-cause mortality when adjusted for prediagnosis LTPA (HR, 0.69; 95% CI, 0.49 to 0.98; P for trend = .01). Comparing those reporting postdiagnosis LTPA of ≥ 7 h/wk with those reporting no LTPA, we found a nonsignificant 47% lower risk of CRC mortality (HR, 0.53; 95% CI, 0.27 to 1.03; P for trend = .04) but no association with CVD mortality (HR, 0.89; 95% CI, 0.42 to 1.86; P for trend = .38).
TV Viewing
Compared with those reporting 0 to 2 TV h/d before diagnosis, patients reporting ≥ 5 h/d had a 22% increased all-cause mortality risk (HR, 1.22; 95% CI, 1.06 to 1.41; P for trend = .002; Table 3). Although the association with CRC mortality was not statistically significant (HR, 1.18; 95% CI, 0.82 to 1.68; P for trend = .09), ≥ 5 h/d of TV, compared with 0 to 2 h/d, was positively associated with CVD mortality (HR, 1.55; 95% CI, 1.07 to 2.23; P trend = .01).
Table 3.
HRs for Prediagnosis and Postdiagnosis TV Viewing and Mortality Among Individuals Diagnosed With Colorectal Cancer in the NIH-AARP Study
| Mortality | Prediagnosis TV (n = 3,784) |
Postdiagnosis TV (n = 1,630) |
||||||||||
|---|---|---|---|---|---|---|---|---|---|---|---|---|
| 0-2 h/d HR | 3-4 h/d |
≥ 5 h/d |
P (trend) | 0-2 h/d HR | > 2-4 h/d |
> 4 h/d |
P (trend) | |||||
| HR | 95% CI | HR | 95% CI | HR | 95% CI | HR | 95% CI | |||||
| All-cause deaths, No. | 414 | 689 | 436 | 127 | 129 | 127 | ||||||
| Model 1* | 1.00 | 1.13 | 1.00 to 1.27 | 1.42 | 1.24 to 1.62 | < .001 | 1.00 | 1.09 | 0.85 to 1.39 | 1.62 | 1.27 to 2.08 | < .001 |
| Model 2† | 1.00 | 1.10 | 0.97 to 1.25 | 1.35 | 1.17 to 1.55 | < .001 | 1.00 | 1.08 | 0.84 to 1.38 | 1.47 | 1.14 to 1.90 | .004 |
| Model 3‡ | 1.00 | 1.07 | 0.95 to 1.21 | 1.22 | 1.06 to 1.41 | .002 | 1.00 | 1.00 | 0.78 to 1.28 | 1.25 | 0.96 to 1.63 | .104 |
| Model 4§ | 1.00 | 0.98 | 0.75 to 1.27 | 1.25 | 0.93 to 1.67 | .126 | ||||||
| CRC deaths, No. | 221 | 335 | 188 | 40 | 37 | 42 | ||||||
| Model 1* | 1.00 | 1.04 | 0.88 to 1.23 | 1.18 | 0.97 to 1.44 | .104 | 1.00 | 0.99 | 0.63 to 1.54 | 1.64 | 1.05 to 2.55 | .040 |
| Model 2† | 1.00 | 1.05 | 0.88 to 1.24 | 1.21 | 0.99 to 1.49 | .068 | 1.00 | 1.03 | 0.66 to 1.62 | 1.73 | 1.11 to 2.72 | .019 |
| Model 3‡ | 1.00 | 1.04 | 0.91 to 1.19 | 1.18 | 0.82 to 1.68 | .089 | 1.00 | 0.97 | 0.61 to 1.53 | 1.57 | 0.98 to 2.50 | .079 |
| Model 4§ | 1.00 | 0.90 | 0.56 to 1.46 | 1.45 | 0.85 to 2.47 | .156 | ||||||
| CVD deaths, No. | 51 | 112 | 80 | 25 | 31 | 19 | ||||||
| Model 1* | 1.00 | 1.47 | 1.05 to 2.04 | 2.12 | 1.49 to 3.02 | < .001 | 1.00 | 1.34 | 0.79 to 2.27 | 1.27 | 0.70 to 2.32 | .376 |
| Model 2† | 1.00 | 1.40 | 1.00 to 1.95 | 1.84 | 1.29 to 2.63 | < .001 | 1.00 | 1.32 | 0.78 to 2.26 | 1.06 | 0.57 to 1.96 | .779 |
| Model 3‡ | 1.00 | 1.29 | 0.92 to 1.80 | 1.55 | 1.07 to 2.23 | .012 | 1.00 | 1.27 | 0.74 to 2.16 | 0.89 | 0.48 to 1.65 | .775 |
| Model 4§ | 1.00 | 1.09 | 0.62 to 1.90 | 0.72 | 0.36 to 1.42 | .380 | ||||||
Abbreviations: CRC, colorectal cancer; CVD, cardiovascular disease; HR, hazard ratio; NIH, National Institutes of Health; TV, television.
Model 1 used age as the underlying time metric and adjusted for sex (male, female).
Model 2 additionally adjusted for tumor site (colon, rectum), tumor grade, tumor stage (local, regional), surgery (yes, no), radiation (yes, no), chemotherapy (yes, no), time reported in moderate to vigorous leisure time physical activity (never/rarely, < 1, 1 to 3, 4 to 7, ≥ 7 h/wk), and smoking status (never, former, current).
Model 3 was adjusted for all variables in model 2 and additionally adjusted for body mass index (continuous) and self-reported health (excellent/very good, good, fair, poor).
Model 4 used the same adjusting variables as model 3 but was also mutually adjusted for pre- and postdiagnosis TV viewing.
Postdiagnosis TV viewing more than 4 h/d compared with 0 to 2 h/d showed a nonsignificant increased all-cause mortality risk (HR, 1.25; 95% CI, 0.93 to 1.67; P for trend = .13), whereas no association was observed for CRC (HR, 1.45; 95% CI, 0.85 to 2.47; P for trend = .16) or CVD mortality (HR, 0.72; 95% CI, 0.36 to 1.42; P for trend = .38).
Joint Effects of Physical Activity and TV Watching
Compared with individuals reporting low LTPA (< 1 h/wk) and high TV (≥ 2 h/d) before diagnosis, we found a suggestion of lower all-cause mortality for those reporting low LTPA/low TV (0 to 2 h/d; HR, 0.88; 95% CI, 0.64 to 1.01), high LTPA (≥ 1 h/wk)/high TV (HR, 0.90; 95% CI, 0.79 to 1.02), or high LTPA/low TV (HR, 0.82; 95% CI, 0.70 to 0.96; Fig 2A). In postdiagnosis analyses, compared with the low LTPA/high TV group, we found a 29% lower all-cause mortality risk among the high LTPA/low TV group (HR, 0.71; 95% CI, 0.50 to 0.99) but no association among the low LTPA/low TV group (HR, 1.16; 95% CI, 0.80 to 1.70) or the high LTPA/high TV group (HR, 0.86; 95% CI, 0.66 to 1.13; Fig 2B).
We also analyzed change in LTPA or TV watching from before to after diagnosis; associations were not statistically significant (Data Supplement). In sensitivity analyses, we observed stronger postdiagnosis protective effects with higher LTPA among individuals older than the median age (68.9 years; P for interaction = .01) and among those who filled out the questionnaire within 4.2 years of cancer diagnosis (P for interaction = .05), but no evidence of interaction by sex, disease site, BMI, stage, grade, surgery, or health status (Fig 3A). We found no evidence of interaction between TV and the examined factors (Fig 3B). When we changed the underlying time metric to person-years from diagnosis to death/censoring, results were similar (data not shown). Additional sensitivity analyses excluding those who died within a year of filling out the questionnaires did not change our findings.
DISCUSSION
In this large, prospective cohort of patients with CRC, prediagnosis LTPA was associated with a 20% lower all-cause mortality risk. Postdiagnosis LTPA was associated with a 31% lower risk of all-cause mortality, independent of LTPA before diagnosis. Watching more than 4 hours of TV daily both before and after diagnosis was associated with an approximate 20% increased all-cause mortality risk, although the postdiagnosis estimate was not statistically significant. In joint effects analyses, the high LTPA/low TV group was at lowest all-cause mortality risk compared with the low LTPA/high TV group in both pre- and postdiagnosis analyses.
Our findings on prediagnosis LTPA and all-cause mortality are similar to previously reported associations. A recent meta-analysis calculated a pooled relative risk of 0.74 (95% CI, 0.61 to 0.89) for exercisers versus nonexercisers.9 Of the three prospective cohorts supporting an inverse association between prediagnosis LTPA and mortality, protective associations ranged from 23% to 28%.10–12 In contrast, another prospective study among women survivors of CRC showed no association between LTPA measured 6 months before diagnosis and survival.13 Associations in these studies for CRC mortality (HR range, 0.68 to 0.8610,12,13) were of similar magnitude to our CRC mortality findings.
Our findings on postdiagnosis LTPA and all-cause and CRC mortality confirm and extend previous findings. In the described meta-analysis, postdiagnosis physical activity was associated with a 32% lower risk of all-cause mortality (pooled estimate, 0.68; 95% CI, 0.60 to 0.78) comparing exercisers with nonexercisers.9 The six individual studies showed lower all-cause mortality risk estimates ranging from 25% to 63% comparing high to low LTPA.10,12–15,17 For postdiagnosis LTPA and CRC-specific mortality, although only two of the studies reached statistical significance,12,13 the pooled relative risk was significant at 0.74 (95% CI, 0.58 to 0.95). Previous studies have shown protective associations between LTPA and CVD mortality10; our observed lack of association between LTPA and CVD mortality was unexpected and may be a result of small numbers of CVD deaths.
Only one published study reported on sedentary time and mortality among survivors of CRC and, comparing those sitting ≥ 6 h/d before diagnosis with those sitting less than 3 h/d, found a 36% (95% CI, 1.20 to 1.68) increased all-cause mortality risk. Sitting ≥ 6 h/d compared with sitting less than 3 h/d after diagnosis was associated with a 27% increased mortality risk (95% CI, 0.99 to 1.64).10 Other studies have shown associations between TV time and weight gain8 and lower quality of life25 among survivors of CRC. Although TV watching does not indicate total sedentary time, TV watching on average accounts for more than half of leisure time activities among US adults.26
Previous studies have not reported on joint effects of physical activity and TV, although researchers in clinical trials have expressed concerns that increasing physical activity levels will lead to increased sedentary time in response to physical exertion. Our results suggest that LTPA was not as protective among those who performed high LTPA but also watched ≥ 3 h/d of TV, suggesting that encouraging both more exercise and less TV in this survivor population may lead to improved longevity outcomes.
There are several putative biologic mechanisms explaining the association between sedentary time, physical activity, and mortality. Some studies have shown higher insulin concentrations with more sedentary time, independent of physical activity levels.27,28 Still, physical activity increases insulin sensitivity.29 Higher circulating insulin and insulin-like growth factor-1 and lower insulin-binding protein levels have been associated with CRC risk in epidemiologic studies30–32 and with angiogenesis, tumor growth, and antiapoptotic activity in vivo.33–35 Another study showed higher CRC mortality among individuals with metabolic abnormalities related to insulin metabolism compared with those without hyperinsulinemia and insulin resistance.36 An additional proposed mechanism is that physical activity changes adipocytokine levels by decreasing inflammatory adipocytokines and increasing anti-inflammatory cytokines, both of which could affect cancer incidence and mortality.9 Physical activity may also improve cardiovascular health by lowering blood pressure.37 The Physical Exercise Across the Cancer Experience framework, which describes two distinct time periods before diagnosis and four after diagnosis, suggests buffering of cancer treatment effects and treatment coping as possible benefits of physical activity in the immediate treatment phase and general health promotion and immune function later after treatment.18
Strengths of our study include the prospective design with sufficient patients and extended follow-up time. Latent cancer likely did not affect exposure assessment given that data were collected well before diagnosis, and eliminating patients diagnosed within a year of questionnaires indicated no change in the observed associations. Still, because postdiagnosis analyses included only individuals who survived and were well enough to fill out the follow-up questionnaire, results may be more generalizable to populations with similar demographic and medical characteristics. We did our best to correct for lag time differences in analysis but acknowledge that interaction was observed and our results may be influenced by differences in timing of data collection and that these findings necessitate further research. Our study was also limited by slight differences in main exposure categories between pre- and postdiagnosis questionnaires and potential exposure misclassification as a result of self-report. We also relied on cancer registries for tumor characteristics and first reported course of treatment. Finally, our study suggests associations, rather than cause and effect, because of the observational nature of the data.
In conclusion, physical inactivity and TV viewing were associated with higher mortality risks in our study population. Because surveys of survivors of CRC have shown a high prevalence of physical inactivity and TV viewing, these findings present an opportunity for clinicians to encourage behavioral changes to positively impact longevity.
Supplementary Material
Acknowledgment
Cancer incidence data from the Atlanta metropolitan area were collected by the Georgia Center for Cancer Statistics, Department of Epidemiology, Rollins School of Public Health, Emory University, Atlanta, Georgia. Cancer incidence data from California were collected by the California Cancer Registry, California Department of Public Health's Cancer Surveillance and Research Branch, Sacramento, California. Cancer incidence data from the Detroit metropolitan area were collected by the Michigan Cancer Surveillance Program, Community Health Administration, Lansing, Michigan. The Florida cancer incidence data used in this report were collected by the Florida Cancer Data System, Miami, Florida, under contract with the Florida Department of Health, Tallahassee, Florida. The views expressed herein are solely those of the authors and do not necessarily reflect those of the Florida Cancer Data System or Florida Department of Health. Cancer incidence data from Louisiana were collected by the Louisiana Tumor Registry, Louisiana State University Health Sciences Center School of Public Health, New Orleans, Louisiana. Cancer incidence data from New Jersey were collected by the New Jersey State Cancer Registry, Cancer Epidemiology Services, New Jersey State Department of Health, Trenton, New Jersey. Cancer incidence data from North Carolina were collected by the North Carolina Central Cancer Registry, Raleigh, North Carolina. Cancer incidence data from Pennsylvania were supplied by the Division of Health Statistics and Research, Pennsylvania Department of Health, Harrisburg, Pennsylvania. The Pennsylvania Department of Health specifically disclaims responsibility for any analyses, interpretations, or conclusions. Cancer incidence data from Arizona were collected by the Arizona Cancer Registry, Division of Public Health Services, Arizona Department of Health Services, Phoenix, Arizona. Cancer incidence data from Texas were collected by the Texas Cancer Registry, Cancer Epidemiology and Surveillance Branch, Texas Department of State Health Services, Austin, Texas. Cancer incidence data from Nevada were collected by the Nevada Central Cancer Registry, State Health Division, State of Nevada Department of Health and Human Services, Las Vegas, Nevada.
We are indebted to the participants in the National Institutes of Health–AARP Diet and Health Study for their outstanding cooperation. We also thank Sigurd Hermansen and Kerry Grace Morrissey from Westat for study outcomes ascertainment and management and Leslie Carroll at Information Management Services for data support and analysis.
Footnotes
Supported, in part, by the Intramural Research Program of the National Institutes of Health, National Cancer Institute (Bethesda, MD).
Presented in part at the 39th Annual American Society of Preventive Oncology Conference, March 14-17, 2014, Birmingham, AL.
Authors' disclosures of potential conflicts of interest are found in the article online at www.jco.org. Author contributions are found at the end of this article.
AUTHORS' DISCLOSURES OF POTENTIAL CONFLICTS OF INTEREST
Disclosures provided by the authors are available with this article at www.jco.org.
AUTHOR CONTRIBUTIONS
Conception and design: Hannah Arem, Albert Hollenbeck, Charles E. Matthews
Administrative support: Yikyung Park
Collection and assembly of data: Albert Hollenbeck, Yikyung Park
Data analysis and interpretation: Hannah Arem, Ruth M. Pfeiffer, Eric A. Engels, Catherine M. Alfano, Yikyung Park, Charles E. Matthews
Manuscript writing: All authors
Final approval of manuscript: All authors
AUTHORS' DISCLOSURES OF POTENTIAL CONFLICTS OF INTEREST
Pre- and Postdiagnosis Physical Activity, Television Viewing, and Mortality Among Patients With Colorectal Cancer in the National Institutes of Health–AARP Diet and Health Study
The following represents disclosure information provided by authors of this manuscript. All relationships are considered compensated. Relationships are self-held unless noted. I = Immediate Family Member, Inst = My Institution. Relationships may not relate to the subject matter of this manuscript. For more information about ASCO's conflict of interest policy, please refer to www.asco.org/rwc or jco.ascopubs.org/site/ifc.
Hannah Arem
No relationship to disclose
Ruth M. Pfeiffer
No relationship to disclose
Eric A. Engels
No relationship to disclose
Catherine M. Alfano
No relationship to disclose
Albert Hollenbeck
Other Relationship: Love/Avon Army of Women
Yikyung Park
No relationship to disclose
Charles E. Matthews
No relationship to disclose
REFERENCES
- 1.American Cancer Society. Cancer Facts and Figures 2014. Atlanta, GA: American Cancer Society; 2014. [Google Scholar]
- 2.Haggar FA, Boushey RP. Colorectal cancer epidemiology: Incidence, mortality, survival, and risk factors. Clin Colon Rectal Surg. 2009;22:191–197. doi: 10.1055/s-0029-1242458. [DOI] [PMC free article] [PubMed] [Google Scholar]
- 3.Haskell WL, Lee IM, Pate RR, et al. Physical activity and public health: Updated recommendation for adults from the American College of Sports Medicine and the American Heart Association. Circulation. 2007;116:1081–1093. doi: 10.1161/CIRCULATIONAHA.107.185649. [DOI] [PubMed] [Google Scholar]
- 4.Friedenreich CM, Neilson HK, Lynch BM. State of the epidemiological evidence on physical activity and cancer prevention. Eur J Cancer. 2010;46:2593–2604. doi: 10.1016/j.ejca.2010.07.028. [DOI] [PubMed] [Google Scholar]
- 5.Blanchard CM, Courneya KS, Stein K. Cancer survivors' adherence to lifestyle behavior recommendations and associations with health-related quality of life: Results from the American Cancer Society's SCS-II. J Clin Oncol. 2008;26:2198–2204. doi: 10.1200/JCO.2007.14.6217. [DOI] [PubMed] [Google Scholar]
- 6.Courneya KS, Katzmarzyk PT, Bacon E. Physical activity and obesity in Canadian cancer survivors: Population-based estimates from the 2005 Canadian Community Health Survey. Cancer. 2008;112:2475–2482. doi: 10.1002/cncr.23455. [DOI] [PubMed] [Google Scholar]
- 7.Owen N, Healy GN, Matthews CE, et al. Too much sitting: The population-health science of sedentary behavior. Exerc Sport Sci Rev. 2010;38:105–113. doi: 10.1097/JES.0b013e3181e373a2. [DOI] [PMC free article] [PubMed] [Google Scholar]
- 8.Wijndaele K, Lynch BM, Owen N, et al. Television viewing time and weight gain in colorectal cancer survivors: A prospective population-based study. Cancer Causes Control. 2009;20:1355–1362. doi: 10.1007/s10552-009-9356-5. [DOI] [PubMed] [Google Scholar]
- 9.Je Y, Jeon JY, Giovannucci EL, et al. Association between physical activity and mortality in colorectal cancer: A meta-analysis of prospective cohort studies. Int J Cancer. 2013;133:1905–1913. doi: 10.1002/ijc.28208. [DOI] [PubMed] [Google Scholar]
- 10.Campbell PT, Patel AV, Newton CC, et al. Associations of recreational physical activity and leisure time spent sitting with colorectal cancer survival. J Clin Oncol. 2013;31:876–885. doi: 10.1200/JCO.2012.45.9735. [DOI] [PubMed] [Google Scholar]
- 11.Haydon AM, Macinnis RJ, English DR, et al. Effect of physical activity and body size on survival after diagnosis with colorectal cancer. Gut. 2006;55:62–67. doi: 10.1136/gut.2005.068189. [DOI] [PMC free article] [PubMed] [Google Scholar]
- 12.Kuiper JG, Phipps AI, Neuhouser ML, et al. Recreational physical activity, body mass index, and survival in women with colorectal cancer. Cancer Causes Control. 2012;23:1939–1948. doi: 10.1007/s10552-012-0071-2. [DOI] [PMC free article] [PubMed] [Google Scholar]
- 13.Meyerhardt JA, Giovannucci EL, Holmes MD, et al. Physical activity and survival after colorectal cancer diagnosis. J Clin Oncol. 2006;24:3527–3534. doi: 10.1200/JCO.2006.06.0855. [DOI] [PubMed] [Google Scholar]
- 14.Meyerhardt JA, Heseltine D, Niedzwiecki D, et al. Impact of physical activity on cancer recurrence and survival in patients with stage III colon cancer: Findings from CALGB 89803. J Clin Oncol. 2006;24:3535–3541. doi: 10.1200/JCO.2006.06.0863. [DOI] [PubMed] [Google Scholar]
- 15.Meyerhardt JA, Giovannucci EL, Ogino S, et al. Physical activity and male colorectal cancer survival. Arch Intern Med. 2009;169:2102–2108. doi: 10.1001/archinternmed.2009.412. [DOI] [PMC free article] [PubMed] [Google Scholar]
- 16.Meyerhardt JA, Ogino S, Kirkner GJ, et al. Interaction of molecular markers and physical activity on mortality in patients with colon cancer. Clin Cancer Res. 2009;15:5931–5936. doi: 10.1158/1078-0432.CCR-09-0496. [DOI] [PMC free article] [PubMed] [Google Scholar]
- 17.Baade PD, Meng X, Youl PH, et al. The impact of body mass index and physical activity on mortality among patients with colorectal cancer in Queensland, Australia. Cancer Epidemiol Biomarkers Prev. 2011;20:1410–1420. doi: 10.1158/1055-9965.EPI-11-0079. [DOI] [PubMed] [Google Scholar]
- 18.Courneya KS, Friedenreich CM. Framework PEACE: An organizational model for examining physical exercise across the cancer experience. Ann Behav Med. 2001;23:263–272. doi: 10.1207/S15324796ABM2304_5. [DOI] [PubMed] [Google Scholar]
- 19.Fritz AG. International Classification of Diseases for Oncology: ICD-O. Geneva, Switzerland: World Health Organization; 2000. [Google Scholar]
- 20.Michaud D, Midthune D, Hermansen S, et al. Comparison of cancer registry case ascertainment with SEER estimates and self-reporting in a subset of the NIH-AARP Diet and Health Study. J Registry Manage. 2005;32:70–75. [Google Scholar]
- 21.Gierach GL, Chang SC, Brinton LA, et al. Physical activity, sedentary behavior, and endometrial cancer risk in the NIH-AARP Diet and Health Study. Int J Cancer. 2009;124:2139–2147. doi: 10.1002/ijc.24059. [DOI] [PMC free article] [PubMed] [Google Scholar]
- 22.Howard RA, Freedman DM, Park Y, et al. Physical activity, sedentary behavior, and the risk of colon and rectal cancer in the NIH-AARP Diet and Health Study. Cancer Causes Control. 2008;19:939–953. doi: 10.1007/s10552-008-9159-0. [DOI] [PMC free article] [PubMed] [Google Scholar]
- 23.Chasan-Taber S, Rimm EB, Stampfer MJ, et al. Reproducibility and validity of a self-administered physical activity questionnaire for male health professionals. Epidemiology. 1996;7:81–86. doi: 10.1097/00001648-199601000-00014. [DOI] [PubMed] [Google Scholar]
- 24.Wolf AM, Hunter DJ, Colditz GA, et al. Reproducibility and validity of a self-administered physical activity questionnaire. Int J Epidemiol. 1994;23:991–999. doi: 10.1093/ije/23.5.991. [DOI] [PubMed] [Google Scholar]
- 25.Lynch BM, Cerin E, Owen N, et al. Television viewing time of colorectal cancer survivors is associated prospectively with quality of life. Cancer Causes Control. 2011;22:1111–1120. doi: 10.1007/s10552-011-9786-8. [DOI] [PubMed] [Google Scholar]
- 26.US Department of Labor, Bureau of Labor Statistics. American Time Use Survey. Washington, DC: US Department of Labor; 2011. [Google Scholar]
- 27.Helmerhorst HJ, Wijndaele K, Brage S, et al. Objectively measured sedentary time may predict insulin resistance independent of moderate- and vigorous-intensity physical activity. Diabetes. 2009;58:1776–1779. doi: 10.2337/db08-1773. [DOI] [PMC free article] [PubMed] [Google Scholar]
- 28.Ford ES, Li C, Zhao G, et al. Sedentary behavior, physical activity, and concentrations of insulin among US adults. Metabolism. 2010;59:1268–1275. doi: 10.1016/j.metabol.2009.11.020. [DOI] [PubMed] [Google Scholar]
- 29.Helmrich SP, Ragland DR, Leung RW, et al. Physical activity and reduced occurrence of non-insulin-dependent diabetes mellitus. N Engl J Med. 1991;325:147–152. doi: 10.1056/NEJM199107183250302. [DOI] [PubMed] [Google Scholar]
- 30.Ma J, Pollak MN, Giovannucci E, et al. Prospective study of colorectal cancer risk in men and plasma levels of insulin-like growth factor (IGF)-I and IGF-binding protein-3. J Natl Cancer Inst. 1999;91:620–625. doi: 10.1093/jnci/91.7.620. [DOI] [PubMed] [Google Scholar]
- 31.Kaaks R, Toniolo P, Akhmedkhanov A, et al. Serum C-peptide, insulin-like growth factor (IGF)-I, IGF-binding proteins, and colorectal cancer risk in women. J Natl Cancer Inst. 2000;92:1592–1600. doi: 10.1093/jnci/92.19.1592. [DOI] [PubMed] [Google Scholar]
- 32.Giovannucci E, Pollak MN, Platz EA, et al. A prospective study of plasma insulin-like growth factor-1 and binding protein-3 and risk of colorectal neoplasia in women. Cancer Epidemiol Biomarkers Prev. 2000;9:345–349. [PubMed] [Google Scholar]
- 33.Sandhu MS, Dunger DB, Giovannucci EL. Insulin, insulin-like growth factor-I (IGF-I), IGF binding proteins, their biologic interactions, and colorectal cancer. J Natl Cancer Inst. 2002;94:972–980. doi: 10.1093/jnci/94.13.972. [DOI] [PubMed] [Google Scholar]
- 34.Warren RS, Yuan H, Matli MR, et al. Induction of vascular endothelial growth factor by insulin-like growth factor 1 in colorectal carcinoma. J Biol Chem. 1996;271:29483–29488. doi: 10.1074/jbc.271.46.29483. [DOI] [PubMed] [Google Scholar]
- 35.Wu Y, Yakar S, Zhao L, et al. Circulating insulin-like growth factor-I levels regulate colon cancer growth and metastasis. Cancer Res. 2002;62:1030–1035. [PubMed] [Google Scholar]
- 36.Trevisan M, Liu J, Muti P, et al. Markers of insulin resistance and colorectal cancer mortality. Cancer Epidemiol Biomarkers Prev. 2001;10:937–941. [PubMed] [Google Scholar]
- 37.Myers J. Exercise and cardiovascular health. Circulation. 2003;107:e2–e5. doi: 10.1161/01.cir.0000048890.59383.8d. [DOI] [PubMed] [Google Scholar]
Associated Data
This section collects any data citations, data availability statements, or supplementary materials included in this article.