Abstract
Objective
Endovascular aneurysm repair (EVAR) is associated with significant direct device costs. Such costs place EVAR at odds with efforts to constrain healthcare expenditures. This study examines the procedure-associated costs and operating margins associated with EVAR at a tertiary care academic medical center.
Methods
All infrarenal EVARs performed from April 2011 to March 2012 were identified (n = 127). Among this cohort, 49 patients met standard commercial instruction for use guidelines, were treated using a single manufacturer device, and billed to Medicare diagnosis-related group (DRG) 238. Of these 49 patients, net technical operating margins (technical revenue minus technical cost) were calculated in conjunction with the hospital finance department. EVAR implant costs were determined for each procedure. DRG 238-associated costs and length of stay were benchmarked against other academic medical centers using University Health System Consortium 2012 data.
Results
Among the studied EVAR cohort (age 75, 82% male, mean length of stay, 1.7 days), mean technical costs totaled $31,672. Graft implants accounted for 52% of the allocated technical costs. Institutional overhead was 17% ($5495) of total technical costs. Net mean total technical EVAR-associated operating margins were —$4015 per procedure. Our institutional costs and length of stay, when benchmarked against comparable centers, remained in the lowest quartile nationally using University Health System Consortium costs for DRG 238. Stent graft price did not correlate with total EVAR. market share.
Conclusions
EVAR is currently associated with significant negative operating margins among Medicare beneficiaries. Currently, device costs account for over 50% of EVAR-associated technical costs and did not impact EVAR market share, reflecting an unawareness of cost differential among surgeons. These data indicate that EVAR must undergo dramatic care delivery redesign for this practice to remain sustainable.
The advent and subsequent evolution of endovascular aneurysm repair (EVAR) has altered not only both the morbidity and mortality profile of abdominal aortic aneurysm (AAA) repair but also the manner in which aneurysm care is delivered.1–3 Accordingly, EVAR has solidified its role in contemporary practice as a mainstay of therapy for both elective and ruptured AAA, in anatomically suited patients. Despite these tangible gains in patient care, EVAR remains associated with significant procedure-related costs.4,5
Healthcare costs have steadily increased over time with some projections anticipating expenditures to reach 20% of U.S. gross domestic product by 2020.6 As a result, vigorous debate surrounding healthcare reform has ensued, with a growing emphasis placed on value, quality, and cost. While EVAR represents an appealing prevalent less invasive procedure in contemporary practice, its high cost profile decreases its potential value, placing it at odds with potential looming cost constraint reforms. The purpose of this study was to examine the procedure-associated costs and operating margins associated with EVAR at a tertiary care academic medical center.
METHODS
Subjects
This study reflects data collected at Dartmouth-Hitchcock Medical Center on all patients who underwent elective EVAR between April 2011 and March 2012 (n = 127). Ruptured aneurysms were excluded. We sought to derive a relatively uniform anatomic operative cohort for cost analysis, in whom any commercially available device could be used. We, thus, excluded cases where anatomy was deemed outside conventional instruction for use guidelines. We next included cases treated only by a single vendor's device, thereby eliminating cases treated with multiple pieces from various manufacturers, or those with multiple extensions or cuff placements that would confound cost analysis. We lastly restricted our payer source to Medicare remunerated cases, which constitute 88% of our aneurysm practice, whose procedures were billed using the diagnosis-related group (DRG) 238 code, reaching a final patient cohort for cost analysis (n = 49). DRG 237 billed AAA cases with major complications were also excluded from further cost analysis for this study. Exclusion criteria are further detailed in the Supplementary Table (online only). All patients were treated with commercially available stent graft devices determined by the operating surgeon.
Outcomes and variable definitions
Hospital financial cost and revenue data was obtained from the Dartmouth-Hitchcock Department of Finance and adjudicated by the institution's Chief Financial Officer. Annual net technical operating margin for DRG 238 was determined for the Section of Vascular Surgery. Overall, DRG 238 costs and length of stay were further benchmarked against comparable academic medical centers using University Health System Consortium (UHC) 2012 cost data to better define our institution's cost profile in relation to comparable institutions. DRG reimbursement reflects a variety of institution-associated factors including geographic location, teaching status, base payment, and relative weight. At our institution, EVAR constituted 42% of the DRG 238 remunerated cases. Furthermore, cost to charge ratios can be used to compare cost across institutions relative with charges. This methodology has been previously described in further detail for similar analyses.4 Our cost methodology did not use hospital based charges in its computation. DRG 238 technical costs and associated revenues were determined for the study cost cohort (n = 49) to determine per case costs and margins. EVAR stent graft implant costs were determined. Additional technical institutional cost components and expense breakdown included operating room (OR), supplies, which included the expense of additional stents, wires, catheters, instruments, and other adjunctive equipment, not including the stent graft implantable, bed, which included room expenses including floor, telemetry, and/or intensive care unit costs. Radiology expenses included any plain films, ultrasound, computed tomography scans and additional diagnostic testing. Laboratory and pharmacy charges were grouped, as done in previous published analyses. Finally, other constituted overall miscellaneous-associated costs including institutional overhead, which was allocated based on a local varying formula by category. OR costs are allocated by time in our institution and included costs of OR staff, depreciation of equipment, anesthesia time, and recovery room. Thus, the cost methodology at Dartmouth-Hitchcock Medical Center is unique and not necessarily applicable to other institutions. Net technical operating margins (technical revenues minus technical costs) were calculated.
Market share and device costs were also determined for major commercial vendors. Shifts in market share, among the entire EVAR cohort (n = 127) were projected using current graft costs to guide device selection for the estimated 44% of our total aneurysm practice in whom anatomy would permit use of any major commercially available device, thus, permitting hypothetical interchange of specific stent grafts. Projected savings were then determined based on the graft cost disparity and subsequent shifts in market share in this subset (44%) of patients from the entire EVAR cohort (n = 127).
RESULTS
Over the study interval, a total of 127 patients underwent elective EVAR, in whom 49 met inclusion criteria for cost analysis. Mean length of stay for this group (n = 49) was 1.7 days. The net annual operating margin for all DRG 238 remunerated EVAR was substantially negative, approaching —$500,000.00 per year.
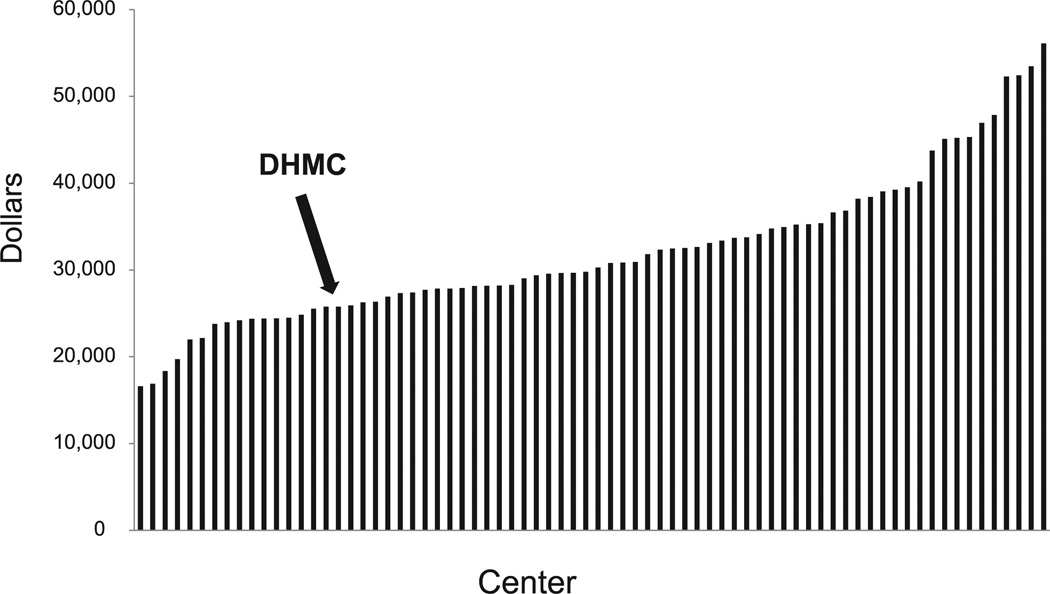
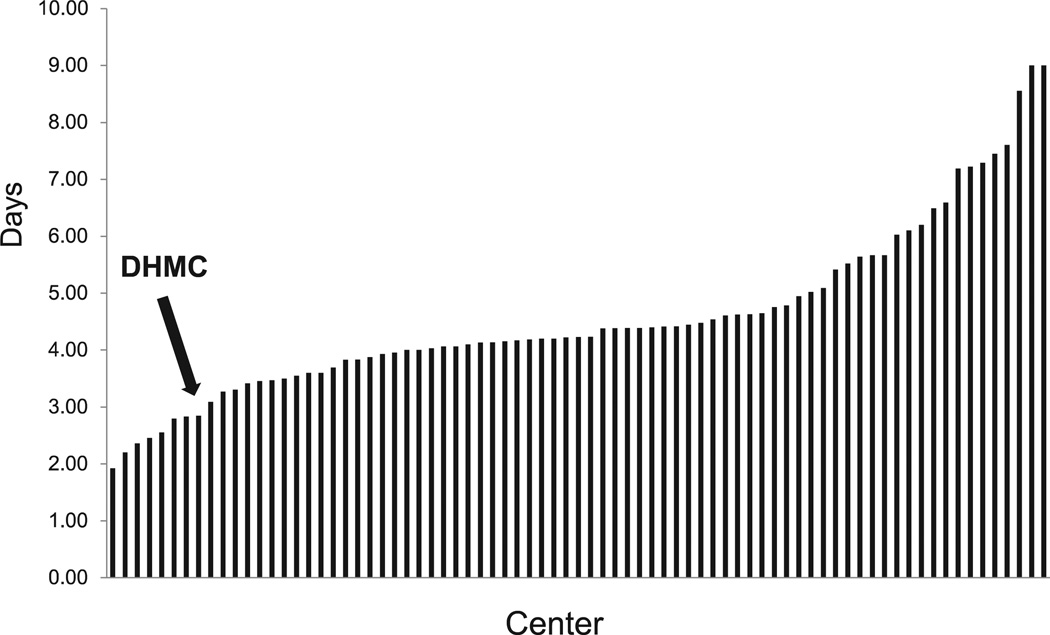
To better account for this negative margin finding, hospital DRG 238 overall costs and DRG 238 length of stay, two major drivers for procedure-associated costs, were benchmarked against comparable academic medical centers using UHC 2012 data. Our institution compared favorably with others, falling in the lowest quartile of participating institutions (Figs 1 and 2).
Fig. 1.
University Health System Consortium (UHC) 2012 diagnosis-related group (DRG) 238 overall costs stratified by center. Dartmouth-Hitchcock Medical Center (DHMC) is in the lowest quartile of reporting centers (arrow). Data reflect all DRG 238 procedures.
Fig. 2.
University Health System Consortium (UHC) 2012 diagnosis-related group (DRG) 238 length of stay stratified by center. Dartmouth-Hitchcock Medical Center (DHMC) remains in the lowest quartile among centers (arrow). Data reflect all DRG 238 procedures.
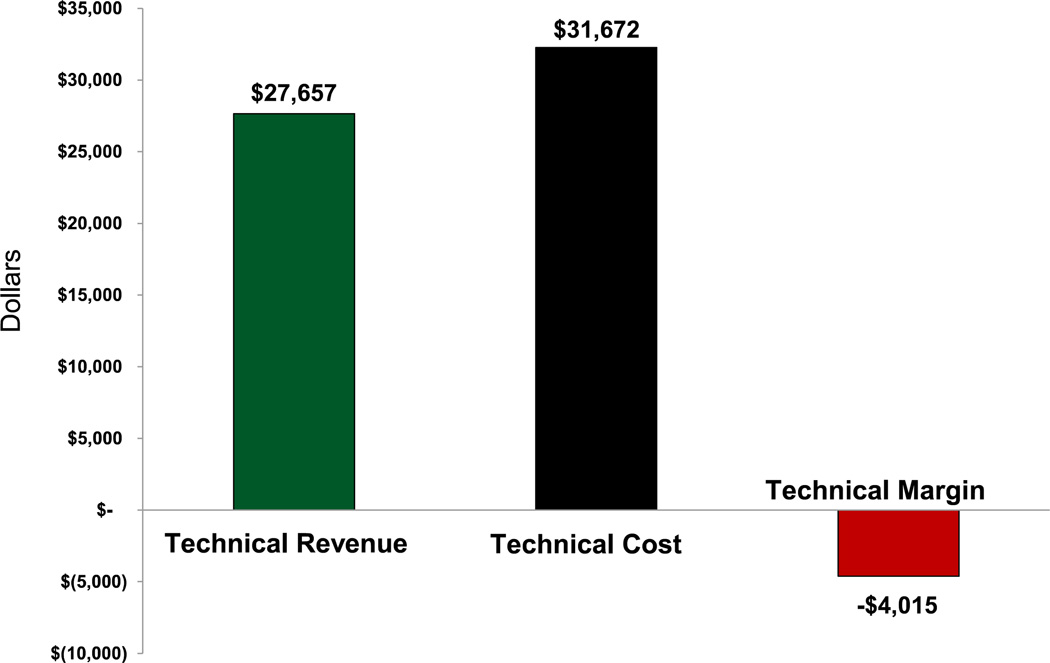
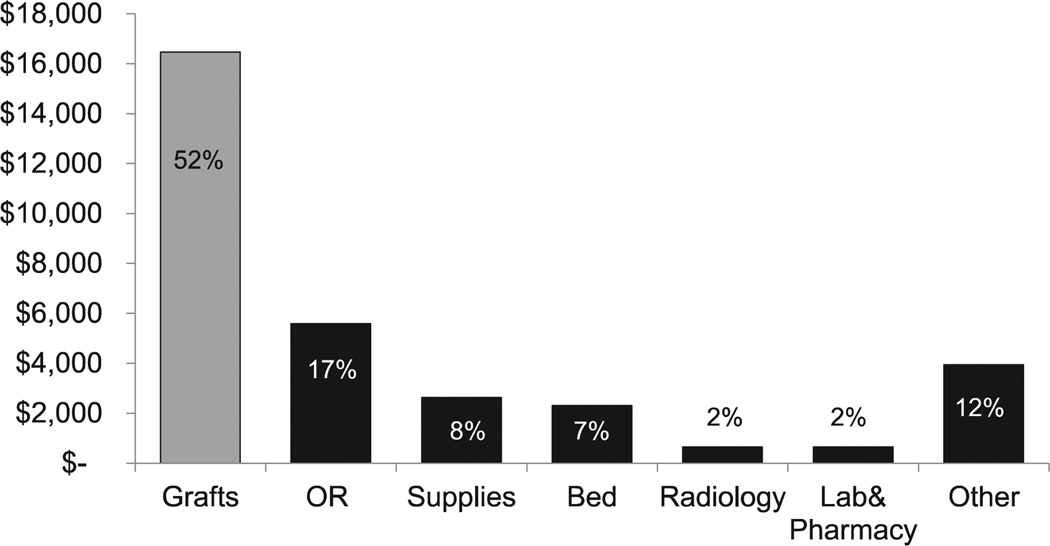
On a per case level, reflecting the study cohort for cost analysis (n = 49), DRG 238 mean technical costs ($31,672) surpassed DRG 238 mean technical revenue ($27,657), resulting in a negative technical margin of —$4,015 per case, consistent with the cumulative annual net operating margin finding (Fig 3). Stent graft implants accounted for the majority of technical cost (52%). Among the nongraft implant drivers for technical cost, OR (17%) was the largest. Additional costs included supplies (8%), bed (7%), radiology (2%), laboratory and pharmacy (2%), and other (12%, institutional overhead costs). Compared with nonimplant costs, stent grafts still accounted for greater than threefold more in technical costs than OR costs (Fig 4). Furthermore, while associated stent graft costs were determined to account for 52% of the per case technical costs, they assumed a greater percentage (60%), of the DRG payment, thus contributing to the aforementioned negative annual operating margin.
Fig. 3.
Diagnosis-related group (DRG) 238 remunerated endovascular aneurysm repair (EVAR) technical costs, revenues, and operating margin per EVAR case demonstrating a negative —$4015 margin.
Fig. 4.
Nonstent graft overhead costs associated with diagnosis-related group (DRG) 238 remunerated endovascular aneurysm repair (EVAR). By comparison, stent grafts (shown on left) account for threefold more than operating room (OR) costs, the greatest nonimplant hospital costs.
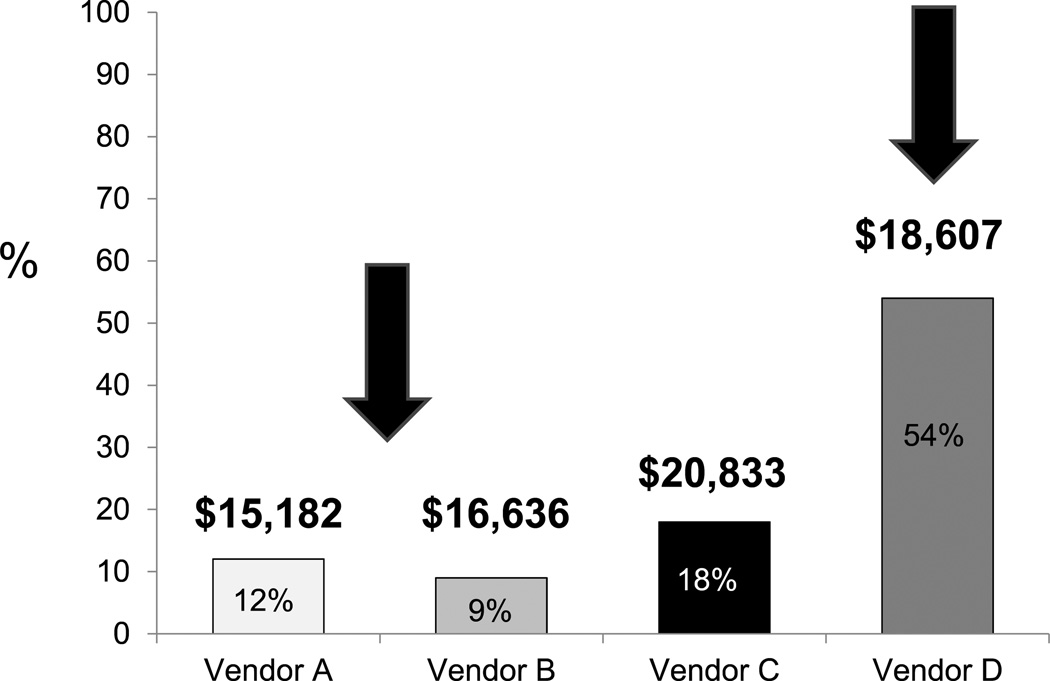
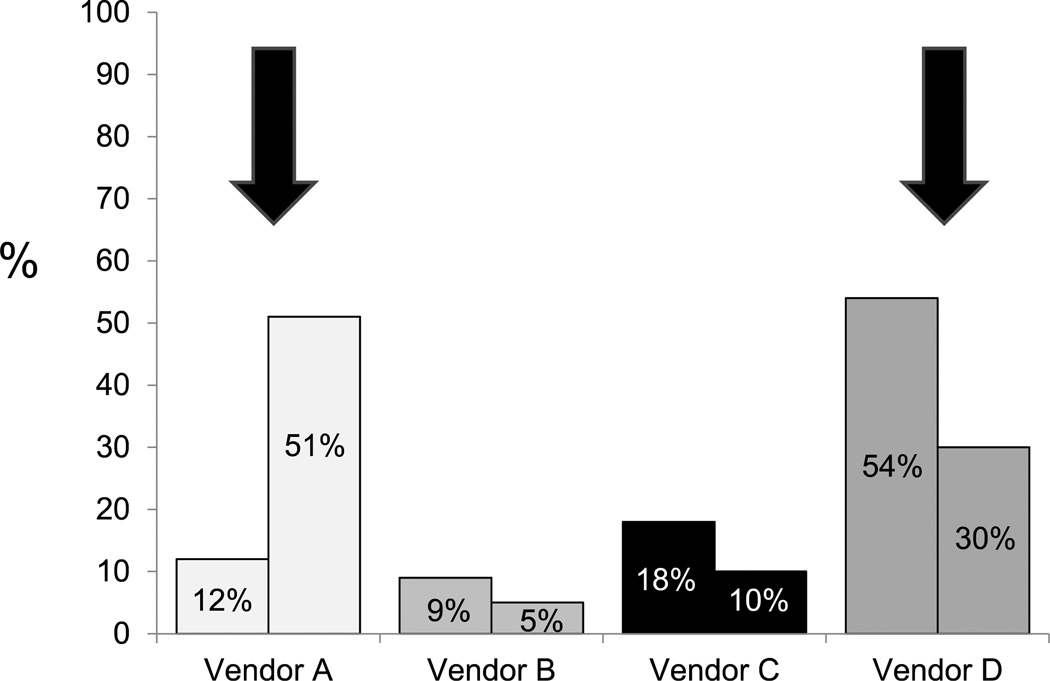
Given the substantial cost of graft implants to the procedure cost burden, total vendor market share was determined for the entire Section of Vascular Surgery, reflecting the entire EVAR cohort (n = 127). Market share and graft cost did not correlate, with higher cost devices assuming greater utilization, while the lower cost devices garnered lower market share (Fig 5). Shifts in market share were next projected using current device costs and 44% of the total EVAR volume in which we estimate that all major commercially available devices could be used interchangeably with equipoise. Accordingly, vendor A would increase its market share from 12% to 51%, whereas vendor D would experience a reduction in market share from 54% to 30% (Fig 6). Projected savings related to market share shifts would approach $200,000 annually, reflecting the cost disparity among devices for the 44% subset of patients in whom device interchange was permissible.
Fig. 5.
Vendor market share of total endovascular aneurysm repair (EVAR) practice with associated mean institutional pricing. As shown (arrows), vendor D derived the largest market share, though it did not sell the lowest cost device, whereas vendors A and B shared a smaller percentage of the market share, though their devices were less expensive.
Fig. 6.
Projected vendor market shares reflecting shift in device utilization based on cost for the 44% of the total endovascular aneurysm repair (EVAR) volume whereby devices can be used with clinical equipoise. As shown in the figure (arrows), vendor A would increase market share from 12% to 51%, whereas vendor D would decrease its market share from 54% to 30%.
DISCUSSION
The inexorable rise in healthcare expenditures has ushered in a new era of care delivery with a growing emphasis placed on cost reduction, quality improvement, and overall value.6 In this context, while the Affordable Care Act has provided de facto expansion in healthcare access to many Americans, it remains unclear whether it will effectively constrain the associated costs of care delivery. Accordingly, healthcare systems and hospitals alike are now confronted with growing costs associated with expensive specialty care, which have significant sustainability implications. EVAR has emerged as a potential high value procedure in contemporary practice, though it remains associated with significant procedure-associated costs.4,5,7–9 Accordingly, this study aimed to examine the procedure-associated costs and revenues associated with Medicare remunerated EVAR Medicare currently constitutes 88% of our total EVAR practice, thus highlighting the significance of delivering EVAR to this substantial and likely growing segment of the patient population.
This study provides important insight surrounding the financial profile of EVAR in contemporary practice. Specifically, EVAR was associated with negative technical operating margins both annually and on a per case basis when associated with a Medicare payer source. In keeping with other studies, which have previously demonstrated the significant expense profile of EVAR,4,5,7–10 this study documented that stent grafts serve as the major technical cost driver, constituting over 50% of the associated costs. Furthermore, compared with other nongraft procedure costs, stent grafts were notably more than threefold greater than any of the nonimplant hospital-associated costs. Though EVAR stent grafts accounted for the majority of technical costs, our analysis also attempted to define additional opportunities for comprehensive procedure-associated cost reduction and quality improvement, to further eliminate procedure-associated waste, though these costs were not the primary focus of this report.
This analysis is in keeping with additional studies that determined the disproportionate costs associated with the requisite stent grafts for EVAR in comparison to the procedure specific DRG Medicare reimbursement rates. Specifically, Sternbergh et al, in a multicenter study surrounding EVAR-associated costs, determined that Medicare payments in 1999 were insufficient to cover the associated costs of the procedure at that time, resulting in a negative margin.5 Moreover, an analysis of EVAR-associated costs by Bertges et al, also demonstrated similar findings in 2003. In their study, when hospital reimbursement was weighted by DRG case mix, there was an average shortfall of $2162 and $3827, respectively, depending on the reimbursement methodology used.4 Interestingly, this study also demonstrates a sustained negative procedure-associated margin for EVAR Furthermore, it appears this is largely driven by high device-associated costs, which have increased over time, like many costs. Despite these findings, both past and present, there appears to have been little traction in correcting this imbalance.
This trend is potentially unsustainable for hospitals. While earlier reports have often investigated EVAR costs in comparison with open repair,8,11–16 ample evidence has since accrued validating diminished EVAR-associated morbidity and mortality.1–3 Furthermore, the supplemental impact of patient driven demand for less invasive therapies has obviated to some extent, the relevance of cost effective analyses comparing the two procedures. Rather, EVAR has rightly secured its foothold in contemporary aneurysm practice, irrespective of cost. Therefore, the focus of this analysis should be directed toward making EVAR-associated costs and margins more neutral and, thus, palatable for sustainable healthcare systems.
The need for meaningful device cost reduction is further highlighted by our finding that other major drivers for procedure-associated cost, such as length of stay, at our institution were already in the lowest quartile compared with other academic centers, when benchmarked using UHC 2012 publicly available data. The need for device cost constraint is inevitably augmented by the current analysis demonstrating that mean device costs account for 52% of the procedure cost, but assume 60% of the DRG payment, highlighting the inequity between device cost and current insufficient DRG payment to adequately cover these costs.
Alternatively, the need for DRG payment modification among Medicare beneficiaries to adequately cover high cost devices seems unlikely in the setting of an overall posture toward curbing Federal healthcare expenditures. Interestingly, Bertges et al reached similar conclusions in their 2002 analysis.4 Current expectations for increasing DRG payments by the Centers for Medicare and Medicaid Services would suggest at best modest increments by 2014 and are unlikely to sufficiently onset the negative margins described herein.17
Interestingly, surgeons were largely unaware of the pricing variation among devices and respective vendors, in keeping with alternative healthcare economic reports.6 Historically, cost has not routinely factored into case planning paradigms for EVAR at our institution. We estimate, based on anatomic review that roughly over 40% of our EVAR practice could likely be treated interchangeably by most commercially available devices with clinical equipoise. Accordingly, device cost awareness may serve to foster shifts in market share to appropriately reflect competitive pricing among stent graft vendors. We believe that such changes in our practice pattern would have an immediate savings of roughly $200,000 annually and serve to offset our negative margin findings.
This study has several intrinsic limitations. First, costs, revenues, and margins for EVAR are likely to fluctuate among institutions and regions across the country where local practice and care delivery can vary. Furthermore, this study only provides an isolated analysis of the EVAR procedure itself with its associated margin. It does not include other potential drivers for revenue associated with EVAR care such as follow-up visits and computed tomography scans. We opted to exclude this from our analysis, as many large referral hospitals perform the EVAR procedure, thus incurring the margins associated with the surgery but not deriving the revenue from follow-up as these are often performed at smaller referring hospitals, leading to the phenomena of “destination care,” which may confound costs analyses of care delivery. Nevertheless, we believe the compelling procedure-associated margin findings at our institution, may be prevalent across many hospitals throughout the United States, for Medicare remunerated cases. In addition, we did not include professional fees and costs, as we believe they can vary substantially and are less likely consistent across institutions pending individual surgeon practice/hospital business models.
Furthermore, this analysis did not include DRG 237 remunerated EVAR, with major complications, where procedure-associated costs may be even higher. To reach a threshold for the higher paying DRG 237, a patient must have a major complication or comorbidity (MCC). For example, a history of congestive heart failure does not qualify as an MCC. Rather, a patient must have acute systolic heart failure. Due to this high threshold, qualifying MCC patients are acutely ill and require substantial, incremental resources to recover, thus significantly impacting associated costs and clouding the analyses. Thus, the impact of maintaining a comprehensive EVAR program may have a potentially amplified negative margin for hospitals and health systems offering these services. This report also did not include the minority of EVAR patients with a private payer source, where rates of remuneration can vary widely across institutions and regions, thus impacting the financial margin associated with the procedure.
CONCLUSIONS
In summary, DRG 238-remunerated EVAR was associated with negative technical operating margins at our institution. Stent grafts account for over 50% of the procedure-associated technical costs and threefold more than any other major nonimplant cost drivers. Device cost did not predict vendor market share, demonstrated by higher cost devices deriving larger EVAR market shares. Moreover, surgeons were largely unaware of this cost disparity and variation. Based on these findings and current cost profile, Medicare-remunerated EVAR is likely unsustainable in the long term for hospitals that provide comprehensive EVAR care. In addition, surgeon awareness of vendor price differentials may serve to both inform case planning and better negotiate competitive device pricing. Potential novel models for more cost neutral EVAR care delivery predicated on cost transparency and potential increased DRG remuneration to offset margin losses are needed for long-term sustainable healthcare systems.
Supplementary Material
Appendix
DISCUSSION
Dr Julie Ann Freischlag (Baltimore, Md). As you probably are aware, we presented some results from UCLA about 13 years ago that actually at that time showed that there was adequate funding for the grafts at that time even though they did contribute to that high cost. And one of my greatest worries has been is when is the day going to be that we cannot afford to do this? I guess that day is today! Internationally, in many countries only those who can afford to individually pay for high priced technology receive it.
My question to you is about the Veterans Affairs (VA). As you know, we published the cost of the endovascular graft in the VA setting and actually came out with the statement in our paper that it actually was not more costly because the way accounting is done in the VA system. All costs are spread like butter. So that in the OVER trial, the endovascular grafts were not more expensive than the open graft in that cost setting.
Do you think perhaps as we go ahead with health care reform this could be the way costs of hospitalization are distributed— spread across all patients—like butter?
Dr Stone. I think that is an interesting question. It is often difficult to extrapolate practice patterns in the VA system to the university system. Clearly, at Dartmouth, where the whole accountable care organization, ACO model, is being championed, much scrutiny is being placed on individual procedure finances. Certainly, the idea of cost sharing is an interesting one.
Currently at our institution we are even looking at care delivery in a more granular fashion, a patient-focused economic analysis, or PFEA. Therefore, even in a less magnified view, if lesser cost procedures were able to counteract some of the cost impact of EVAR, I suspect from our hospital administration's standpoint, an unsustainable procedure-associated margin for EVAR is likely not going to be a good practice pattern for long-term care.
Dr Freischlag. I think in the VA they did not ask anybody, they just did it.
Dr W. Charles Sternbergh (New Orleans, La). I enjoyed your paper very much and it is like kind of déjà vu all over again. At the Society for Vascular Surgery meeting in 1999,1 presented data very similar to this. It was 3 months before the first commercial devices became available in the United States. And much to everybody's shock and surprise, we found the same thing. There were higher costs for endovascular AAA repair, with the endograft cost about 50% of the total hospital cost. I naively opined then that surely these prices would come down as more competitors came into the market; but endografts have gone from $8500 to $9000 then, to about $15,000 to $18,000 now. So that has really not happened.
I very much agree with your assessment that we in vascular surgery must take a leadership role in raising awareness of these hospital costs for endovascular aneurysm repair. Most vascular specialists are unaware of these cost issues.
I have one question for you. Why did you exclude all of your patients that were coded into DRG 237? Those are patients that, as you suggested, have higher costs, but they also have higher reimbursement.
Dr Stone. We chose to exclude those patients, with major complications, billed using DRG 237, because we thought they represented a different subset of EVAR treated patients. The cost profile and DRG remuneration, as you point out, is different. We thought that our first foray into this analysis would be to look at the most simple EVARs, if you will, the so-called apple-on-a-stick EVAR cases where other cost driving factors, such as length of stay would not necessarily confound our analysis.
Moreover, when we looked at our DRG 237 billed volume, we had roughly 12 patients over the study interval in that group and, thus, chose to exclude them.
Since you made the point of graft prices and the lack of change over time, I would add that we were somewhat surprised by these findings. Moreover, in our own practice, we historically have not factored device cost in case planning paradigms.
I would argue one potential reason why we have not seen device cost reduction, across the country, is the obfuscation of pricing by a myriad of reasons. As an example for instance, the price we get at Dartmouth may not be the same price that you are paying for the identical graft at your institution, which is altogether different from the price that we pay for a different manufacturer and so forth. I think that this inherent lack of transparency has led to this sustained practice pattern.
Dr Frank Sharp (Brick, NJ). You have partially answered my question with your previous comments. Are you aware of any data outside of the United States in terms of a similar analysis for the cost for the devices? I think as vascular surgeons we need to have these companies compete a little bit, and if these devices are provided outside the United States for substantially less cost, we should be aware of that.
Dr Stone. I agree completely. Yesterday I received the Wylie Traveling Fellowship Award and that is exactly what our application is about. We plan to examine this issue in Europe and look at the cost of devices in different capitated systems for comparison. But you are potentially correct that a lack of transparency in the health care economics of our country may go a long way in subsidizing expensive devices in other parts of the world.
Dr Krish Soundararajan (Wilmington, Del). This is a very timely paper. I think it is naive for vascular surgeons to consider treatment and therapies without understanding the cost factor.
However, I had a couple of concerns. I hope there is no Chief Financial Officer or Chief Executive Officer in the audience here. I would be concerned how they may hear your conclusion and be adversely influenced on their support to develop programs that embrace advanced technology.
I would like to suggest the way to look at this would be not to include cost of endograft alone but to see how the hospital makes revenue from the secondary aspects of an endograft. The patients go through many computed tomography scans and utilize so many other services and those could certainly very well make revenue for the hospitals.
My first question would be: When you analyzed the data, did you include the modifiers for comorbidities? If you use the modifier in ICD coding, as per my understanding, the DRG payments are likely to be better.
And the second question: If you think the cost of this is solely driven by endograft, would it be fair to say there is very little we can do as physicians?
Dr Stone. To your point about other aspects of EVAR that generate revenue for health systems (ie, the CAT scans and so forth), I think all politics is local. Where we practice medicine, a so-called model of destination care exists. Specifically, many of the EVARs that we perform are on patients who are seen and imaged at smaller surrounding hospitals. And likewise those follow-up computed tomography scans are often not performed at our own institution. And, thus, we provide the EVAR, but we do not derive any of the additional associated revenue you are alluding to. I think this is a trend that may be pervasive for other tertiary care referral centers around the country.
We did look at all of our EVARs. I do not think I could give you an exact number of the number of our cases in our study cohort who had modifiers attached to the DRG payment.
As to what we, physicians can do to address costs, I think that is the big question. I think there are potentially many things we can do at a microlevel, in our own respective environments. For instance, if you look at our total EVAR practice, we estimate that we can treat roughly 40% of our EVARs using any commercially available device interchangeably with no impact to our patients. Clearly, there is a cost implication of doing that and so we can impact practice in that capacity. Ultimately, we need to create an environment of cost transparency. If someone goes to buy a car, one knows what the “Kelley Blue Book value” of that car is when you are negotiating a price with your dealer. Thus far, that does not exist in our profession. From a hospital and surgeon standpoint, there is not a good reason why we cannot ultimately try to impact that.
Dr Pathanjali Sharma (Reading, Pa). Is your data granular enough to figure out what is the cost of the ancillary products that we use during endografting, such as balloons, catheters, sheaths, contralateral access, and extensions? Because that will substantially add to the cost as I understand it.
Dr Stone. You raise a good point. We did look at that. And again, that is part of the reason why we tried to start with a more simple case complexity patient cohort, where a lot of adjunctive supplies and so forth might confound cost analyses. When examined, different catheters, closure devices for percutaneous access, wires and so forth, even when considered in aggregate had a much smaller impact compared with the various stent graft implantables.
Dr Michael Conte (San Francisco, Calif). David, I think your paper is really important, particularly given that it is more than a decade since Dr Sternbergh's paper essentially showed similar things. And today, although the technology for EVAR has plateaued, we have not seen the reductions in costs or price that would normally be associated with the market evolution of a technology in that way.
I can assure you we have the same issue at our institution. And I just want to point out that you are looking at direct costs, but you did not even account for indirect costs such as keeping the lights on and the mortars and bricks for the institution. For every dollar in direct patient care costs at my hospital, it takes 60 cents to take out the garbage, keep the lights on, maintain the physical plant, etc. And so, when they look at profitability and add the additional indirect costs, it looks even worse for an EVAR case.
So I guess the point here is, is it not feasible that the vendor costs for these devices could come down by 20% or 25% in the environment where we now have five or six choices between endografts for AAA, which would really make the procedures almost revenue neutral?
My other question is: Did you look at patient factors such as anatomy, age, or other comorbidities that could affect either the revenue (ie, coding) or the cost side?
Dr Stone. To address the second point in your question first, we tried to anatomically derive a subset of patients, in whom we thought anatomy was consistent, which we felt would impact requisite devices and thus case-associated costs. We did not adjust for age. There may be some small disparities within that group in terms of comorbidity profile which we did not account for. But from a cost and anatomy standpoint, we thought this study group would be anatomically more homogeneous.
To your point about being more revenue neutral, I would agree, but add that our operating margins did include allocated costs and, thus, some institutional overhead costs. I would agree, however, that it is not unfeasible to aim for a 20% cost reduction to make this a more revenue neutral procedure.
I know our orthopedic colleagues have been successful in negotiating substantial reductions in price for their devices, moving to fewer vendors for joint replacement. Obviously, for reasons that are not equivalent, we are not willing to, at this point, go to an exclusive provider for numerous reasons.
Dr Fred Weaver (Los Angeles, Calif). Have you done, and maybe it is difficult in this endovascular era, but have you done a similar kind of analysis of open repair at Dartmouth?
Dr Stone. The answer is we have not. The main reason why we did not was because we believe that cost-effective analyses for EVAR have already been performed. Furthermore, and at this point, we believe irrespective of the cost profile of EVAR, EVAR is clearly here and here to stay in our respective practices. Therefore, it is not so much a matter of whether open is more cost-palatable but whether we can make EVAR more cost-effective.
Footnotes
Additional material for this article may be found online at www.jvascsurg.org.
The editors and reviewers of this article have no relevant financial relationships to disclose per the JVS policy that requires reviewers to decline review of any manuscript for which they may have a conflict of interest.
AUTHOR CONTRIBUTIONS
Conception and design: DS, AH, RP
Analysis and interpretation: DS, AH, PG, RP
Data collection: DS, AH
Writing the article: DS
Critical revision of the article: DS, AH, PG, ER, BN, RZ, DW, RP
Final approval of the article: DS
Statistical analysis: DS, AH
Obtained funding: Not applicable
Overall responsibility: DS
REFERENCES
- 1.Greenhalgh RM, Brown LC, Kwong GP, Powell JT, Thompson SG. Comparison of endovascular aneurysm repair with open repair inpatients with abdominal aortic aneurysm (EVAR trial 1), 30-dayoperative mortality results: randomised controlled trial. Lancet. 2004;364:843–848. doi: 10.1016/S0140-6736(04)16979-1. [DOI] [PubMed] [Google Scholar]
- 2.EVAR Trial Participants. Endovascular aneurysm repair and outcome in patients unfit for open repair of abdominal aortic aneurysm(EVAR trial 2): randomised controlled trial. Lancet. 2005;365:2187–2192. doi: 10.1016/S0140-6736(05)66628-7. [DOI] [PubMed] [Google Scholar]
- 3.Lee WA, Carter JW, Upchurch G, Seeger JM, Huber TS. Perioperative outcomes after open and endovascular repair of intact abdominal aortic aneurysms in the United States during 2001. J Vase Surg. 2004;39:491–496. doi: 10.1016/j.jvs.2003.12.001. [DOI] [PubMed] [Google Scholar]
- 4.Bertges DJ, Zwolak RM, Deaton DH, Teigen C, Tapper S, Koslow AR, et al. Current hospital costs and medicare reimbursement for endovascular abdominal aortic aneurysm repair. J Vase Surg. 2003;37:272–279. doi: 10.1067/mva.2003.118. [DOI] [PubMed] [Google Scholar]
- 5.Sternbergh WC, 3rd, Money SR. Hospital cost of endovascular versus open repair of abdominal aortic aneurysms: a multicenter study. J Vase Surg. 2000;31:237–244. doi: 10.1016/s0741-5214(00)90154-x. [DOI] [PubMed] [Google Scholar]
- 6.Kaplan RS, Porter ME. How to solve the cost crisis in health care. Harvard Bus Rev. 2011;89:46–52. 54, 56-61 passim. [PubMed] [Google Scholar]
- 7.Lester JS, Bosch JL, Kaufman JA, Halpern EF, Gazelle GS. Inpatient costs of routine endovascular repair of abdominal aortic aneurysm. Acad Radiol. 2001;8:639–646. doi: 10.1016/S1076-6332(03)80689-X. [DOI] [PubMed] [Google Scholar]
- 8.Holzenbein J, Kretschmer G, Glanzl R, Schon A, Thurnher S, Winkelbauer F, et al. Endovascular AAA treatment: expensive prestige or economic alternative? Eur J Vase Endovasc Surg. 1997;14:265–272. doi: 10.1016/s1078-5884(97)80238-9. [DOI] [PubMed] [Google Scholar]
- 9.Clair DG, Gray B, O'Hara PJ, Ouriel K. An evaluation of the costs to health care institutions of endovascular aortic aneurysm repair. J Vase Surg. 2000;32:148–152. doi: 10.1067/mva.2000.105663. [DOI] [PubMed] [Google Scholar]
- 10.Bosch JL, Lester JS, McMahon PM, Beinfeld MT, Halpern EF, Kaufman JA, et al. Hospital costs for elective endovascular and surgical repairs of infrarenal abdominal aortic aneurysms. Radiology. 2001;220:492–497. doi: 10.1148/radiology.220.2.r01au29492. [DOI] [PubMed] [Google Scholar]
- 11.Makaroun M, Zajko A, Orons P, Muluk S, Rhee R, Steed D, et al. The experience of an academic medical center with endovascular treatment of abdominal aortic aneurysms. Am J Surg. 1998;176:198–202. doi: 10.1016/s0002-9610(98)00123-8. [DOI] [PubMed] [Google Scholar]
- 12.Patel ST, Haser PB, Bush HL, Jr, Kent KC. The cost-effectiveness of endovascular repair versus open surgical repair of abdominal aortic aneurysms: a decision analysis model. J Vase Surg. 1999;29:958–972. doi: 10.1016/s0741-5214(99)70237-5. [DOI] [PubMed] [Google Scholar]
- 13.Quinones-Baldrich WJ, Garner C, Caswell D, Ahn SS, Gelabert HA, Machleder HI, et al. Endovascular, transperitoneal, and retroperitoneal abdominal aortic aneurysm repair: results and costs. J Vase Surg. 1999;30:59–67. doi: 10.1016/s0741-5214(99)70176-x. [DOI] [PubMed] [Google Scholar]
- 14.Seiwert AJ, Wolfe J, Whalen RC, Pigott JP, Kritpracha B, Beebe HG. Cost comparison of aortic aneurysm endograft exclusion versus open surgical repair. Am J Surg. 1999;178:117–120. doi: 10.1016/s0002-9610(99)00132-4. [DOI] [PubMed] [Google Scholar]
- 15.Moore WS, Kashyap VS, Vescera CL, Quiñones-Baldrich WJ. Abdominal aortic aneurysm: a 6-year comparison of endovascular versus transabdominal repair. Ann Surg. 1999;230:298–306. doi: 10.1097/00000658-199909000-00003. discussion: 306-8. [DOI] [PMC free article] [PubMed] [Google Scholar]
- 16.Birch SE, Stary DR, Scott AR. Cost of endovascular versus open surgical repair of abdominal aortic aneurysms. Aust N Z J Surg. 2000;70:660–666. doi: 10.1046/j.1440-1622.2000.01921.x. [DOI] [PubMed] [Google Scholar]
- 17.Medicare Hospital Inparient Prospective Payment System. Available at: http://cms.hhs.gov/medicare/ippsmain.asp.
Associated Data
This section collects any data citations, data availability statements, or supplementary materials included in this article.


