

Abstract
Purpose
Chronic obstructive pulmonary disease (COPD) is predicted to become the third most common cause of death and the fifth most common cause of disability in the world by 2020. Recently, variants in the hypoxia-inducible factor 1α (HIF1A), cholinergic receptor, neuronal nicotinic, alpha polypeptide-5, and iron-responsive element-binding protein 2 gene (IREB2) genes were found to be associated with COPD. This study aims to identify whether the variations in these genes are related to COPD in the Hainan population of the People’s Republic of China.
Patients and methods
We genotyped 12 single nucleotide polymorphisms in a case-control study with 200 COPD cases and 401 controls from Hainan, People’s Republic of China. Odds ratios and 95% confidence intervals were estimated using the chi-squared (χ2) test, genetic model analysis, haplotype analysis, and stratification analysis.
Results
In the genetic model analysis, we found that the genotype T/T of rs13180 of IREB2 decreased the COPD risk by 0.52-fold (P=0.025). But in the further stratification analysis, we failed to find the association between the selected single nucleotide polymorphisms with COPD risk in Han population. In addition, the haplotype analysis of HIF1A gene also was not found to be the possible haplotype associated with COPD risk.
Conclusion
Our results support that IREB2 rs13180 is associated with COPD in Hainan population. And this is the first time the HIF1A polymorphisms in COPD in a Chinese population has been reported, although we failed to find any significant result.
Keywords: single nucleotide polymorphism (SNP), IREB2, HIF1A
Introduction
Chronic obstructive pulmonary disease (COPD) is a genetically complex human disease that is characterized by a reduction in lung function with airflow obstruction that is not fully reversible.1 Although cigarette smoking is the most significant risk factor of COPD, cigarette smoking differentially affects lung function decline, and not all smokers will develop COPD.2 The individual response to cigarette smoke and other environmental factors is affected in part by genetic factors, and the development of COPD is the culmination of the environment acting in concert with a complex array of genetic traits.3
Recently, genome-wide association studies revealed statistically significant associations between COPD and several gene variants, including the iron-responsive element-binding protein 2 (IREB2) and cholinergic receptor, neuronal nicotinic, alpha polypeptide-5 (CHRNA5).4–6 As we know, chronic hypoxia is a common feature of COPD. Physiological responses to chronic hypoxia result from altered patterns of gene expression. An essential regulator of the response to decreased O2 is hypoxia inducible factor-1 (HIF-1).7 The HIF-1β subunit is constitutively expressed, whereas the HIF-1α subunit is subject to ubiquitination and proteasomal degradation, a process that is inhibited under hypoxic conditions.8 Recent data indicate that HIF-1α plays a major role in some cancers.9–13 But the association of HIF1A genetic polymorphisms with COPD risk is not clear.
It has been reported that susceptibility to COPD is not dependent on a single gene and is affected by population differences. So we chose 12 high-frequency single nucleotide polymorphisms (SNPs) in a Chinese population of the three candidate genes (IREB2, CHRNA5, and HIF1A) to study the association with COPD risk.
The previous gene studies of the Chinese population had focused solely on the Han population. However, Hainan is a multi-ethnic mix province, while Han and Li are the two main ethnic populations. And the incidence of COPD in the Hainan population is higher than other regions of the People’s Republic of China. To examine whether the variants contribute to COPD risk, the Han and Li mixed population of Hainan, People’s Republic of China was studied. We selected 12 SNPs for a case-control study in this population.
Patients and methods
Study participants
All patients and controls were members of Hainan province, seen between January 2010 and February 2013 at the Hainan Provincial People’s Hospital. COPD was newly diagnosed according to the criteria established by the National Heart, Lung and Blood Institute/World Health Organization Global Initiative for Chronic Obstructive Lung Disease (GOLD).1 None of the patients had a previous history of other cancers, chemotherapy, or radiotherapy. Participants were chosen without restrictions of age, sex, or disease stage. Among control individuals, none had any chronic or severe endocrinological, metabolic, or nutritional diseases. A total of 200 cases and 401 controls were included in the study. Basic characteristics of the participants, eg, sex, age, smoking status, nationality, body mass index, and forced expiratory volume in 1 second (FEV1)/forced volume capacity, are listed in Table 1.
Table 1.
General characteristics of the study population
| Variables | Case N (%) | Control N (%) | P-value |
|---|---|---|---|
| Age (years) | 71.7±10.4 | 48.6±13.3 | P<0.001a |
| Sex | P=0.935b | ||
| Male | 142 (71.0%) | 286 (71.3%) | |
| Female | 58 (29.0%) | 115 (28.7%) | |
| Nationality | P=0.889b | ||
| Han | 166 (83%) | 311 (82.5%) | |
| Li | 34 (17%) | 70 (17.5%) | |
| Smoking status | P=0.889b | ||
| Smoking | 97 (48.5%) | 191 (47.6%) | |
| Non-smoking | 103 (51.5%) | 210 (52.4%) | |
| BMI, kg/m2 | 20.03 (±3.06) | 21.06 (±3.41) | P=0.054a |
| FEV1/FVC | 0.62 (±0.06) | 0.80 (±0.02) | |
| Total | 200 | 401 |
Notes:
P-values were calculated by Student’s t-tests;
P-values were calculated from two-sided chi-square tests.
Abbreviations: BMI, body mass index; FEV1, forced expiratory volume in 1 second; FVC, forced volume capacity.
Clinical data and demographic information
We used a standard epidemiological questionnaire and in-person interview to collect personal data, including residential regions, age, nationality, smoking status, sex, education status, and family history of cancer. The case information was collected through consultation with treating physicians or from medical chart review. All of the participants signed an informed consent agreement. The Human Research Committee for Approval of Research Involving Human Subjects, Hainan Provincial People’s Hospital, approved the use of human tissue in this study.
Selection of SNPs and methods of genotyping
Some of the 12 selected SNPs had been previously reported to be associated with COPD, others were randomly chosen from HIF1A gene. Minor allele frequencies of all SNPs were >5%, in the HapMap of the Chinese Han Beijing population. Extraction of DNA from whole-blood samples was done with GoldMag-Mini Whole Blood Genomic DNA Purification Kits (GoldMag Co, Ltd, Hainan City, People’s Republic of China), and DNA concentration was measured with a NanoDrop 2000 spectrophotometer (Thermo Fisher Scientific, Waltham, MA, USA). The multiplexed SNP Mas-sEXTENDED assay was designed using Sequenom MassAR-RAY Assay Design 3.0 software (Sequenom Inc., San Diego, CA, USA).14 Genotyping was done with the Sequenom MassARRAY RS1000 system using the standard protocol recommended by the manufacturer. Data management and analysis was done using Sequenom Typer 4.0 software.14,15
Statistical analysis
The SPSS 18.0 statistical software (SPSS Inc., Chicago, IL, USA) and Microsoft Excel (Microsoft Corporation, Redmond, WA, USA) were used for statistical analysis. In all analyses, the lower frequency allele was coded as the “risk” allele. All P-values presented in this study were two sided, and we used P≤0.05 as the cutoff value for statistical significance. An exact test was used to assess the variation in each SNP frequency from Hardy–Weinberg equilibrium in the control subjects. Differences in SNP genotype distribution between cases and controls were compared by χ2 test.16 Odds ratios (ORs) and 95% confidence intervals (CIs) were determined using unconditional logistic regression analysis with adjustments for age, sex, and smoking status.17
Associations between SNPs and risk of COPD were tested in genetic models by analysis with SNP Stats software, obtained from http://bioinfo.iconcologia.net (Catalan Institute of Oncology, Barcelona, Spain). For the additive model, individuals were assigned a 0, 1, or 2 representing the number of risk alleles they possessed for that SNP. For the dominant model, individuals were coded as 1 if they carried at least one risk allele and 0 otherwise; for the recessive model, individuals were coded as 1 if they were homozygous for the risk allele (two copies) and 0 otherwise. Values of OR and 95% CI were calculated as above. Akaike’s Information Criterion and Bayesian Information Criterion were applied to estimate the best-fit model for each SNP.
We use the Haploview software version 4.2 (Dr Mark Daly’s laboratory, Massachusetts Institute of Technology/Harvard Broad Institute, Cambridge, MA, USA) to analyze the association between haplotypes and COPD. Linkage disequilibrium (LD) analysis was performed using genotype data from all the subjects. The pattern of LD was analyzed using two parameters, r2 and D0. Statistical significance was established when P<0.05.
Results
A total of 601 participants, including 200 COPD cases and 401 controls were successfully genotyped for further analysis (Table 1). Males represented 71% of the cases and 71.3% of the controls. More males than females participated in this study. However, sex was equally distributed among COPD cases and control subjects. Cases on average were older than control subjects (aged 71.7 years versus 48.6 years, P<0.001) and showed a lower body mass index (20.23 kg/m2 versus 21.06 kg/m2, P.0.05). Because of the study design, the COPD cases had worse pulmonary function (FEV1/forced volume capacity ratio) than control subjects. This study included two nationalities, because Han and Li were two major nationalities in Hainan. More Han than Li people participated in this study, but they were proportionately mixed. More non-smokers were observed compared with smokers (P=0.889), but there was no significant difference in distribution of smoking status.
A total of ten SNPs in the HIFIA gene, one SNP in the IREB2 gene, and one SNP in the CHRNA5 gene was genotyped in COPD patients and the healthy controls. The average SNPs call rate was 98.5% in cases and controls. Table 2 summarizes the basic characteristics of the SNPs in the study population. Rs10873142 was excluded at 5% Hardy–Weinberg equilibrium P-value. We compared the differences in frequency distributions of alleles between cases and controls by χ2 test and did not find that any SNP was significantly associated with COPD risk in the study population.
Table 2.
Allele frequencies in cases and controls and odds ratio estimates for COPD
| SNP ID | Gene (s) | Band | Position | Alleles
|
MAF
|
HWE P-value |
ORs | 95% CI | Allele P-value |
|
|---|---|---|---|---|---|---|---|---|---|---|
| Aa/B | Case | Control | ||||||||
| rs2301104 | HIF1A | 14q23.2 | 62165028 | C/G | 0.095 | 0.105 | 1.000 | 0.897 | 0.599–1.343 | 0.598 |
| rs7143164 | HIF1A | 14q23.2 | 62166755 | C/G | 0.150 | 0.136 | 1.000 | 1.122 | 0.798–1.577 | 0.508 |
| rs10129270 | HIF1A | 14q23.2 | 62181954 | A/G | 0.145 | 0.126 | 0.655 | 1.174 | 0.829–1.662 | 0.366 |
| rs8005745 | HIF1A | 14q23.2 | 62185295 | T/A | 0.153 | 0.138 | 0.835 | 1.120 | 0.799–1.571 | 0.511 |
| rs4899056 | HIF1A | 14q23.2 | 62189531 | T/C | 0.158 | 0.140 | 0.838 | 1.152 | 0.824–1.610 | 0.408 |
| rs966824 | HIF1A | 14q23.2 | 62200518 | T/C | 0.115 | 0.125 | 0.368 | 0.910 | 0.627–1.319 | 0.617 |
| rs10873142 | HIF1A | 14q23.2 | 62203462 | C/T | 0.418 | 0.348 | 0.000# | 1.344 | 1.050–1.719 | 0.019* |
| rs2301112 | HIF1A | 14q23.2 | 62206173 | C/A | 0.015 | 0.021 | 1.000 | 0.703 | 0.275–1.798 | 0.460 |
| rs2301113 | HIF1A | 14q23.2 | 62206548 | C/A | 0.287 | 0.282 | 0.319 | 1.026 | 0.783–1.342 | 0.854 |
| rs4902080 | HIF1A | 14q23.2 | 62208005 | T/C | 0.113 | 0.118 | 0.809 | 0.957 | 0.656–1.397 | 0.821 |
| rs13180 | IREB2 | 15q25.1 | 78789488 | T/C | 0.485 | 0.504 | 0.616 | 0.928 | 0729–1.180 | 0.540 |
| rs66728 | CHRNA5 | 15q25.1 | 78863472 | C/T | 0.443 | 0.430 | 1.000 | 1.051 | 0.862–1.339 | 0.685 |
Notes:
Minor allele;
P-value ≤0.05 indicates statistical significance;
site with HWE P≤0.05 is excluded.
Abbreviations: COPD, chronic obstructive pulmonary disease; HWE, Hardy–Weinberg equilibrium; MAF, minor allele frequency; ORs, odds ratios; CI, confidence interval; SNP, single nucleotide polymorphism; CHRNA5, cholinergic receptor, neuronal nicotinic, alpha polypeptide-5; HIF1A, hypoxia-inducible factor 1α; IREB2, iron-responsive element-binding protein 2 gene.
Besides the allelic model analysis, we also assessed the association between this SNP and COPD risks using genetic models. The results showed that the genotype “T/T” of rs13180 significantly decreased the risk of COPD in a recessive model (OR=0.52; 95% CI, 0.29–0.93, P=0.025) (Table 3).
Table 3.
Logistic regression analysis of the association between IREB2 rs13180 and COPD risk
| SNP | Model | Genotype | Control | Case | ORa (95% CI) | P-value | AIC | BIC |
|---|---|---|---|---|---|---|---|---|
| rs13180 | Co-dominant | C/C | 99 (25.1%) | 48 (25.5%) | 1.00 | 0.082 | 425.7 | 451.9 |
| T/C | 192 (48.7%) | 93 (49.5%) | 0.99 (0.55–1.78) | |||||
| T/T | 103 (26.1%) | 47 (25%) | 0.52 (0.26–1.04) | |||||
| Dominant | C/C | 99 (25.1%) | 48 (25.5%) | 1.00 | 0.43 | 428.1 | 449.9 | |
| T/C-T/T | 295 (74.9%) | 140 (74.5%) | 0.80 (0.46–1.39) | |||||
| Recessive | C/C-T/C | 291 (73.9%) | 141 (75%) | 1.00 | 0.025* | 423.7 | 445.6 | |
| T/T | 103 (26.1%) | 47 (25%) | 0.52 (0.29–0.93) | |||||
| Over-dominant | C/C-T/T | 202 (51.3%) | 95 (50.5%) | 1.00 | 0.21 | 427.2 | 449 | |
| T/C | 192 (48.7%) | 93 (49.5%) | 1.36 (0.84–2.22) | |||||
| Log-additive | – | – | – | 0.72 (0.51–1.02) | 0.065 | 425.3 | 447.2 |
Note:
Adjusted for sex, age, and smoking status.
P-value ≤0.05 indicates statistical significance.
Abbreviations: AIC, Akaike’s Information Criterion; BIC, Bayesian Information Criterion; IREB2, iron-responsive element-binding protein 2 gene; COPD, chronic obstructive pulmonary disease; SNP, single nucleotide polymorphism; OR, odds ratio; CI, confidence interval.
Pairwise LD analysis was performed for the HIF1A gene using the polymorphisms detected in this study. The pattern of LD was analyzed using two parameters, r2 and D0. One main linkage block was observed across the locus (Figure 1). This block was constituted by seven closely linked SNPs: rs230114, rs714216, rs10129270, rs8005745, rs4899056, rs966834, and rs230113. Then, the association between inferred haplotypes and COPD risk among the individuals was analyzed. But we failed to find the association between the haplotypes and COPD risk (Table S1).
Figure 1.
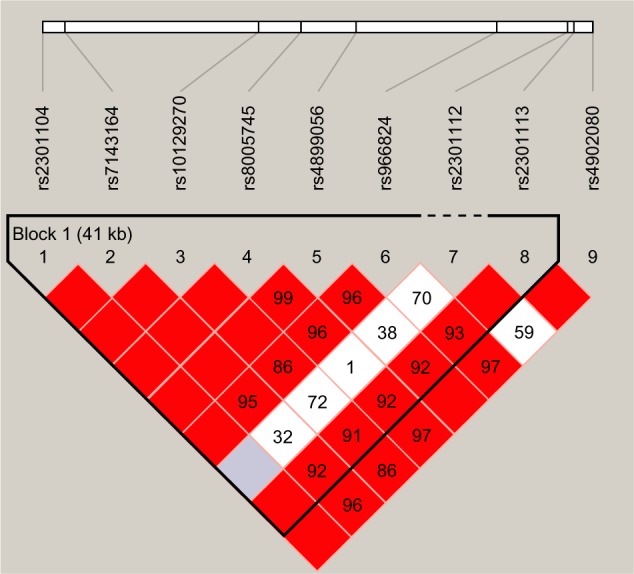
Linkage disequilibrium of polymorphic sites in the HIF1A gene.
Notes: A standard color scheme is used to display LD with bright red for very strong LD (LOD =2, D′=1), white for no LD (LOD <2, D′<1), pink red (LOD =2, D′<1), and blue (LOD <2, D′=1) for intermediate LD.
Abbreviations: HIF1A, hypoxia-inducible factor 1α; LD, linkage disequilibrium; LOD, likelihood of odds.
The association of the genetic polymorphisms and COPD risk was further analyzed among Han populations. However, none of these polymorphisms were associated with COPD in the Han population allele model analysis (Table S2).
Discussion
It has been suggested that several genetic polymorphisms are associated with susceptibility to COPD. Whereas each polymorphism may contribute to only a small relative risk of COPD, a combination of several responsible polymorphisms and environmental factors may be important. It is well-known that allele frequencies vary among different ethnic groups. Our study has focused on the association of several candidate genetic polymorphisms, especially function-related HIF1A polymorphisms, with the susceptibility of COPD in Hainan population. However, none of the HIF1A gene variants were correlated with COPD risk. Only rs13180 of IREB2 showed a significant association with decreased risk of COPD in a recessive model. The results suggest that the variants may play an important role in the risk of COPD in Hainan individuals.
IREB2 is located on a region of chromosome 15q25 that is particularly compelling for investigating the genetic components of COPD. This region contains a number of genes with biological plausibility for a role in the development of COPD. The iron-response protein (IRP)2 encoded by this gene, together with IRP1, is involved in iron metabolism and the response to hypoxemia, and has been demonstrated to affect mitochondrial iron stores.18–20 In the setting of systemic iron depletion, IRPs decrease iron storage and increase iron uptake.21 Hypoxemia is a common occurrence in COPD. Important features of IREB2 are that it is suggested to be active at lower oxygen tensions22 and has been observed to be post-translationally regulated by hypoxia.23 A previous publication has shown increased levels of IREB2 messenger ribonucleic acid, as protein, in COPD patients versus controls.5 Iron homeostasis and free iron concentration are likely to be important mediators of oxidative stress and iron could therefore contribute to local damage by this mechanism.
In a study of Poles, IREB2 rs13180 was found to be associated with decreased COPD risk.24 The other study in Chinese Han population found that rs13180 was not associated with COPD risk in either former smokers or current smokers, but associated with FEV1% predicted.25 Consistent with the previous studies, our study confirmed that rs13180 was associated with decreased COPD risk in Hainan population, but not in Han population. It could be hypothesized that the protective effect may be because the genotype T/T decreases the IREB2 messenger ribonucleic acid expression level and reduces the oxygen consumption in the lungs; and in somehow increasing the expiratory volume, it thereby reduces pulmonary hypoxemia. However, the detailed mechanisms of function of this polymorphism need to be investigated in future studies.
HIF1A expression, induced as a result of intratumoral hypoxia and genetic alterations that inactivate tumor suppressor genes or activate oncogenes, plays a critical role in this process.26 In the present study, we found that none of the HIF1A gene variants correlated with COPD risk. Type II statistical error may have affected the results because of the small sample size. However, these results may suggest that the functionally activated HIF1A polymorphisms are not associated with COPD risk in a Hainan population of the People’s Republic of China.
Despite the current study possessing enough power, some limitations should be considered. As we know, COPD is a very heterogeneous disease and smoking is an important environmental risk factor for COPD. Because the sample size of our study was relatively small, we could not explore how genetic polymorphisms play a role in the Li population or subtype. So the association between this polymorphism and smoking status, nationality, and clinical subtype need to be evaluated in future studies.
Conclusion
Our study has described the association between rs13180 (IREB2) and COPD risk in a group composed of Hainan individuals of southern China for the first time. Although we do not find any significant results, this is the first report on the association between HIF1A polymorphisms and COPD in Chinese.
Supplementary materials
Table S1.
Haplotypes of HIF1A and their association with COPD risk
| Haplotype | Freq | ORa (95% CI) | P-valuea | |
|---|---|---|---|---|
| Block | GGGACCA | 0.6148 | 1.00 | – |
| GGGACCC | 0.1409 | 0.93 (0.55–1.58) | 0.79 | |
| GCATTTC | 0.0994 | 1.09 (0.62–1.93) | 0.76 | |
| CGGACCA | 0.0977 | 0.74 (0.39–1.37) | 0.34 | |
| GCATTCC | 0.0212 | 1.42 (0.46–4.44) | 0.54 | |
| *******b | 0.0259 | 0.74 (0.21–2.68) | 0.65 | |
| Total | GGGACCAAC | 0.6162 | 1.00 | – |
| GGGACCACC | 0.1221 | 1.06 (0.52–2.14) | 0.88 | |
| GCATTTACT | 0.0997 | 1.28 (0.66–2.49) | 0.46 | |
| CGGACCAAC | 0.0977 | 0.80 (0.39–1.63) | 0.54 | |
| GCATTCACC | 0.0212 | 2.12 (0.55–8.19) | 0.28 | |
| GGGACCCCC | 0.0175 | 0.53 (0.08–3.49) | 0.51 | |
| *********b | 0.0256 | 0.92 (0.21–4.15) | 0.92 |
Notes: P-value ≤0.05 indicates statistical significance;
adjusted for sex, age, smoking status.
is on behalf of the other arrangement of these single nucleotide polymorphisms.
Abbreviations: COPD, chronic obstructive pulmonary disease; Freq, frequency; HIF1A, hypoxia-inducible factor 1α; OR, odds ratio; CI, confidence interval.
Table S2.
Allele frequencies in cases and controls and odds ratio estimates for COPD in Han population
| SNP ID | Gene (s) | Band | Position | Alleles
|
MAF
|
HWE P-value |
ORs | 95% CI | Allele P-value |
|
|---|---|---|---|---|---|---|---|---|---|---|
| Aa/B | Case | Control | ||||||||
| rs2301104 | HIF1A | 14q23.2 | 62165028 | C/G | 0.103 | 0.108 | 1.000 | 0.953 | 0.619–1.468 | 0.8267 |
| rs7143164 | HIF1A | 14q23.2 | 62166755 | C/G | 0.166 | 0.142 | 1.000 | 1.200 | 0.835–1.724 | 0.3242 |
| rs10129270 | HIF1A | 14q23.2 | 62181954 | A/G | 0.160 | 0.130 | 0.626 | 1.268 | 0.875–1.837 | 0.2091 |
| rs8005745 | HIF1A | 14q23.2 | 62185295 | T/A | 0.169 | 0.145 | 1.000 | 1.196 | 0.835–1.714 | 0.3283 |
| rs4899056 | HIF1A | 14q23.2 | 62189531 | T/C | 0.171 | 0.146 | 0.826 | 1.207 | 0.844–1.726 | 0.3011 |
| rs966824 | HIF1A | 14q23.2 | 62200518 | T/C | 0.132 | 0.142 | 0.503 | 0.920 | 0.626–1.352 | 0.6709 |
| rs10873142 | HIF1A | 14q23.2 | 62203462 | C/T | 0.431 | 0.369 | 0.000# | 1.296 | 0.991–1.695 | 0.0580 |
| rs2301112 | HIF1A | 14q23.2 | 62206173 | C/A | 0.018 | 0.024 | 1.000 | 0.743 | 0.288–1.917 | 0.5377 |
| rs2301113 | HIF1A | 14q23.2 | 62206548 | C/A | 0.299 | 0.292 | 0.893 | 1.036 | 0.774–1.388 | 0.8102 |
| rs4902080 | HIF1A | 14q23.2 | 62208005 | T/C | 0.129 | 0.133 | 1.000 | 0.967 | 0.654–1.430 | 0.8670 |
| rs13180 | IREB2 | 15q25.1 | 78789488 | T/C | 0.464 | 0.489 | 0.912 | 0.903 | 0.693–1.176 | 0.4482 |
| rs66728 | CHRNA5 | 15q25.1 | 78863472 | C/T | 0.446 | 0.447 | 0.658 | 0.995 | 0.763–1.297 | 0.9679 |
Notes:
Minor allele;
site with HWE P-value ≤0.05 is excluded.
Abbreviations: HWE, Hardy–Weinberg equilibrium; MAF, minor allele frequency; ORs, odds ratios; CI, confidence interval; SNP, single nucleotide polymorphism; COPD, chronic obstructive pulmonary disease; CHRNA5, cholinergic receptor, neuronal nicotinic, alpha polypeptide-5; HIF1A, hypoxia-inducible factor 1α; IREB2, iron-responsive element-binding protein 2 gene.
Acknowledgments
This work was supported by the National Natural Science Foundation of China (No 81160008). We are grateful to all patients and individuals who participated in the study. We would also like to thank clinicians and other hospital staff who helped us to collect blood samples and data.
Footnotes
Disclosure
The authors report no conflicts of interest in this work. We declare that we have no financial and personal relationships with other people or organizations that can inappropriately influence our work, there is no professional or other personal interest of any nature or kind in any product, service, and/or company that could be construed as influencing the position presented in, or the review of, the manuscript entitled.
References
- 1.Rabe KF, Hurd S, Anzueto A, et al. Global strategy for the diagnosis, management, and prevention of chronic obstructive pulmonary disease: GOLD executive summary. Am J Respir Crit Care Med. 2007;176(6):532–555. doi: 10.1164/rccm.200703-456SO. [DOI] [PubMed] [Google Scholar]
- 2.Wan ES, Silverman EK. Genetics of COPD and emphysema. Chest. 2009;136(3):859–866. doi: 10.1378/chest.09-0555. [DOI] [PubMed] [Google Scholar]
- 3.Silverman EK, Vestbo J, Agusti A, et al. Opportunities and challenges in the genetics of COPD 2010: an International COPD Genetics Conference report. COPD. 2011;8(2):121–135. doi: 10.3109/15412555.2011.558864. [DOI] [PMC free article] [PubMed] [Google Scholar]
- 4.Nakamura H. Genetics of COPD. Allergol Int. 2011;60(3):253–258. doi: 10.2332/allergolint.11-RAI-0326. [DOI] [PubMed] [Google Scholar]
- 5.DeMeo DL, Mariani T, Bhattacharya S, et al. Integration of genomic and genetic approaches implicates IREB2 as a COPD susceptibility gene. Am J Hum Genet. 2009;85(4):493–502. doi: 10.1016/j.ajhg.2009.09.004. [DOI] [PMC free article] [PubMed] [Google Scholar]
- 6.Pillai SG, Ge D, Zhu G, et al. A genome-wide association study in chronic obstructive pulmonary disease (COPD): identification of two major susceptibility loci. PloS Genet. 2009;5(3):e1000421. doi: 10.1371/journal.pgen.1000421. [DOI] [PMC free article] [PubMed] [Google Scholar]
- 7.Shimoda LA, Semenza GL. HIF and the lung: role of hypoxia-inducible factors in pulmonary development and disease. Am J Respir Crit Care Med. 2011;183(2):152–156. doi: 10.1164/rccm.201009-1393PP. [DOI] [PMC free article] [PubMed] [Google Scholar]
- 8.Semenza GL. Hypoxia-inducible factor 1: regulator of mitochondrial metabolism and mediator of ischemic preconditioning. Biochim Biophys Acta. 2011;1813(7):1263–1268. doi: 10.1016/j.bbamcr.2010.08.006. [DOI] [PMC free article] [PubMed] [Google Scholar]
- 9.Baba Y, Nosho K, Shima K, et al. HIF1A overexpression is associated with poor prognosis in a cohort of 731 colorectal cancers. Am J Pathol. 2010;176(5):2292–2301. doi: 10.2353/ajpath.2010.090972. [DOI] [PMC free article] [PubMed] [Google Scholar]
- 10.Koukourakis MI, Giatromanolaki A, Skarlatos J, et al. Hypoxia inducible factor (HIF-1a and HIF-2a) expression in early esophageal cancer and response to photodynamic therapy and radiotherapy. Cancer Res. 2001;61(5):1830–1832. [PubMed] [Google Scholar]
- 11.Lisanti MP, Sotgia F. Autophagy drives compartment-specific oncogenesis: HIF1-alpha functions as a tumor promoter in cancer associated fibroblasts, and as a tumor suppressor in breast cancer cells. FASEB J. 2011;25:359.9. doi: 10.4161/cc.9.17.12908. [DOI] [PMC free article] [PubMed] [Google Scholar]
- 12.Li D, Liu J, Zhang W, et al. Association between HIF1A P582S and A588T polymorphisms and the risk of urinary cancers: a meta-analysis. PloS One. 2013;8(5):e63445. doi: 10.1371/journal.pone.0063445. [DOI] [PMC free article] [PubMed] [Google Scholar]
- 13.Pesch B, Casjens S, Stricker I, et al. NOTCH1, HIF1A and other cancer-related proteins in lung tissue from uranium miners – variation by occupational exposure and subtype of lung cancer. PloS One. 2012;7(9):e45305. doi: 10.1371/journal.pone.0045305. [DOI] [PMC free article] [PubMed] [Google Scholar]
- 14.Gabriel S, Ziaugra L, Tabbaa D. SNP genotyping using the Seque-nom MassARRAY iPLEX platform. Curr Protoc Hum Genet. 2009 doi: 10.1002/0471142905.hg0212s60. Chapter 2: Unit 2.12. [DOI] [PubMed] [Google Scholar]
- 15.Thomas RK, Baker AC, DeBiasi RM, et al. High-throughput oncogene mutation profiling in human cancer. Nat Genet. 2007;39(3):347–351. doi: 10.1038/ng1975. [DOI] [PubMed] [Google Scholar]
- 16.Adamec C. Example of the use of the nonparametric test. Test X2 for comparison of 2 independent examples. Cesk Zdrav. 1964;12:613–619. Czech. [PubMed] [Google Scholar]
- 17.Bland JM, Altman DG. Statistics notes: the odds ratio. BMJ. 2000;320(7247):1468. doi: 10.1136/bmj.320.7247.1468. [DOI] [PMC free article] [PubMed] [Google Scholar]
- 18.LaVaute T, Smith S, Cooperman S, et al. Targeted deletion of the gene encoding iron regulatory protein-2 causes misregulation of iron metabolism and neurodegenerative disease in mice. Nat Genet. 2001;27(2):209–214. doi: 10.1038/84859. [DOI] [PubMed] [Google Scholar]
- 19.Leipuviene R, Theil EC. The family of iron responsive RNA structures regulated by changes in cellular iron and oxygen. Cell Mol Life Sci. 2007;64(22):2945–2855. doi: 10.1007/s00018-007-7198-4. [DOI] [PMC free article] [PubMed] [Google Scholar]
- 20.Galy B, Ferring-Appel D, Sauer SW, et al. Iron regulatory proteins secure mitochondrial iron sufficiency and function. Cell Metab. 2010;12(2):194–201. doi: 10.1016/j.cmet.2010.06.007. [DOI] [PubMed] [Google Scholar]
- 21.Rouault T, Klausner R. Regulation of iron metabolism in eukaryotes. Curr Top Cell Regul. 1996;35:1–19. doi: 10.1016/s0070-2137(97)80001-5. [DOI] [PubMed] [Google Scholar]
- 22.Rouault TA. The role of iron regulatory proteins in mammalian iron homeostasis and disease. Nat Chem Biol. 2006;2(8):406–414. doi: 10.1038/nchembio807. [DOI] [PubMed] [Google Scholar]
- 23.Hanson ES, Foot LM, Leibold EA. Hypoxia post-translationally activates iron-regulatory protein 2. J Biol Chem. 1999;274(8):5047–5052. doi: 10.1074/jbc.274.8.5047. [DOI] [PubMed] [Google Scholar]
- 24.Hardin M, Zielinski J, Wan ES, et al. CHRNA3/5, IREB2, and ADCY2 are associated with severe chronic obstructive pulmonary disease in Poland. Am J Respir Cell Mol Biol. 2012;47(2):203–208. doi: 10.1165/rcmb.2012-0011OC. [DOI] [PMC free article] [PubMed] [Google Scholar]
- 25.Zhou H, Yang J, Li D, et al. Association of IREB2 and CHRNA3/5 polymorphisms with COPD and COPD-related phenotypes in a Chinese Han population. J Hum Genet. 2012;57(11):738–746. doi: 10.1038/jhg.2012.104. [DOI] [PubMed] [Google Scholar]
- 26.Semenza GL. HIF-1: upstream and downstream of cancer metabolism. Curr Opin Genet Dev. 2010;20(1):51–56. doi: 10.1016/j.gde.2009.10.009. [DOI] [PMC free article] [PubMed] [Google Scholar]
Associated Data
This section collects any data citations, data availability statements, or supplementary materials included in this article.
Supplementary Materials
Table S1.
Haplotypes of HIF1A and their association with COPD risk
| Haplotype | Freq | ORa (95% CI) | P-valuea | |
|---|---|---|---|---|
| Block | GGGACCA | 0.6148 | 1.00 | – |
| GGGACCC | 0.1409 | 0.93 (0.55–1.58) | 0.79 | |
| GCATTTC | 0.0994 | 1.09 (0.62–1.93) | 0.76 | |
| CGGACCA | 0.0977 | 0.74 (0.39–1.37) | 0.34 | |
| GCATTCC | 0.0212 | 1.42 (0.46–4.44) | 0.54 | |
| *******b | 0.0259 | 0.74 (0.21–2.68) | 0.65 | |
| Total | GGGACCAAC | 0.6162 | 1.00 | – |
| GGGACCACC | 0.1221 | 1.06 (0.52–2.14) | 0.88 | |
| GCATTTACT | 0.0997 | 1.28 (0.66–2.49) | 0.46 | |
| CGGACCAAC | 0.0977 | 0.80 (0.39–1.63) | 0.54 | |
| GCATTCACC | 0.0212 | 2.12 (0.55–8.19) | 0.28 | |
| GGGACCCCC | 0.0175 | 0.53 (0.08–3.49) | 0.51 | |
| *********b | 0.0256 | 0.92 (0.21–4.15) | 0.92 |
Notes: P-value ≤0.05 indicates statistical significance;
adjusted for sex, age, smoking status.
is on behalf of the other arrangement of these single nucleotide polymorphisms.
Abbreviations: COPD, chronic obstructive pulmonary disease; Freq, frequency; HIF1A, hypoxia-inducible factor 1α; OR, odds ratio; CI, confidence interval.
Table S2.
Allele frequencies in cases and controls and odds ratio estimates for COPD in Han population
| SNP ID | Gene (s) | Band | Position | Alleles
|
MAF
|
HWE P-value |
ORs | 95% CI | Allele P-value |
|
|---|---|---|---|---|---|---|---|---|---|---|
| Aa/B | Case | Control | ||||||||
| rs2301104 | HIF1A | 14q23.2 | 62165028 | C/G | 0.103 | 0.108 | 1.000 | 0.953 | 0.619–1.468 | 0.8267 |
| rs7143164 | HIF1A | 14q23.2 | 62166755 | C/G | 0.166 | 0.142 | 1.000 | 1.200 | 0.835–1.724 | 0.3242 |
| rs10129270 | HIF1A | 14q23.2 | 62181954 | A/G | 0.160 | 0.130 | 0.626 | 1.268 | 0.875–1.837 | 0.2091 |
| rs8005745 | HIF1A | 14q23.2 | 62185295 | T/A | 0.169 | 0.145 | 1.000 | 1.196 | 0.835–1.714 | 0.3283 |
| rs4899056 | HIF1A | 14q23.2 | 62189531 | T/C | 0.171 | 0.146 | 0.826 | 1.207 | 0.844–1.726 | 0.3011 |
| rs966824 | HIF1A | 14q23.2 | 62200518 | T/C | 0.132 | 0.142 | 0.503 | 0.920 | 0.626–1.352 | 0.6709 |
| rs10873142 | HIF1A | 14q23.2 | 62203462 | C/T | 0.431 | 0.369 | 0.000# | 1.296 | 0.991–1.695 | 0.0580 |
| rs2301112 | HIF1A | 14q23.2 | 62206173 | C/A | 0.018 | 0.024 | 1.000 | 0.743 | 0.288–1.917 | 0.5377 |
| rs2301113 | HIF1A | 14q23.2 | 62206548 | C/A | 0.299 | 0.292 | 0.893 | 1.036 | 0.774–1.388 | 0.8102 |
| rs4902080 | HIF1A | 14q23.2 | 62208005 | T/C | 0.129 | 0.133 | 1.000 | 0.967 | 0.654–1.430 | 0.8670 |
| rs13180 | IREB2 | 15q25.1 | 78789488 | T/C | 0.464 | 0.489 | 0.912 | 0.903 | 0.693–1.176 | 0.4482 |
| rs66728 | CHRNA5 | 15q25.1 | 78863472 | C/T | 0.446 | 0.447 | 0.658 | 0.995 | 0.763–1.297 | 0.9679 |
Notes:
Minor allele;
site with HWE P-value ≤0.05 is excluded.
Abbreviations: HWE, Hardy–Weinberg equilibrium; MAF, minor allele frequency; ORs, odds ratios; CI, confidence interval; SNP, single nucleotide polymorphism; COPD, chronic obstructive pulmonary disease; CHRNA5, cholinergic receptor, neuronal nicotinic, alpha polypeptide-5; HIF1A, hypoxia-inducible factor 1α; IREB2, iron-responsive element-binding protein 2 gene.