Abstract
Purpose.
We determined if the overlap of transient (tr) pattern electroretinograms (PERGtr) can explain the generation of the steady-state (SS) pattern electroretinogram (PERGSS), and investigated the relationship between the two types of responses.
Methods.
Slightly jittered pattern reversals were used to generate quasi SS (QSS) PERGSS responses from eight normal subjects, recorded using lower eyelid skin electrodes, at rates between 6.9 and 26.5 reversals per second (rps). Jittered quasi PERGSS were deconvolved using the frequency domain continuous loop averaging deconvolution method. Additionally, conventional PERGtr at 2.2 rps and PERGSS at each of the QSS stimulation rates were obtained from all subjects. Two synthetic PERGSS responses were constructed at each stimulation rate, one using the PERGtr obtained at that rate, and the other using the conventional 2.2 rps PERGtr. Synthetic responses then were compared to the recorded PERGSS using amplitude, latency, and spectral measurements.
Results.
Findings indicate that the PERGSS obtained at SS rates can be predicted using the superposition of deconvolved tr PERGs at each particular rate. Although conventional PERGtr can explain PERGSS obtained at rates below 15.4 rps (≥97% correlation), for higher reversal rates only deconvolved responses obtained at that rate can produce the recorded SS responses (96% vs. 65% correlation at 26.5 rps).
Conclusions.
The study shows that PERGSS results from the overlapping of tr PERGtr waveforms generated at that reversal rate. The first two peaks (NSS and PSS) of the PERGSS reflect N35 and P50 waves of the tr PERGtr. The N95 amplitude is reduced at conventional (16 rps) SS rates, but contributes to the overall PERGSS amplitude.
Keywords: pattern electroretinogram, steady-state PERG, transient PERG, deconvolution, overlap, superposition
Overlap of transient pattern electroretinograms (PERG) can explain the generation of the SS pattern electroretinogram.
Introduction
The pattern electroretinogram (PERG) is an electrical response recorded from the eye in response to the stimulation of the retina using temporally modulating contrasting patterns at constant mean luminance. The transient (tr) PERG waveform, generated at temporal rates less than 6 pattern reversals per second (rps), is comprised of 3 main components identified as negative and positive peaks (N35, P50, N95) occurring approximately at 35, 50, and 95 ms, respectively.1,2 At higher rates (typically >10 rps) repetitive stimulation results in a periodic, roughly triangular response whose amplitude and phase characteristics stay constant over time. This response is referred to the steady-state (SS) pattern electroretinogram (PERGSS). It generally is believed that the PERGSS arises from the superposition of overlapping tr PERG responses, and that the P50 component dominates the shape of the waveform.2,3
For years, efforts have been made to localize the origins of the tr PERG (PERGtr) response in the retina and it currently is believed that the response is generated primarily by the retinal ganglion cells (RGC) of the retina.4–7 Additionally, it is believed further that the P50 component is due partially to postsynaptic potentials, while the N95 component is due to RGC spiking activity.3,8 As a result, PERG is used widely as a measure of RGC function and as a tool in diagnosing disorders of the inner retina and visual pathways.1,9
Due to its periodic nature, PERGSS responses are best studied in the frequency domain using Fourier analysis methods with magnitude/phase measurements.10,11 Temporal frequency characteristics of the PERGSS have been investigated using different pattern reversal rates from 7 to 38 rps, and have been found to interact with the spatial frequency and contrast functions.12–14
The PERGSS is thought to be more sensitive to inner retinal disorders, especially at early stages of progression.8,15–17 This has been shown to hold in glaucoma and other disorders and PERGSS have been proposed for glaucoma screening and monitoring.11,15,17–20 These studies have shown that, compared to normal eyes tested at the same rates, eyes showing early stages of the disease exhibit PERGSS with phase delays and magnitude reductions. Fourier analysis of the PERGSS, done at these reversal rates, can only give a rough estimation of the averaged latencies and amplitudes of the N35, P50, and N95 tr components. Thus, any neuroanatomical clues of the disorder that can be obtained are obscured.
Given the clinical and research interest in the PERGSS, in conjunction with the specificity of the individual PERG components, it would be useful to be able to extract the individual tr waveform components from the PERGSS responses. Such extraction of the PERGtr from the PERGSS response has been accomplished by jittering the pattern reversal rate to produce quasi SS (QSS) PERG (qPERGSS) recordings and processing them with a recently developed deconvolution algorithm.21 The Continuous Loop Averaging Deconvolution (CLAD) method, originally developed to extract auditory evoked potentials from SS responses at high rates,22,23 exploits jittering to overcome the mathematical impossibility of deconvolving SS responses obtained with isochronic stimuli. By using jittered stimulus sequences, average responses to individual stimuli are extracted using mathematically constructed matrix equations in the time domain22 or simpler equations for faster on-line operations in the frequency domain.23–25 Using CLAD methodology, extraction of the PERGtr from PERGSS has been demonstrated up to approximately 80 reversals per second using low jitter sequences.21
This study aims to investigate the relationship between the PERGs generated under tr and SS conditions by conducting a more detailed analysis of the superposition theory of PERGSS generation. Our previous study,21 developed the methodology to extract tr, “per-stimulus” responses independent of reversal rate. The current study will investigate how these rate-specific tr responses impact the superposition model at clinically relevant rates. Thus, the specific goals of this study are to develop a more effective and quantitative convolution model to simulate PERGSS generation using tr PERGs, investigate how CLAD-derived high rate transients affect simulated PERGSS and how these simulated PERGSS compare to conventionally recorded PERGSS, and to analyze the relationships between tr (N35, P50, N95) and SS (NSS and PSS) PERG components.
Methods
Subjects
Data for this study was obtained from the right eye of eight young subjects (ages 20–31 years: 4 females, 4 males) with no history of visual or neurological impairment. Subjects were asked to sit comfortably for the duration of the test, placing their chins on a holder and keeping their eyes fixated on a red mark at the center of the pattern display. They were instructed to relax, but blink naturally and fix their gaze on a red spot on the rectangular field stimulus presented by a specially built visual display unit (VDU).26 Research adhered to the tenets of the Declaration of Helsinki. All subjects signed informed consent forms in accordance with the Institutional Review Board of the University of Miami.
PERG Recording.
Skin electrode technique of PERG acquisition11,27,28 was used in all the recordings. The PERGs were acquired monocularly (with the nontest eye occluded) using the SmartEP system (IHS, Miami, FL, USA) adapted for high rate recordings as described in our previous studies.21,26 Gold cup (9 mm) electrodes filled with conductive cream were placed under the lower eyelids (+, test eye; −, occluded eye) and the forehead (ground) as described in detail by Porciatti and Ventura.11 Signals were band-pass filtered (1–300 Hz, 6 dB/oct), amplified (gain, 100K), and digitized with a sampling interval of 450 μs. Each PERG recording was acquired by synchronous averaging of 128 continuous epochs using the pattern reversal onsets as triggers. For PERGtr and PERGSS, the epochs consisted of 1024 points with 460.8 ms duration. For qPERGSS, epochs of slightly different sweep lengths were used to ensure that isochronic and jittered sequences had fairly similar characteristics, and deconvolution did not introduce any additional noise as explained below. Artifact rejection (>25 μV) was used to exclude blink and other artifacts. Subjects were asked to fixate on the red circle located in the middle of the display screen and minimize blinking or moving their eyes.
Stimulus and Signal Acquisition.
Since accurate timing is crucial for precise extraction of tr responses, a new fast light emitting diode (LED) based visual display unit (VDU) as described in our previous studies21,26 was used in all the experiments. Most current displays use cathode ray tube (CRT) or liquid crystal display (LCD) based VDUs as visual stimulator. These conventional stimulators typically exhibit refresh rates between 60 and 75 Hz, which limit their temporal resolution drastically. Even special “high refresh rate” CRT monitors operate at approximately 200 Hz and cannot provide high temporal resolution with sufficiently fast onset-offset response times for the deconvolution operations needed for this study. The VDU used in this study used simultaneously switched new LEDs with fast response times (less than 0.1 ms) as described previously and made acquisition of high rate PERGs up to 100 rps possible.21,26 Similar fast response VDUs also were used in our animal experiments, which made simultaneous but independent recording of mouse PERGs from both eyes possible (Chou T-H, et al. IOVS 2013;54:ARVO E-Abstract 6131 and Ref. 29).
The visual stimulation consisted of a rectangular visual field pattern (33° × 36°) with 5 black and 5 white reversing horizontal bars with 99% contrast. The spatial frequency of the display was 0.15 cycles per degree (cpd) at a viewing distance of 25 cm with 150 cd/m2 mean display luminance. Pattern stimulus display parameters were in accordance with the accepted limits established by the International Society for Clinical Electrophysiology of Vision (ISCEV).2 Temporal stimulation patterns were determined by previously generated trigger sequences stored in the acquisition system, which were delivered to the display driver controlling the VDU. With each trigger in the sequence, the horizontal bars reversed between black and white.
Generally, PERGs are acquired with equal intervals between pattern reversals (isochoric stimulation). In this study, intervals are slightly altered (jittered stimulation) to allow for computation of the per stimulus response as explained in the previous study.21 For this study, three types of PERGs were acquired. First, qPERGSS were recorded using five temporally jittered stimulation sequences with different mean reversal rates ranging from approximately 6 to 25 rps. Second, isochronic “true PERGSS” responses were obtained at the same mean rates recorded above. Third, conventional PERGtr responses were obtained at 2.2 rps. The sequence of recordings was randomized within and across subjects. Typical tr (2.2 rps) and SS (17.4 rps) PERG recordings obtained from one subject are shown in Figure 1A.
Figure 1.
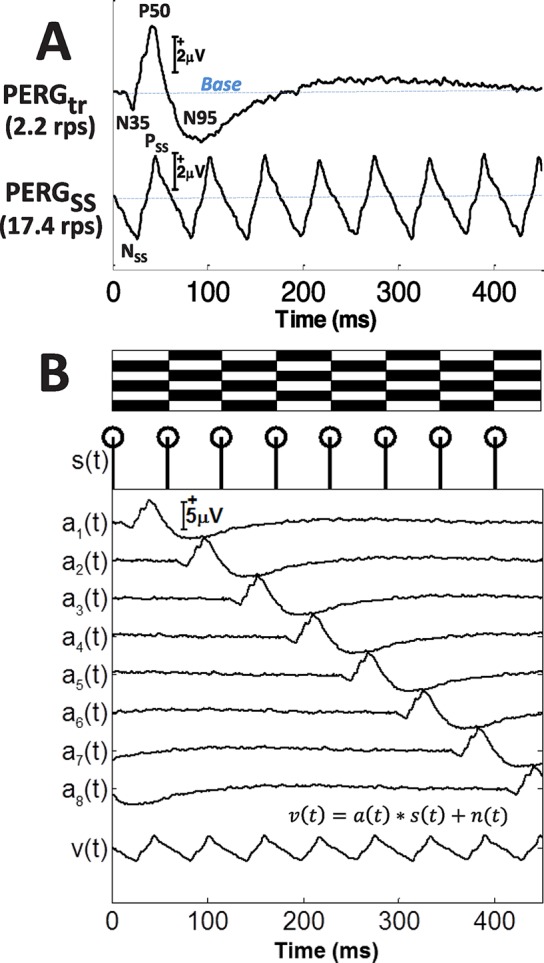
(A) Waveforms of PERGtr (first row) and PERGSS (second row) from one subject (S01) recorded at 2.2 and 17.4 rps, respectively. The tr peak names (N35, P50, and N95) and SS peaks (NSS and PSS) are labeled as shown. (B) Diagram depicting the superposition generation of PERGSS, v(t) at 17.4 rps using temporally shifted PERGtr waveforms, a(t). The isochronic stimulus sequence s(t) is depicted by the trigger signals below the alternating bars. To generate the synthetic PERGSS, tr waveform a(t) is shifted in a cyclic mode eight times according to the trigger signal s(t), and the resulting waveforms are averaged to produce v(t), the synthetic waveform synPERGSS. System noise is represented by n(t).
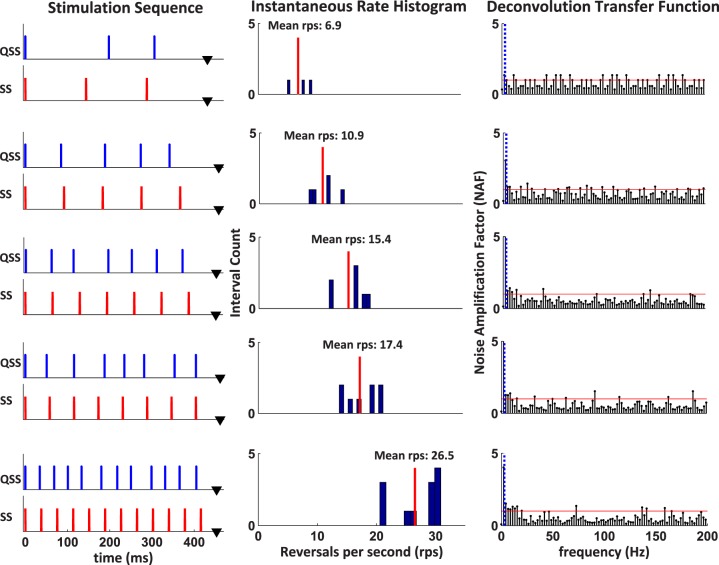
The characteristics of the five QSS stimulation sequences (mean rates, 6.9, 10.9, 15.4, 17.4, 26.5 rps) designed for this study are listed in Table 1. As mentioned before, all sequences had slightly different sweep lengths. Since each sequence point was sampled every 450 μs, the epoch durations of every rate was slightly different from the 460.8 ms sweep duration of the 1024 points tr and ss recordings. The five sequences generating the above rates were comprised of 3, 5, 7, 8, and 12 pulses for each sweep, respectively. Each pulse marked the start of a pattern reversal. These ss, and specially designed QSS sequences were generated continuously by the stimulation software, triggering the display driver microcontroller, and toggling the odd and even bars of the VDU as described in our previous study.21 For example, during the odd cycle of the 6.9 rps QSS sequence, the horizontal bars would toggle three times within the 432 ms sweep duration. First, at the sweep onset (0 ms) and at 198 ms and 306 ms later as shown in Figure 2. In the next even cycle, this process would proceed in the same way resulting in an equal number of toggles between black and white bars generated for every pair of sweeps.
Table 1.
Characteristics of the Five CLAD Sequences Used in This Study
|
Mean Rate, rps |
Sequence, ms |
No. of Stimuli |
Epoch Duration, ms |
Jitter Factor |
Jitter Ratio |
Inter Stimulus Interval, ms |
Mean NAF |
|||
|
Mean |
Min |
Max |
Std Dev |
|||||||
| 6.9 | 0.0, 198.0, 306.0 | 3 | 432.0 | 1.83 | 0.31 | 144.0 | 108.0 | 198.0 | 47.6 | 0.78 |
| 10.9 | 0.0, 84.6, 189.0, 273.6, 342.0 | 5 | 459.0 | 1.71 | 0.20 | 91.8 | 68.4 | 117.0 | 19.0 | 0.71 |
| 15.4 | 0.0, 61.2, 113.4, 196.2, 252.0, 311.4, 372.6 | 7 | 453.6 | 1.59 | 0.18 | 64.8 | 52.2 | 82.8 | 12.1 | 0.60 |
| 17.4 | 0.0, 50.2, 115.2, 187.2, 234.0, 280.8, 352.8, 403.2 | 8 | 460.8 | 1.54 | 0.19 | 57.6 | 46.8 | 72.0 | 10.7 | 0.62 |
| 26.5 | 0.0, 34.2, 68.4, 100.8, 133.2, 180.0, 217.8, 250.2, 298.8, 331.2, 365.4, 405.0 | 12 | 453.6 | 1.50 | 0.17 | 37.8 | 32.4 | 48.6 | 6.6 | 0.49 |
Sequence numbers show the pattern reversal trigger times for each rate as explained in the text.
Figure 2.
Ten stimulation sequences (trigger signals), a QSS and SS sequence at each mean reversal rate, are shown in the left column. The SS sequences are used to obtain PERGSS while QSS sequences are used to obtain the qPERGSS. Instantaneous rate histograms of the QSS sequences are shown in the middle column. Mean reversal rates for each sequence are shown as a vertical line in each histogram. The NAFs for each sequence are plotted as a function of frequency in the right column. The DC component and first frequency bin of each sequence is eliminated, as shown with the vertical dotted line. The horizontal line in each deconvolution transfer function shows NAF equal to 1, and shows the noise amplification/attenuation boundary.
The QSS sequences for this study were designed with two primary goals: low jitter and good noise attenuation. Low jitter was attained by keeping the QSS sequence as similar as possible to their equivalent isochronic SS sequence at a given rate. Low jitter quality was quantified by two measures: jitter factor and jitter ratio. Jitter factor was defined as the ratio of maximum inter stimulus interval (ISI) to the minimum ISI in a given rate. As defined here, the jitter factor of any isochronic sequence is equal to 1. Jittered sequences with jitter factors close to 1 exhibit low jitter and are highly desirable. Jitter ratio was measured as the ratio of standard deviation of all ISIs divided by the mean ISI. This parameter, measured the distribution of the ISIs with respect to mean and similar values across rates, show similarity of jitter.
The noise attenuation property of the QSS sequence was measured by the coefficient of deconvolution (cdec) or by its more descriptive name, the noise amplification factor (NAF), as explained in our previous publications.21,23–25, As measured in the frequency domain, NAF measures noise amplification (NAF > 1) or attenuation (NAF < 1) in the deconvolution transfer function. Thus, values below 1 are desirable at all frequencies in the measurement frequency band. To have good NAF values at all frequencies, epoch durations of the QSS sequences were slightly changed from the standard SS value (460.8 ms; 1024 points) as shown in Table 1. In general, there is a tradeoff between the noise shaping characteristics of the sequence and the amount of jitter between stimuli onsets.23–25 Typically, it is desirable to design sequences with minimal jitter to minimize any possible nonlinear adaptation due to widely varying ISI. Jitter quality measures and overall NAF values for all five rates are listed in Table 1. As seen all of these quality measures were fairly similar for all five rates showing the similarity of the deconvolution process in each case.
The time plots of the reversal triggers for the SS sequences and QSS sequences are shown in the left column of Figure 2. The histogram for each rate shows the dispersion of the instantaneous reversal rates for each ISI with the mean rate indicated by the vertical line. The filter characteristics of the sequences are characterized by the frequency domain deconvolution transfer function on the right column. As described previously,23 the deconvolution transfer function plots the NAF in each frequency bin with overall NAF computed as the root mean square summation of all the gain factors. As observed all sequences have low noise amplifying characteristics (NAF < 1) in all of the operating frequencies except in the first and second bins (corresponding to the dc and 2.17 Hz) at the low frequency end and a few isolated locations where they are equal or slightly over 1.0. These slight amplifications, however, do not pose a problem, since signals at such frequencies were further reduced by effective coherent averaging and filtered out during deconvolution with a digital band-pass filter (4.34–317.0 Hz).
Processing for Deconvolution Response.
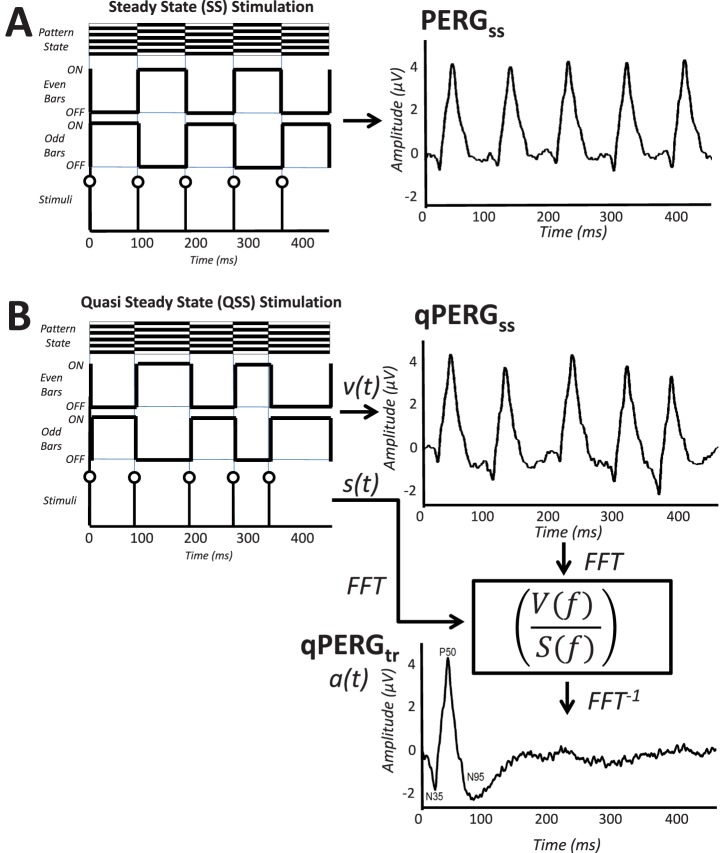
In this study qPERGSS responses recorded at five mean rates are deconvolved to acquire their constituting tr PERG responses as described in our previous study.21 In addition five sets of SS responses at the same mean rates were recorded using the conventional isochronic stimulation for comparison purposes. The process is displayed in Figure 3 showing “true” SS responses (row A, PERGSS) and “quasi” QSS responses (row B, qPERGSS). Using the frequency domain CLAD process,23 the qPERGSS responses were unwrapped to acquire the tr response (qPERGtr) corresponding to the unit response a(t) at that rate as shown at the bottom right.
Figure 3.
(A) The SS PERG stimulus pattern with reversing bars and triggers (left) and the resulting response generated at 10.9 rps (right). (B) Derivation of the tr PERG waveform (PERGtr) from the 10.9 rps qPERGSS. Responses to odd and even sweeps shown on the left are recorded and averaged to produce the QSS waveform, qPERGSS, on the right. The inverse FFT (FFT−1) of the ratio of the frequency domain functions of V(f) and S(f) is used to generate the tr PERGtr derived at that rate (qPERGtr) as shown on the bottom right.
Response Synthesis and Modeling.
Synthetic PERGSS responses (synPERGSS) for each rate were generated using the deconvolved tr responses extracted for that rate. This was accomplished by using the superposition model of PERGSS generation as depicted in Figure 1B. The superposition model was similar to the convolution model used in explaining the generation of the 40 Hz auditory SS response responses.25 The synthetic responses can be computed in the time domain by the averaging the cyclic summation of the shifted tr responses (convolution process). In this study, synthetic responses were computed by the equivalent frequency domain multiplication of the tr frequency response with the frequency transfer function of the stimulation sequence, and then transforming back into the time domain. The synthetic responses then were compared to the true SS response to test the validity of the superposition theory. Alternate synthetic SS responses also were generated at each rate using the conventional 2.2 rps tr PERGs to investigate the rate adaptation effect.
Results
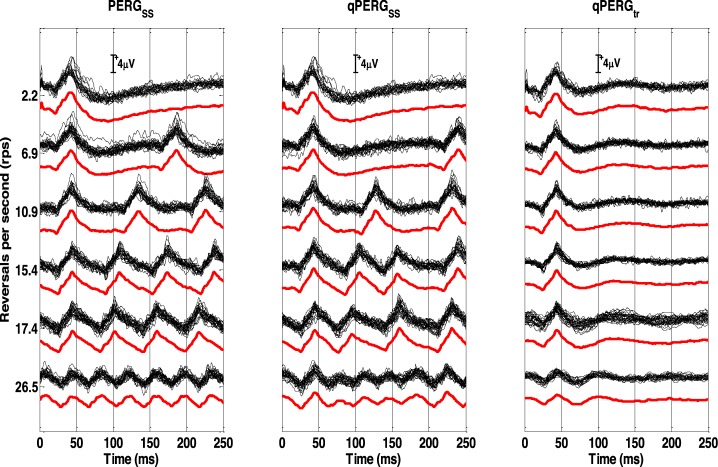
In Figure 4 SS PERGSS, QSS qPERGSS, and derived tr qPERGtr responses from all subjects are shown at each rate. For comparison purposes, 2.2 rps tr are displayed at the top of each column. Superimposed individual subject responses demonstrate little variability between the individual eyes at all rates showing good reliability of the recordings and stability of the processing methods used in the study. For reference, grand averaged responses at each rate are displayed offset from the superimposed individual subject responses. Large amplitudes are obtained up to and including 17.4 rps which diminishes substantially at 26.5 rps. As observed, PERGSS and qPERGSS responses are quite similar in waveshape and show similar amplitude reduction with rate. Derived tr qPERGtr responses show similar trends as well. Little reductions in amplitude and delays in latency are observed up to and including 17.4 rps. Above this rate, changes in PERG morphology reflected in amplitude and latencies progress. Amplitudes at 26.5 rps, reduce to almost half of the conventional PERGtr with latencies shift further as well. These changes are attributed to a rate based adaptation effect.
Figure 4.
The diagram shows three types of responses acquired at 6 different rates (2.2, 6.9, 10.9, 15.4, 17.4, and 26.5 rps). The acquired SS (PERGSS) and QSS (qPERGSS) responses are shown in the left and middle columns. The extracted tr (qPERGtr) responses are shown in the right column. At the top of each column, conventional 2.2 rps PERGtr are shown for reference purposes. Individual waveforms obtained from eight subjects are superimposed to show the recording reliability of responses. The thicker red trace offset below each group shows the population average of all the recordings for each rate.
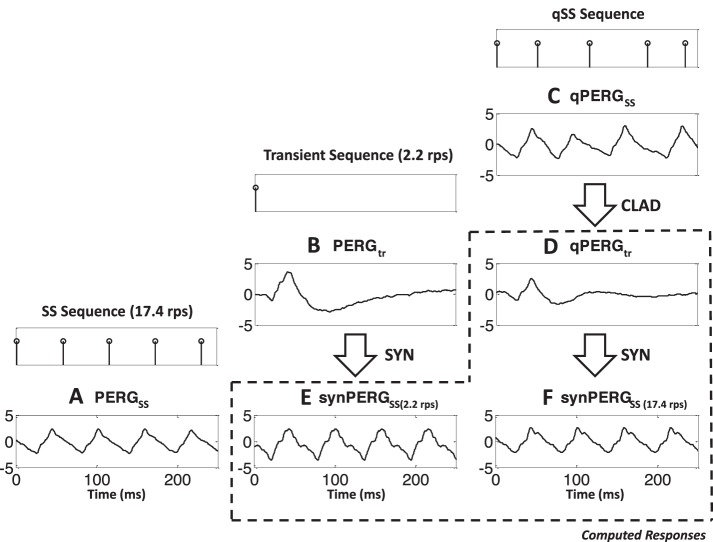
As discussed previously, the generation of the SS PERGs can be explained by the superposition model shown in Figure 1B. Such a model predicts the SS response by cyclic summation of tr responses at that rate. In the absence of a tr response generated at SS rates, however, such models used conventional low rate tr responses. In this study both types of synthetic responses are generated and compared to study the validity of each model. The results are displayed in Figure 5 for the 17.4 rps reversal rate. Stimulation sequences to SS (at 17.4 rps), tr (at 2.2 rps), and QSS (at mean 17.4 rps) are shown in the staggered top traces. The PERG grand averaged responses obtained with such sequences are shown in the second row (Figs. 5A–C). The grand averaged tr response derived by CLAD (qPERGtr) is displayed in Figure 5D. As observed, this response in Figure 5D is smaller than the 2.2 rps generated response (Fig. 5B). Synthetic responses generated with both transients are shown in Figures 5E (2.2 rps) and 5F (17.4 rps). As expected, synthetic response shown in Figure 5E is bigger and earlier than the acquired SS response (Fig. 5A) while the synthetic response (Fig. 5F) generated by the 17.4 rps tr is very similar to response (Fig. 5A).
Figure 5.
Generation and comparison of the SS and synthetic PERGSS synthesized using tr (2 rps, without adaptation) and derived responses at the reversal rate (with adaptation) at 17.4 rps. (A) Bottom left shows the population response PERGSS obtained at 17.4 rps. The tr response PERGtr obtained using 2.2 rps stimuli is shown in (B) in the middle. The corresponding qPERGSS response using the jittered sequence at the same rate is shown in (C). Stimulus sequences indicating pattern reversal times are shown at the top of each column. The tr qPERGtr derived using CLAD is shown in (D), and the associated synthetic response synPERGSS, synthesized (SYN) from the qPERGtr is shown in (F). The synthetic PERGSS obtained using the 2.2 rps tr PERG is shown in (E). All the computationally derived responses are enclosed by broken lines to separate them from the experimentally obtained PERG responses. Waveforms shown in (A, E, F) will be compared in the remaining diagrams to see the results of rate adaptation in the formation of SS PERGs.
As described earlier, P50 peak shows slight latency increase and amplitude decrease, while N95 shows latency and amplitude decrease as rate increases from 2.2 to 17.4 rps.21 Both of these changes can be attributed to adaptation effects due to rate and possibly results from different generators of the P50 and N95 peaks. Consequently, the 17.4 rps synthetic response obtained using 2.2 rps (Fig. 5E) will be referred as synthesized response without adaptation, while the synthetic response derived from 17.4 rps (Fig. 5F) as synthesized response with adaptation at the recording rate.
In Figure 6, recorded “true” SS and synthetic SS (synSS) averaged population responses are shown. Responses are presented in their original unfiltered forms (left column) and after filtering using the first five harmonics (right column) for all five rates. For each rate, the PERGSS is displayed as the middle trace (red, unbroken trace). Synthetic responses using deconvolved qPERGtr (synPERGSS) are displayed above the true PERGSS (black, dashed trace) while synthetic responses using conventional 2.2 rps transients (synPERGSS(2rps)) are displayed below the true PERGSS (blue, dotted trace). The synthetic response computed using the tr response at 2.2 rps, differs from the other two substantially at high reversal rates (15.4, 17.4, and 26.5 rps). Correlation coefficients between true PERGSS and both versions of synPERGSS are displayed in Table 2. While both synthetic responses exhibit high correlation to true PERGSS responses at low rates (correlation of 0.99), as reversal rate is increased, the synthetic constructed with extracted qPERGtr accounting for adaptation effects (synPERGSS) maintains a high correlation with the true PERGSS (>0.96 for all rates), while the synthetic response constructed from conventional 2.2 rps transiet PERG (synPERGSS[2rps]), becomes progressively less able to predict the true PERGSS (correlation of 0.65 at 26.5 rps).
Figure 6.
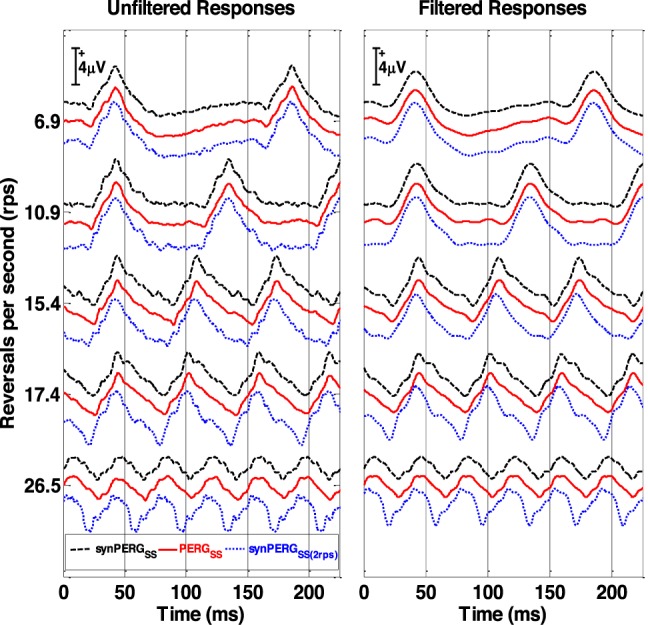
Comparison of the super averaged SS response (solid red traces), synthetic QSS generated from the tr responses derived at each rate (dashed black traces) and responses generated using 2.2 rps (dotted blue lines) shown for the five pattern reversal rates. The three sets of traces are offset from each other, with the PERGSS arranged in the middle to facilitate comparison with each synthetic response. Unfiltered waveforms and the filtered waveforms (five harmonics added) are shown on the left and right columns, respectively.
Table 2.
Correlation Coefficients Between True PERGSS Responses Compared to Synthetic PERGSS Responses Generated From Deconvolved qPERGtr Responses and Conventional 2.2 rps PERGtr
|
RPS |
Correlation Coefficient |
|
|
True PERGSS - synPERGSS(2rps) (Filtered for 5 Harmonics) |
True PERGSS - Deconvolved synPERGSS (Filtered for 5 Harmonics) |
|
| 6.9 | 0.98 (0.99) | 0.99 (0.99) |
| 10.9 | 0.97 (0.98) | 0.99 (0.99) |
| 15.4 | 0.90 (0.91) | 0.99 (0.99) |
| 17.4 | 0.86 (0.87) | 0.98 (0.99) |
| 26.5 | 0.65 (0.66) | 0.96 (0.99) |
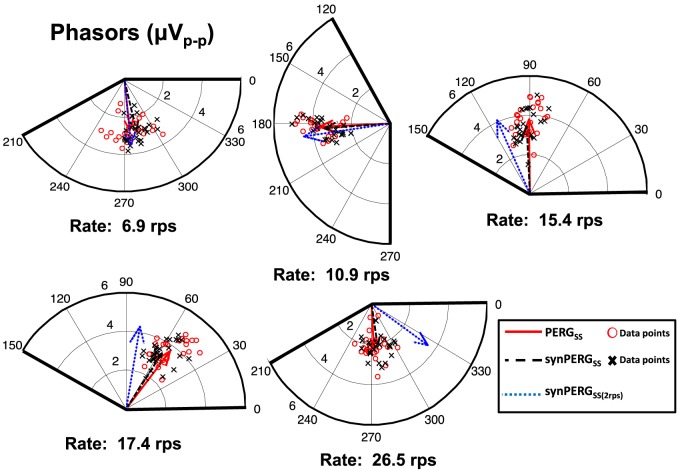
Responses were analyzed in the frequency domain by examining the frequency components of the PERGSS and synPERGSS at the reversal rate. These components were visualized in polar diagrams using phasors at the reversal rate. Magnitude and phase for each phasor were calculated from the real and imaginary parts of the complex values obtained from the fast Fourier transform (FFT). Phase was represented in 360° counterclockwise. The magnitudes and phases for all five rates and three conditions are shown in Figure 7. The individual subjects are shown as data points while averaged data are presented as phasors in vector form. As observed at lower rates, when there is little temporal adaptation (6.9 and 10.9 rps) both averaged synthetic phasors are similar in magnitude and orientation to the true PERGSS response. As reversal rates increase beyond 15.4 rps, Synthetic PERGSS obtained without adaptation (using 2.2 rps base response) begin to deviate in orientation (phase) while the synthetic PERGSS constructed with the extracted tr (synPERGSS) remains consistent with true PERGSS. Additionally, as reversal rate is increased, there is a reduction in magnitude of the true PERGSS response. A similar magnitude reduction is observed in the synPERGSS, but is not present in the synthetic waveform generated using the 2.2 rps conventional tr response (synPERGSS[2.2rps]).
Figure 7.
Polar diagrams of the phasors at the reversal rate for each rate. Population averaged phasors are shown as vectors for true SS PERGSS (red unbroken vector), synthetic QSS generated from the tr responses derived at that rate, synPERGSS (black dashed vector) and synthetic QSS generated from a conventional 2.2 rps tr response, synPERGSS(2rps) (blue dotted vector). Red circles show individual data points for true PERGSS responses, while black crosses show individual data points for the synPERGSS accounting for adaptation. Magnitudes (in μV on the radius) and phases (in degrees around the circle) are shown on all of the plots.
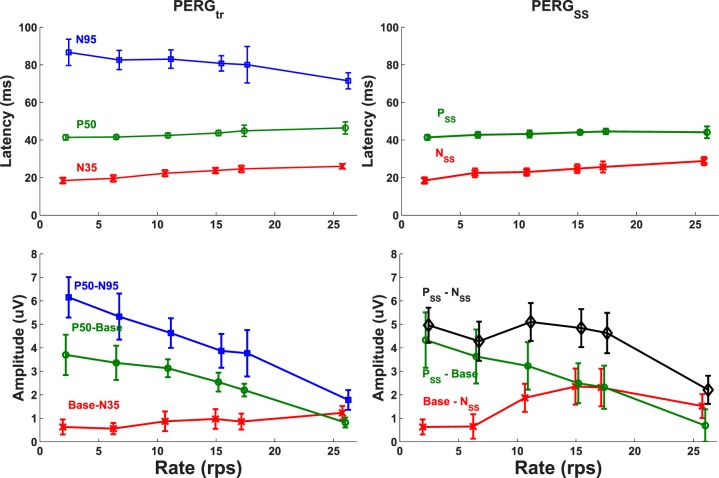
In Figure 8 temporal characteristics (peak latencies and amplitudes) of the SS (PERGSS) and the extracted tr (qPERGtr) responses are plotted for all reversal rates. As described before, the PERGSS (right column) is identified by two positive and negative peaks (NSS and PSS), while PERGtr (left column) is characterized by the three conventional peaks (N35, P50, and N95). As observed in the top row of Figure 8, latencies of the negative (N35 and NSS) and positive (P50 and PSS) peaks of both recordings show similar values at all rates. They all increase slightly as reversal rate increases. The tr PERG peak N95 latency, however, follows a different trend and decreases as rate increases, as also observed in Figure 4.
Figure 8.
Latency and amplitude characteristics of the tr (right column) and SS (left column) PERG response peaks as a function of reversal rate. Population averages and standard deviations are indicated by middle points and vertical bars at each data point marker. Latencies of tr (N35, P50, and N95) and SS (NSS and PSS) peaks and their amplitude measurement conventions are plotted on the top and bottom panels, respectively.
Amplitudes of the tr peaks (Fig. 8, bottom right) all show a diminishing trend with the possible exception of N35 (Base-N35) which increases slightly with the reversal rate. The P50-N95 amplitude decreases the most from approximately 6 μV at 2.2 rps to approximately 2 μV at 26.5 rps. Similar decreasing trends are observed for P50 (P50-Base, P50-N35) as well. For the SS amplitudes (Fig. 8, bottom left), the decreasing trend is observed only for the positive peak (Base-PSS) measurement which reflects P50 tr peak. All other measurements (PSS-NSS and Base-NSS) show an increase for the mid reversal rates (10.9, 15.4, and 17.4 rps) followed by a rapid drop at 26.5 rps. For these mid reversal rates, SS peak-to-peak amplitude (PSS-NSS) is bigger than the corresponding tr P50-N95 and N35-P50 amplitudes.
Discussion
Although the SS PERGSS response is widely thought to be generated by the overlap of the tr PERGs generated at high reversal rates, until now its generation mechanism has been mostly described qualitatively due to the unavailability of tr waveforms at such rates. Recently, the extraction of the tr responses constituting the SS evoked responses has been possible through the use of deconvolution methodology in auditory evoked responses23–25 and PERGs.21 In this study we investigated the formation of SS PERGs by computing tr qPERGtr responses derived by deconvolution at several rates. Since the deconvolution algorithm used in this study required very accurate and simultaneous reversal of patterns, a specially designed VDU using fast acting (less than 0.1 ms), simultaneous switching LEDs26 was built and used in all the experiments. Horizontal bar gratings were toggled at slightly jittered, but precise temporal rates which allowed the unwrapping of the QSS responses to obtain the tr waveform at the mean rate. The goal of the project was to investigate the generation of the PERGSS at rates below approximately 26.5 rps.
In this study, tr, SS, and QSS PERGs were recorded at six rates between 2.2 and 26.5 rps using lower eyelid electrodes. The inspection of the grand averaged and individual responses shown in Figure 5 demonstrates that PERG recordings obtained with noninvasive skin electrodes and the fast reversing VDU are consistent and reliable. The use of skin electrodes were well tolerated by subjects and probably contributed to the high consistency of the recordings. These procedures allowed the necessary long duration experiments to investigate the relationships between tr and SS responses to be conducted.
The tr and the SS responses recorded in this study occur earlier and exhibit larger amplitudes than the standard PERGs obtained using skin electrodes with traditional CRT VDUs.2,11 The P50 mean latency of the tr 2.2 rps PERG of the present study is approximately 40 ms (41.4 ± 1.4 ms), approximately 10 ms earlier than the conventional PERG study. The earlier occurrence of the P50 can be attributed to the sharp and simultaneous onset (approximately 1 ms) of the pattern reversal in the fast LED VDU used in this study. As also stated in the ISCEV PERG standards,2 conventional CRT or LCD displays commonly used in research or clinical environments have long refresh rates, raster scan, and response times. Thus, depending on the display, the pattern reversal is completed in a slow sweeping manner that may take tens of milliseconds. The onset of such displays is historically taken as the beginning of the refresh time at the top of the screen. The ISCEV standards recommend at least 5 ms to be added to this “zero” time when fast non-CRT displays are used. When 17.4 rps results of the present study are compared to the study using the similar PERGLA paradigm in a CRT based VDU,11 a phase difference of 0.38 rad corresponding to approximately 10 ms is observed. The additional 5 ms difference could be attributed to the fast LEDs and simultaneous reversal of patterns used in the present study.
The P50 amplitude measured as P50-N35 in the present study is above 4 μV (4.33 ± 1.8 μV) much larger than previous CRT based displays.11 This could be attributed to the differences in the temporal characteristics of pattern generation between conventional displays and the present LED display. Simultaneous switching in the current display eliminates uncertainty of pattern onsets generally present in CRT and LCD displays. Poorer contrast characteristics of the CRT displays compared to the LED display may play a big role as well. The role of the temporal dynamics on PERG characteristics for various VDU technologies should be further investigated in future studies.
As seen in Figure 4, the first positive peak (PSS) of the SS response corresponds closely to the P50 peak of the tr response. They both increase slightly as reversal rate increases. The same trend is observed for the first negative peaks (NSS and N35) as well. Both of these latencies are plotted on top row in Figure 8. The tr N95 latency, however, does not follow this trend. This peak decreases as reversal rate increases and no corresponding latency is observed in the SS response. The above observations are similar to our previous recordings as well.21 The second negative peak of the SS response is poorly defined across rates since it is formed by the N95 of the first and N35 of the following reversals. As such no latencies corresponding to N95 are marked or displayed in Figure 8.
Comparison of the acquired and synthesized SS responses (Figs. 5A, 5E, 5F, bottom row) show that largest response is the synthetic response obtained without adaptation (Fig. 5E). This is expected since it uses a bigger tr response. This response, however, is bigger than the recorded response (Fig. 5E) which is very similar to the one synthesized using the CLAD derived response at 17.4 rps (Fig. 5F), the same rate PERGSS were acquired.
Derived tr PERG responses obtained from high rate studies can help to resolve many problems involving interaction of temporal and spatial frequencies in contrast transfer functions.12,14 Since the periodic PERGSS waveforms result from the constructive and destructive summation of the basic PERGtr components, measurements obtained from spectral analysis (magnitude and phase) can be supplemented using amplitude and latency measurements obtained from derived transients in the time domain. As shown earlier higher temporal frequency measurements (>10 rps) improves the sensitivity of the PERG tests to detect glaucoma.16
As shown in our previous study using similar methodology, reversal rates higher than 25 rps further diminished the amplitude of the SS PERG responses down to almost noise levels at approximately 40 rps.21 As shown in this study, at mid-level reversal rates (15–20 rps) PERGSS amplitudes are maximal which can be explained by the superposition of the overlapping tr generating waveforms. The waveform of the resulting periodic SS responses is determined exclusively by the shape of the tr response generated at the stimulation rate, which depends on the adaptation effects on individual components. As shown in our previous study,21 extracted PERG transients follow conventional triphasic (N35-P50-N95) waveform morphology up to approximately 40 rps. Adaptation affects N95 component the most, reducing its amplitude drastically and shortening its latency. Latencies of the P50 and N35 components on the other hand change their latencies only slightly while their amplitudes slightly decrease and increase, respectively. The resulting waveform is a triangular shaped waveform with an early negative peak NSS influenced by N35 and N95 and a positive peak PSS greatly dependent on P50. At mid reversal rates (15–20 rps), the N35 component of the most recent stimulation onset and N95 of the preceding stimulation onset overlap and enhance each other resulting in a slight increase in amplitude. This enhancement effect has long been recognized and the rate approximately 16 rps have been standardized for SS PERG clinical applications.2,11,16,30
The tr PERG P50 and N95 measurements show abnormalities in retinal and optic nerve diseases.9 As shown in many studies these abnormalities are further enhanced at high rates. The SS PERG recordings at rates approximately 16 rps are found to be highly sensitive in detecting early glaucoma damage.15,16,19 This may be due to the increased frequency of stimulus presentation, which results in a higher level of neural activity and, thus, increased metabolic stress.31,32 Conventional tr PERGtr recordings show that P50 and N95 amplitudes are similarly affected in glaucoma patients, but the amplitude of the PERGSS is much more affected.16 The overlap generation mechanism developed in this study explains this observation quite easily since P50 and N95 amplitudes contribute to the overall SS amplitude, and each tr peak reduction would result in even greater reduction in the overall SS amplitude. Thus, tr PERGs extracted from SS PERGs could even be more effective in early or differential diagnosis of retinal diseases including glaucomatous eyes, since individual latency and amplitudes of all N35, P50, and N95 would be available for analysis at high SS rate. Conventional SS PERGSS normally provides magnitude and phase measurements at approximately 16 rps. Quasi SS PERGSS method would supplement these results with individual N35, P50, and N95 amplitude/latency measurements which are better interpreted anatomically and physiologically.
Acknowledgments
Supported by National Institutes of Health (NIH; Bethesda, MD, USA) Grant NIH-NEI RO1 EY014957 (VP), NIH Center Grant P30-EY014801 (VP), and an unrestricted grant to Bascom Palmer Eye Institute from Research to Prevent Blindness, Inc.
Disclosure: Ö. Özdamar, None; J. Toft-Nielsen, None; J. Bohórquez, None; V. Porciatti, None
References
- 1. Holder GE. The pattern electroretinogram. In: Heckenlively JR, Arden GB. eds Principles and Practice of Clinical Electrophysiology of Vision. Cambridge, London: The MIT press; 2006: 341–351. [Google Scholar]
- 2. Bach M, Brigell MG, Hawlina M, et al. ISCEV standard for clinical pattern electroretinography (PERG): 2012 update. Doc Ophthalmol. 2013; 126: 1–7. [DOI] [PubMed] [Google Scholar]
- 3. Bach M, Hoffman MB. The origin of the pattern electroretinogram. In: Heckenlively JR, Arden GB. eds Principles and Practice of Clinical Electrophysiology of Vision. Cambridge, UK: The MIT press; 2006: 185–196. [Google Scholar]
- 4. Maffei L, Fiorentini A. Electroretinographic responses to alternating gratings before and after section of the optic nerve. Science. 1981; 211: 953–955. [DOI] [PubMed] [Google Scholar]
- 5. Maffei L, Fiorentini A. Generator sources of the pattern ERG in man and animals, Evoked potentials. Front Clin Neurosci. 1986; 3: 101–116. [Google Scholar]
- 6. Sieving PA, Steinberg RH. Proximal retinal contribution to the intraretinal 8-Hz pattern ERG of cat. J Neurophysiol. 1987; 57: 104–120. [DOI] [PubMed] [Google Scholar]
- 7. Luo X, Frishman LJ. Retinal pathway origins of the pattern electroretinogram (PERG). Invest Ophthalmol Vis Sci. 2011; 52: 8571–8584. [DOI] [PMC free article] [PubMed] [Google Scholar]
- 8. Viswanathan S, Frishman LJ, Robson JG. The uniform field and pattern ERG in macaques with experimental glaucoma: removal of spiking activity. Invest Ophthalmol Vis Sci. 2000; 41: 2797–2810. [PubMed] [Google Scholar]
- 9. Holder GE. Pattern electroretinography (PERG) and an integrated approach to visual pathway diagnosis. Prog Retin Eye Res. 2001; 20: 531–561. [DOI] [PubMed] [Google Scholar]
- 10. Meigen T, Bach M. On the statistical significance of electrophysiological steady-state responses. Doc Ophthalmol. 1999; 98: 207–232. [DOI] [PubMed] [Google Scholar]
- 11. Porciatti V, Ventura LM. Normative data for a user-friendly paradigm for pattern electroretinogram recording. Ophthalmol. 2004; 111: 161–168. [DOI] [PMC free article] [PubMed] [Google Scholar]
- 12. Zapf HR, Bach M. The contrast characteristics of the pattern electroretinogram depends on temporal frequency. Graefe's Arch Clin Exp Ophthalmol. 1999; 237: 93–99. [DOI] [PubMed] [Google Scholar]
- 13. Heine M, Meigen T. The dependency of simultaneously recorded retinal and cortical potentials on temporal frequency. Doc Ophthalmol. 2004; 108: 1–8. [DOI] [PubMed] [Google Scholar]
- 14. Ben-Shlomo G, Bach M, Ofri R. Temporal and spatial frequencies interact in the contrast transfer function of the pattern electroretinogram. Vision Res. 2007; 47: 1992–1999. [DOI] [PubMed] [Google Scholar]
- 15. Ventura LM, Porciatti V. Pattern electroretinogram in glaucoma. Curr Opin Ophthalmol. 2006; 17: 196–202. [DOI] [PMC free article] [PubMed] [Google Scholar]
- 16. Bach M, Hoffman MB. Update in pattern electroretinogram in glaucoma. Optom Vis Sci. 2008; 85: 386–395. [DOI] [PubMed] [Google Scholar]
- 17. Ventura LM, Golubev I, Feuer WJ, Porciatti V. Pattern electroretinogram progression in glaucoma suspects. J Glaucoma. 2013; 22: 219–225. [DOI] [PMC free article] [PubMed] [Google Scholar]
- 18. Falsini B, Porciatti V. The temporal frequency response function of pattern ERG and VEP: changes in optic neuritis. Electroenceph Clin Neurophysiol. 1996; 100: 428–435. [PubMed] [Google Scholar]
- 19. Ventura LM, Porciatti V. Restoration of retinal ganglion cell function in early glaucoma after intraocular pressure reduction: a pilot study. Ophthalmology. 2005; 112: 20–27. [DOI] [PMC free article] [PubMed] [Google Scholar]
- 20. Ventura LM, Golubev I, Lee W, et al. Head-down posture induces PERG alterations in early glaucoma. J Glaucoma. 2013; 22: 255–264. [DOI] [PMC free article] [PubMed] [Google Scholar]
- 21. Toft-Nielsen JA, Bohórquez J, Özdamar Ö. Unwrapping of transient responses from high rate overlapping pattern electroretinograms by deconvolution. Clin Neurophysiol. 2014; 125: 2079–2089. [DOI] [PubMed] [Google Scholar]
- 22. Delgado RE, Özdamar Ö. Deconvolution of evoked responses obtained at high stimulus rates. J Acoust Soc Am. 2004; 115: 1242–1251. [DOI] [PubMed] [Google Scholar]
- 23. Özdamar Ö, Bohórquez J. Signal to noise ratio and frequency analysis of continuous loop averaging deconvolution (CLAD) of overlapping evoked potentials. J Acoust Soc Am. 2006; 119: 429–438. [DOI] [PubMed] [Google Scholar]
- 24. Bohórquez J, Özdamar Ö. Signal to noise ratio analysis of maximum length sequence deconvolution of overlapping evoked potentials. J Acoust Soc Am. 2006; 119: 2881–2888. [DOI] [PubMed] [Google Scholar]
- 25. Bohórquez J, Özdamar Ö. Generation of the 40-Hz auditory steady-state response (ASSR) explained using convolution. Clin. Neurophysiol. 2008; 119: 2598–2607. [DOI] [PubMed] [Google Scholar]
- 26. Toft-Nielsen JA, Bohórquez J, Özdamar Ö. Innovative pattern reversal displays for visual electrophysiological studies. Conf Proc IEEE Eng Med Biol. 2011; 2009–2012. [DOI] [PubMed] [Google Scholar]
- 27. Odom JV, Maida TM, Dawson WW, Hobson R. Pattern electroretinogram: effects of reference electrode placement. Doc Ophthalmol. 1987; 65: 297–306. [DOI] [PubMed] [Google Scholar]
- 28. McCulloch DL, Van Boemel GB, Borchert MS. Comparisons of contact lens, foil, fiber, and skin electrodes for pattern electroretinograms. Doc Ophthalmol. 1998; 94: 327–340. [DOI] [PubMed] [Google Scholar]
- 29. Chou T-H, Bohorquez J, Toft-Nielsen J, Ozdamar O, Porciatti V. Robust mouse pattern electroretinograms derived simultaneously from each eye using a common snout electrode. Invest Ophthalmol Vis Sci. 2014; 55: 2469–2475. [DOI] [PMC free article] [PubMed] [Google Scholar]
- 30. Porciatti V, Burr DC, Morrone MC, Fiorentini A. The effects of aging on the pattern electroretinogram and visual evoked potential in humans. Vision Res. 1992; 32: 1199–1209. [DOI] [PubMed] [Google Scholar]
- 31. Porciatti V, Sorokoc N, Buchser W. Habituation of retinal ganglion cell activity in response to steady state pattern visual stimuli in normal subjects. Invest Opththalmol Vis Sci. 2005; 46: 1296–1302. [DOI] [PMC free article] [PubMed] [Google Scholar]
- 32. Porciatti V, Bosse B, Parekh PK, Shif OA, Feuer WJ, Ventura LM. Adaptation of the SS PERG in early glaucoma. J Glaucoma. 2014; 23: 494–500. [DOI] [PMC free article] [PubMed] [Google Scholar]


