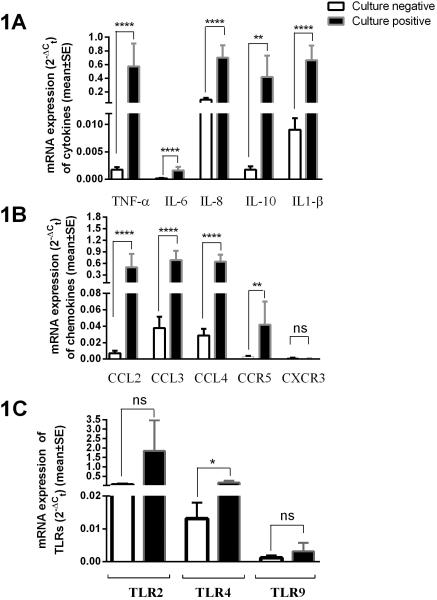
Figure 1.
Comparison of tumor-necrosis factor- α (TNF-α), interleukins (IL-6, IL-8, IL-10 & IL-1β) (shown in 1A) chemokines (CCL2, CCL3, CCL4) and chemokines receptors (CCR5, CXCR3) levels (shown in 1B) and toll-like receptors (TLR2, TLR4 & TLR9) expression (shown in 1C) in MEF of children with AOM. Results shown are relative mRNA expression of culture negative (n=24) vs. culture positive (n=42) MEF samples.
Note: All studied cytokines and chemokines showed significantly higher expression in culture positive compared to culture negative MEFs. **** p <0.0001, **; p <0.001, * p value <0.05, ns: not significant

