

Abstract
Extensive research indicates that graphene oxide (GO) can effectively deliver photosensitives (PSs) by π-π stacking for photodynamic therapy (PDT). However, due to the tight complexes of GO and PSs, the fluorescence of PSs are often drastically quenched via an energy/charge transfer process, which limits this GO-PS system for photodiagnostics especially in fluorescence imaging. To solve this problem, we herein strategically designed and prepared a novel photo-theranostic agent based on sinoporphyrin sodium (DVDMS) loaded PEGylated GO (GO-PEG-DVDMS) with improved fluorescence property for enhanced optical imaging guided PDT. The fluorescence of loaded DVDMS is drastically enhanced via intramolecular charge transfer. Meanwhile, the GO-PEG vehicles can significantly increase the tumor accumulation efficiency of DVDMS and lead to an improved photodynamic therapy (PDT) efficacy as compared to DVDMS alone. The cancer theranostic capability of the as-prepared GO-PEG-DVDMS was carefully investigated both in vitro and in vivo. Most intriguingly, 100% in vivo tumor elimination was achieved by intravenous injection of GO-PEG-DVDMS (2 mg/kg of DVDMS, 50 J) without tumor recurrence, loss of body weight or other noticeable toxicity. This novel GO-PEG-DVDMS theranostics is well suited for enhanced fluorescence imaging guided PDT.
Keywords: photosensitizer, sinoporphyrin sodium (DVDMS), PEGylated grapheme oxide (GO), photodynamic therapy, near-infrared fluorescence imaging
1. Introduction
Photodynamic theranostics, due to the specific spatiotemporal selectivity and minimal invasiveness, is an emerging solution that promises simultaneous photosensitizer (PS) fluorescence imaging and photodynamic therapy (PDT) [1–6]. Based on the activation of light with appropriate wavelengths, PS can emit fluorescence via the relaxation of the excited-singlet-state PS back to the ground state, which can be employed for the photodiagnosis of disease, real-time visualization of in vivo PS delivery and distribution, and molecular imaging-guided PDT [1, 2]. Additionally, PS can transfer the absorbed photon energy to surrounding oxygen molecules, resulting in the production of reactive oxygen species (ROS) including singlet oxygen or free radicals, which cause cancer cell death and tumor tissue destruction [7–9].
Most PSs used in PDT are limited by prolonged cutaneous photosensitivity, poor water-solubility and inadequate selectivity [10–12]. To improve the water solubility of PS molecules and increase their accumulation into cancer cells/tissues, various nanocarriers such as liposomes and polymer-, silica-, magnetic-, gold-, and carbon-based nanoparticles (NPs) have been actively developed for the delivery of PS [12–22]. Although these nanocarriers can improve tumor accumulation efficiency of PS via the enhanced permeability and retention (EPR) effect over free PS, the fluorescence of PS is often quenched in varying degrees by the nanocarriers [10, 16, 17, 23–25]. Therefore, the development of novel PS delivery system without fluorescence quenching is desirable for optimizing PS fluorescence imaging and PDT.
Among the various nanocarriers, graphene oxide (GO), due to the large surface area, water solubility, abundant functional groups (epoxide, hydroxyl, and carboxylic groups) and easy surface modification, has been widely employed for biosensing, bioimaging, and drug/gene delivery [26–37]. GO shows great potential as an efficient quencher in GO-based nanosensors for many fluorescent moieties, including small molecule dyes, quantum dots and conjugated polymers via fluorescence resonance energy transfer or charge transfer [38–42]. Most recently, researchers have combined GO with PS for fluorescence imaging and PDT [16, 23, 24]. However, the drastic fluorescence quenching of PSs by GO in GO-based PS delivery system limits their potential as photodiagnostics. In our previous studies, we found that the fluorescence of chlorin e6 (Ce6) was drastically quenched by folic acid-conjugated GO [16]. Recently, we also observed 2-(1-hexyloxyethyl)-2-devinyl pyropheophorbide-alpha (HPPH) fluorescence quenching by GO-PEG [24]. The similar results were also verified in the studies from other groups [23]. Therefore, there still remains a grand challenge to improve GO-based PS delivery system without fluorescence quenching.
In this study, we designed and validated a novel phototheranostic nanoplatform based on sinoporphyrin sodium (DVDMS) photosensitizer-loaded PEGylated GO (GO-PEG-DVDMS) for enhanced fluorescence imaging guided PDT. DVDMS (Scheme 1), a porphyrin dimer salt, has been used as a new type of PS with high yield of fluorescent emission at the wavelengths of 615~625 nm for diagnosis and treatment of cancer [43, 44].
Scheme 1.
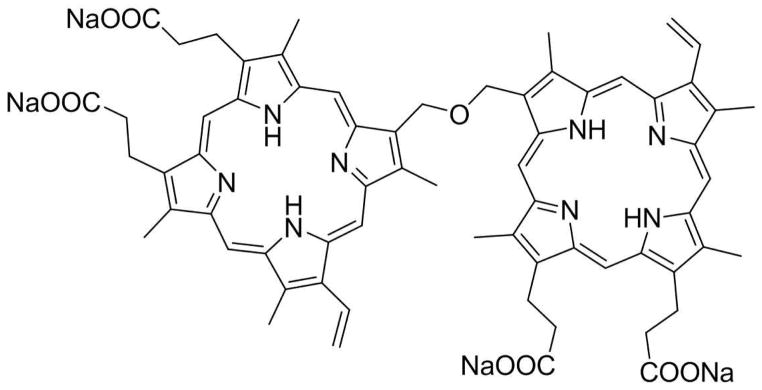
Chemical structure of DVDMS.
2. Experimental Section
2.1. Materials
DVDMS photosensitizer was provided by Jiangxi Qinglong Group Co., Ltd (Jiangxi, China). Amine-terminated eight-arm branched PEG (Mw: 15,000) was purchased from NOF America Corporation (White Plains, NY). N-(3-dimethylaminopropyl-N-ethylcarbodiimide) hydrochloride (EDC) was obtained from Fluka Inc. Singlet oxygen sensor green (SOSG), DAPI (SlowFade® Gold Antifade Reagent with DAPI, Molecular Probes), and live/dead stain kit were purchased from Invitrogen. All the above chemicals were used without any further purification. Water was purified with Milli-Q plus system (Millipore Co., Bedford, MA), and the resistivity was kept to be 18 MΩ cm.
2.2. Synthesis of GO-PEG-DVDMS
GO was synthesized using a modified Hummers method as previously reported [36, 45, 46]. In brief, NaOH (0.05 M) was added into the GO solution and the mixture was heated for 4 h at 55 °C. The solution was adjusted to pH = 1 by adding HCl (37% v/v). Then the solution was obtained by centrifugation after being neutralized and purified with water. Then 25 mg of amine-terminated eight-arm branched PEG was added into the base-treated GO solution (1 mg/mL, 5 mL) in a 25-ml glass vial. The mixture was sonicated for 15 min. N-(3-dimethylaminopropyl-N-ethylcarbodiimide) hydrochloride (EDC) was added to give a final concentration of 10 mg/mL. After stirring overnight at room temperature, the solution was centrifuged to remove any aggregates and the supernatant was collected. The PEGylated GO was further purified with 100 kDa filter (Millipore Inc.) and washed with distilled water. To determine the GO-PEG concentration, the absorbance at 230 nm was recorded with a weight extinction coefficient of 47.6 mg mL−1cm−1.
DVDMS was dissolved in water at 10 mg/mL as the stock solution for further use. DVDMS (0.4 mg/mL), and PBS (0.02 M) were slowly added into GO-PEG (0.1 mg/mL) solution and incubated overnight to produce GO-PEG-DVDMS. Unbound free DVDMS was removed by filtration through a 100 kDa cutoff spin filter and washed with water for 6–8 times.
2.3. Characterization of GO-PEG-DVDMS
The size and thickness of GO-PEG-DVDMS were characterized using atomic force microscopic (AFM) images. The ultraviolet-visible (UV-vis) spectra was measured to determine the concentration of DVDMS loaded onto GO-PEG by the characteristic absorption peak at 516 nm with a molar extinction coefficient of 2.9×10⁴ M−1cm−1 after subtracting the absorbance contributed by GO-PEG at the same wavelength. Fluorescence spectra of GO-PEG-DVDMS and free DVDMS were measured with an F-7000 fluorescence spectrophotometer (Hitachi, Tokyo, Japan) under 385 nm excitation.
2.4. Detection of singlet oxygen
Singlet oxygen sensor green (SOSG) was used to detect the singlet oxygen generation (SOG) of GO-PEG-DVDMS or DVDMS [47]. The GO-PEG-DVDMS or DVDMS solutions were mixed with SOSG in water containing 2% methanol with the final concentration of 1.0 μM. For each sample, the DVDMS concentration was fixed at 0.5 μg/mL. Then the solutions were irradiated with a 630 nm laser (Reserch Electro-Optics Inc, Colorado, US.). SOSG fluorescence emission was measured with an F-7000 fluorescence spectrophotometer (Hitachi, Tokyo, Japan) under 485 nm excitation. The sample’s SOG was evaluated by the SOSG fluorescence enhancement compared with the background or control samples.
2.5. Cell uptake and internalization
U87MG human glioma cells, obtained from the American Type Culture Collection (ATCC, Manassas, VA), were cultured in Dulbecco’s Modified Eagle Medium containing 10% FBS and 1% penicillin/streptomycin at 37 °C under 5% CO2. For cell uptake assay, the cells were seeded in Lab Tek II 8-well chamber slides (Nalge Nunc Internationl, Rochester, NY) with a density of 1 × 10⁴ cells/mL and were allowed to grow for 24 h. Then, medium was replaced and cells were incubated in the dark with GO-PEG-DVDMS or DVDMS at DVDMS concentration of 1 μg/mL for 24 h. Then cells were washed with phosphate buffered saline (PBS) for three times. After being mounted with a mounting solution containing DAPI (SlowFade® Gold Antifade Reagent with DAPI, Molecular Probes, Invitrogen) for nuclear staining, the cells were observed by an IX81 epifluorescence microscope (Olympus, Japan).
2.6. Flow cytometry
The U87MG cells were incubated with GO-PEG-DVDMS or DVDMS at DVDMS concentration of 1 μg/mL for 24 h. The cells were then washed and resuspended in PBS. The cells were measured by Accuri C6 flow cytometer using C Flow Plus software (BD, Ann Arbor, MI). The data were analyzed by FlowJo version 7.6.5 (FlowJo, Ashland, OR).
2.7. Cytotoxicity assay
The U87MG cells were seeded into 96-well plates (5 × 10³ cells per well) for 24 h, and then darkly incubated with different concentrations of free DVDMS, GO-PEG and GO-PEG-DVDMS at 37 °C. After 24 h incubation, cells were washed twice and 10 μL of MTT solution (5 mg/mL MTT in PBS, pH 7.4) was added to each well and the plate was incubated for another 4 h. After removing the medium, the wells were washed by PBS, and then the intracellular formazan crystals were dissolved into 100 μL DMSO. The absorbance was recorded at 490 nm by a plate reader, and the percentage of cell viability was determined by comparing cells treated with untreated control.
2.8. In vitro photodynamic therapy
The U87MG cells were grown in 96-well plates at a density of 5 × 10³ cells/well in MEM complete medium. The cells were incubated with GO-PEG-DVDMS or free DVDMS at different concentrations for 24 h. The wells were then washed with PBS for three times. 100 μL of fresh medium was added into each well, which were immediately irradiated by the 630 nm laser (5 J/well). After irradiation, the cells were kept for another 24 h. Cell viability was estimated by the standard MTT assay.
2.9. Tumor model
Athymic nude mice were obtained from Harlan laboratories (Frederick, USA) under protocols approved by the National Institutes of Health Clinical center Animal Care and Use Committee (NIH CC/ACUCC). The U87MG tumor models were generated by subcutaneous injection of 5×10⁶ cells in 100 μL PBS into the right shoulder of nude mice. The mice were used for fluorescence imaging and PDT when the tumor volume reached about 100 mm3.
2.10. In vivo enhanced fluorescence imaging of GO-PEG-DVDMS
Mice bearing U87MG xenografted tumors (n = 3/group) were intravenously injected with GO-PEG-DVDMS or free DVDMS (2 mg/kg of DVDMS) at the same concentration as control. Fluorescence images were taken by a Maestro II optical imaging system (Caliper Life Sciences, Hopkinton, MA) at 2, 6 and 24 h post-injection. Excitation wavelength is 455 nm. Emission wavelength cutoff is from 500 to 720 nm (10 nm steps). To analyze the biodistribution of GO-PEG-DVDMS, the mice were sacrificed at 24 h post-injection, and tumors and other major normal organs were collected and measured for fluorescence intensity.
2.11. In vivo photodynamic therapy
Mice bearing U87MG tumor were randomized into 6 groups (6 mice/group), i.e. GO-PEG-DVDMS laser group, DVDMS laser group, GO-PEG-DVDMS group, DVDMS group, GO-PEG group and control group. For treatment, the mice of control group received only saline solution whereas mice of the other groups received GO-PEG-DVDMS, DVDMS or GO-PEG with 2 mg/kg of DVDMS or 1 mg/kg of GO-PEG by tail vein injection. The tumors of laser groups were irradiated at 24 h post-injection with laser dose of 50 J. The tumor growth was monitored over 30 days after PDT treatment. Tumor size was monitored with a digital caliper every other day and tumor volume was calculated as volume = AB2/2, where A is the longer diameter and B is the shorter diameter. Relative tumor volumes were calculated as V/V0 (V0 was the tumor volume when the treatment was initiated). The body weights of all mice were measured every other day.
2.12. Ex vivo histological staining
At 24 h after PDT, tumors and major organs were collected from tumor bearing mice. Tissues were fixed in a 4% formaldehyde solution at room temperature. Haematoxylin and eosin (H&E) staining (BBC Biochemical, Mount Vernon, WA) was examined with a BX41 bright field microscopy (Olympus).
2.13. Statistical analysis
Quantitative data in all statistical analyses was set as mean ± SD, and the results were compared using Student’s t-test. P value of < 0.05 was considered statistically significant.
3. Results and Discussion
3.1 Synthesis and characterization of GO-PEG-DVDMS
GO was prepared using flake expandable graphite as the raw material by a modified Hummers method. Amine terminated eight-arm branched PEG was conjugated with GO sheets to improve their aqueous dispersibility, stability, and biocompatibility [48]. Subsequently, DVDMS was loaded onto the two accessible surfaces of GO via hydrophobic interactions and π-π stacking. Atomic force microscope (AFM) imaging showed that the size of GO-PEG was less than 50 nm and the thickness was ~1.5 nm (Fig. 1 A, C). After loading DVDMS, the thickness of GO-PEG-DVDMS increased to ~2 nm (Fig. 1B and C). The area of GO-PEG-DVDMS is about two times larger than that of GO-PEG (Fig. 1D). These quantifications confirm successful loading of DVDMS and indicates that DVDMS extends the area of and increases lateral association and stacking between GO-PEG nanosheets.
Figure 1.

(A) AFM image of GO-PEG. (B) AFM image of GO-PEG-DVDMS. (C) Thickness histogram of GO-PEG-DVDMS and GO-PEG nanosheets from AFM images. (D) Area histogram of GO-PEG-DVDMS and GO-PEG nanosheets from AFM images.
Optical absorption and fluorescence spectroscopy were used to analyze the interactions between GO-PEG and DVDMS. Fig. 2A shows the absorption spectra of GO-PEG, DVDMS and GO-PEG-DVDMS, respectively. GO-PEG has a virtual peak at 230 nm. The DVDMS exhibits a strong Soret absorption at 385 nm, and Q-bands between 500 and 700 nm. The UV-vis spectrum of GO-PEG-DVDMS presents a superimposition of DVDMS peaks with the absorption curve of GO-PEG, suggesting successful loading of DVDMS onto GO-PEG. However, the characteristic peaks of DVDMS loaded onto GO-PEG do not totally match with the peaks of pure DVDMS. We found that a new peak appeared at 430 nm. It may be due to the interaction of the two sterically hindered porphyrin rings of DVDMS molecules with the surface of GO, which makes one porphyrin ring attaching to the surface of GO, and the other one hanging out.
Figure 2.

(A) Absorption spectra of GO-PEG (blue), DVDMS (red) and GO-PEG-DVDMS (black) at GO-PEG concentration of 2.5 μg/mL and DVDMS concentration of 5 μg/mL. (B) Drug loading capacity of GO-PEG-DVDMS in different feeding concentrations of DVDMS while GO-PEG was fixed at concentration of 0.1 mg/mL.
The drug loading capacity of DVDMS in GO-PEG was quantified by using the DVDMS UV-vis calibration curve at 516 nm (Fig. 2B). With increasing concentrations of DVDMS, the DVDMS loading capacity reaches a maximum of 201.2% when DVDMS feed is 0.4 mg/mL. We chose 0.4 mg/mL DVDMS as the appropriate feeding concentration for all later experiments.
3.2. Spectroscopic properties of GO-PEG-DVDMS
To understand the photophysical and photochemical properties of GO-PEG-DVDMS, fluorescence spectra of GO-PEG-DVDMS and DVDMS were compared. As shown in Fig. 3A, DVDMS has two fluorescence emission peaks at 618 and 680 nm. At high concentration (150~200 μg/mL) of DVDMS, the fluorescence intensities were quenched due to the self-aggregation of nonpolar DVDMS (Fig. 3B). The emission peaks of DVDMS in GO-PEG-DVDMS are shifted to 644 and 670 nm (Fig. 3C). The fluorescence intensities of GO-PEG-DVDMS are about 3~8 times higher than that of DVDMS at different weight ratios of GO-PEG: DVDMS (0.1:1 ~ 2:1) (Fig. 3D). This phenomenon is very different from our previous reports [16, 24]. In our previous studies, the fluorescence of Ce6 or HPPH was drastically quenched by folic acid-conjugated GO and GO-PEG, respectively [16, 24]. Because both Ce6 and HPPH with single porphyrin ring allow them to be in good contact with the flat GO surface via strong π-π stacking and hydrophobic interactions, and form tight complexes with GO, leading to effective fluorescence quenching via an energy/charge transfer process. In the case of DVDMS, two sterically hindered porphyrin rings of DVDMS molecular may not contact with GO at the same time, which promises the intramolecular charge transfer from one porphyrin ring attached to the surface of GO to the other porphyrin ring that hangs out [40]. The fluorescence of loaded DVDMS is much enhanced via intramolecular charge transfer, which holds promises for real-time visualization of in vivo DVDMS delivery and distribution, and molecular imaging-guided PDT.
Figure 3.

(A) Fluorescence spectra of DVDMS at different concentrations. (B) Fluorescence intensity of DVDMS at different concentrations. (C) Fluorescence spectra of GO-PEG-DVDMS at different weight ratios of GO-PEG: DVDMS. DVDMS at 100 μg/mL, GO-PEG at 10 μg/mL, 50 μg/mL, 100 μg/mL and 200 μg/mL. (D) Fluorescence intensity of DVDMS at 620 nm and different mix ratios by GO-PEG-DVDMS at 640 nm.
3.3. Singlet oxygen detection
The photodynamic effect of GO-PEG-DVDMS was confirmed by measuring singlet oxygen using SOSG as a detector [4, 47]. As shown in Fig. 4, the fluorescence intensity of SOSG exhibits a time-dependent enhancement, indicating singlet oxygen generated from GO-PEG-DVDMS upon laser irradiation. The singlet oxygen generation of GO-PEG-DVDMS is slightly lower than that of DVDMS at the same concentration, which is still suitable for effective PDT.
Figure 4.

Fluorescence emission spectra of SOSG solutions with (A) DVDMS or (B) GO-PEG-DVDMS as a function of the laser irradiation time. (C) The fluorescence intensity increase of SOSG at 525 nm over time.
3.4. Cell uptake assay and flow cytometry
Next, we investigated the cellular uptake of GO-PEG-DVDMS and free DVDMS on U87MG cancer cells. The cells were darkly incubated with GO-PEG-DVDMS or free DVDMS (DVDMS, 1 μg/mL) for 24 h. The treated cells show time-dependent increase of fluorescence signals. With the increase of incubation time, clear red fluorescence signals are observed within the cells and the signal intensities increased. At 24 h, the cells present very strong fluorescence signal, suggesting high efficient intracellular accumulation of GO-PEG-DVDMS (Fig. 5A). To further quantify cellular uptake of GO-PEG-DVDMS, the flow cytometry was performed on the same treated cells (Fig. 5B). The mean fluorescence intensities of GO-PEG-DVDMS show a time-dependent increase. After 24 h incubation, the mean fluorescence intensity of DVDMS in GO-PEG-DVDMS system is 5-fold stronger than that in free DVDMS system. These results are in good agreement with the observation of fluorescence images.
Figure 5.

(A) Fluorescence images of U87MG cells incubated with GO-PEG-DVDMS or DVDMS (1 μg/mL DVDMS) for 24 h. Scale bars: 20 μm. (B) Flow cytometric analysis of mean fluorescence intensity (n = 10,000 cells) in U87MG cells incubated with DVDMS or GO-PEG-DVDMS (1 μg/mL of DVDMS) for 24 h.
3.5. Intracellular cytotoxicity and photodynamic therapy
The cytotoxicity of GO-PEG-DVDMS was assessed on U87MG cells by the standard MTT assay. Without DVDMS loading, GO-PEG did not show dark toxicity. The cell viability is 89.2% even at a concentration of 2.5 μg/mL of GO-PEG (Fig. 6A). However, both DVDMS and GO-PEG-DVDMS showed dose-dependent dark toxicity to cells in the range of 0.3~5 μg/mL of DVDMS (Fig. 6A). In Fig. 6B, GO-PEG-DVDMS showed better PDT effect than DVDMS. Upon 630 nm laser irradiation, after 24 incubation, the cells treated with GO-PEG-DVDMS exhibited significantly higher cell death than that treated with DVDMS at all tested concentrations. At the dose of 5 μg/mL of DVDMS, nearly all the cells were dead after laser irradiation in GO-PEG-DVDMS group. The similar results were also proved by Calcein AM/Propidium iodide staining to differentiate the live cells (green color) and dead cells (red color) (Fig. 6C). It is reasonable to deduce that the increased cell killing was resulted from complexation of DVDMS with GO-PEG since GO-PEG-DVDMS showed much higher cell uptake than DVDMS.
Figure 6.

(A) Relative viability of cells incubated with various concentrations of free GO-PEG, DVDMS or GO-PEG-DVDMS. (B) Relative viability of cells incubated with various concentrations of free DVDMS, GO-PEG, or GO-PEG-DVDMS after irradiation by 630 nm laser (2 J). (C) Fluorescence images of Calcein AM/Ethidium homodimer-1stained U87MG cells incubated with fresh medium, 0.5 μg/mL or 5 μg/mL of GO-PEG-DVDMS for 24 h after laser irradiation (2 J). Scale bars: 100 μm.
3.6. In vivo fluorescence imaging
When the tumors reached 100 mm3, the mice were administered with GO-PEG-DVDMS or free DVDMS (2 mg/kg of DVDMS) via tail vein. As shown in Fig. 7A, fluorescence signal was mostly observed in the tumor area of the GO-PEG-DVDMS treated mice. As a comparison, free DVDMS group showed high signal throughout the body, especially in the skin. At 24 h after injection, the organs of GO-PEG-DVDMS treated mice were harvested for ex vivo imaging to study the biodistribution (Fig. 7B). The results showed that GO-PEG-DVDMS preferentially accumulated at the tumor sites, likely due to the strong EPR effect.
Figure 7.
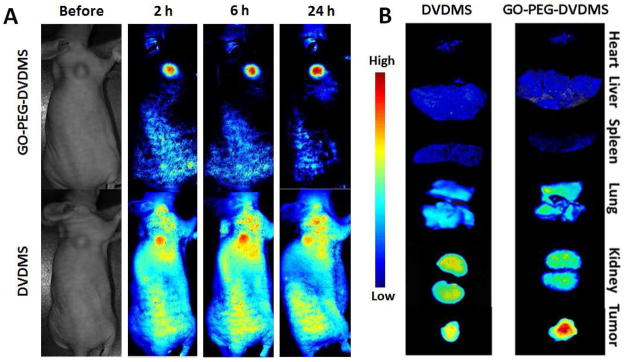
(A) In vivo distributions of GO-PEG-DVDMS and DVDMS visualized by using a molecular imaging system before and 2 h, 6 h and 24 h after intravenous administration DVDMS 2 mg/kg). (B) Ex vivo near-infrared (NIR) fluorescence images of tumor and major organs collected at 24 h after DVDMS or GO-PEG-DVDMS injection.
3.7. In vivo photodynamic therapy
For in vivo PDT study, U87MG tumor-bearing mice (5 mice/group) were intravenously injected with GO-PEG-DVDMS or DVDMS at the dose of 2 mg/kg of DVDMS. Twenty-four hours later, the tumors were irradiated with the 630 nm laser at a laser dose of 50 J. Tumors treated with GO-PEG-DVDMS and laser irradiation were effectively ablated 2 days later, leaving black scars at the original tumor sites, which were fully recovered about 10 days after treatment (Fig. 8A and C). For DVDMS treatment group with laser irradiation, the tumors were partially damaged and exhibited delayed tumor growth compared with the control groups (Fig. 8A and C). In contrast, the tumors in the control groups all grow at a similar speed, suggesting that neither laser irradiation alone nor GO-PEG-DVDMS or DVDMS without laser irradiation inhibited tumor growth. Mice in the four control groups showed a life span of 12 days, and mice treated from DVDMS laser group showed average life span of 22 days. However all the mice of the GO-PEG-DVDMS laser group showed life span longer than 30 days (Fig. 8C). No obvious sign of toxicity, such as significant body weight drop, was noticed during this period of observation (Fig. S1).
Figure 8.

(A) Representative photos of U87MG tumor-bearing mice from different groups at day 10 after treatment. (B) Representative H&E stained images (200 X) of excised tumors 24 h after laser irradiation. (C) Tumor growth curves of different groups of tumor-bearing mice after treatment. (D) The Kaplan-Meier survival curves of different groups of tumor-bearing mice after treatment.
3.8. Histology examination
Hematoxylin and eosin (H&E) staining of tumor sections were collected from all groups of mice at 24 h after laser irradiation. The GO-PEG-DVDMS laser treated group showed more cell necrosis on the examined tumor sections comparing with DVDMS laser group, including shrunk malignant cells, loss of contact, eosinophilic cytoplasm, and nucleus damage (Fig. 8B). The tumor specimens from control groups showed no difference regarding the size and shape, nuclear modifications, or necrosis of the cells. H&E stained images of main organs from different groups of mice indicated no obvious damage or inflammation after GO-PEG-DVDMS administration and laser irradiation, which suggests that circulating GO-PEG-DVDMS does not induce appreciable toxic side effects to the treated animals (Fig. S2).
4. Conclusion
In summary, we successfully developed a novel photo-theranostic platform based on sinoporphyrin sodium (DVDMS) photosensitizer-loaded PEGylated GO (GO-PEG-DVDMS) for enhanced fluorescence imaging guided PDT. The fluorescence property of DVDMS was significantly enhanced after GO-PEG loading via intramolecular charge transfer, which facilitates enhanced fluorescence imaging. Meanwhile, GO-PEG can improve the tumor accumulation efficiency of DVDMS compared to free DVDMS. We validated the strong phototodynamic effect of GO-PEG-DVDMS through the fluorescence imaging-guided PDT with improved efficacy. Our study highlights the great potential of GO-PEG-DVDMS for high efficacy cancer treatment by integrating nanodrug delivery, in vivo imaging, and photodynamic therapy.
Supplementary Material
Figure S1. Body weight curve of U87MG tumor-bearing mice after treatment.
Figure S2. Representative H&E stained images (200x magnification) of major organs including the heart, liver, spleen, lung and kidneys collected from each group. The dose of GO-PEG-DVDMS was 2 mg/kg of DVDMS.
Acknowledgments
This work was supported, in part, by the National Basic Research Program of China (2013CB733802, 2014CB744503, 2015CB931800 and 2015CB931803), National Natural Science Foundation of China (81371596, 81401465, 81130028, 31210103913), the Key Grant Project of Heilongjiang Province (GA12C302), the Ph.D. Programs Foundation of Ministry of Education of China (201123071100203), the Key Laboratory of Molecular Imaging Foundation(College of Heilongjiang Province) and by the intramural research program of the National Institute of Biomedical Imaging and Bioengineering (NIBIB), National Institutes of Health (NIH).
Footnotes
Publisher's Disclaimer: This is a PDF file of an unedited manuscript that has been accepted for publication. As a service to our customers we are providing this early version of the manuscript. The manuscript will undergo copyediting, typesetting, and review of the resulting proof before it is published in its final citable form. Please note that during the production process errors may be discovered which could affect the content, and all legal disclaimers that apply to the journal pertain.
References
- 1.Lovell JF, Liu TW, Chen J, Zheng G. Activatable photosensitizers for imaging and therapy. Chem Rev. 2010;110:2839–57. doi: 10.1021/cr900236h. [DOI] [PubMed] [Google Scholar]
- 2.Rai P, Mallidi S, Zheng X, Rahmanzadeh R, Mir Y, Elrington S, et al. Development and applications of photo-triggered theranostic agents. Adv Drug Deliv Rev. 2010;62:1094–124. doi: 10.1016/j.addr.2010.09.002. [DOI] [PMC free article] [PubMed] [Google Scholar]
- 3.Lovell JF, Jin CS, Huynh E, Jin H, Kim C, Rubinstein JL, et al. Porphysome nanovesicles generated by porphyrin bilayers for use as multimodal biophotonic contrast agents. Nat Mater. 2011;10:324–32. doi: 10.1038/nmat2986. [DOI] [PubMed] [Google Scholar]
- 4.Huang P, Lin J, Wang X, Wang Z, Zhang C, He M, et al. Light-triggered theranostics based on photosensitizer-conjugated carbon dots for simultaneous enhanced-fluorescence imaging and photodynamic therapy. Adv Mater. 2012;24:5104–10. doi: 10.1002/adma.201200650. [DOI] [PMC free article] [PubMed] [Google Scholar]
- 5.Celli JP, Spring BQ, Rizvi I, Evans CL, Samkoe KS, Verma S, et al. Imaging and photodynamic therapy: mechanisms, monitoring, and optimization. Chem Rev. 2010;110:2795–838. doi: 10.1021/cr900300p. [DOI] [PMC free article] [PubMed] [Google Scholar]
- 6.Josefsen LB, Boyle RW. Unique diagnostic and therapeutic roles of porphyrins and phthalocyanines in photodynamic therapy, imaging and theranostics. Theranostics. 2012;2:916–66. doi: 10.7150/thno.4571. [DOI] [PMC free article] [PubMed] [Google Scholar]
- 7.Huang P, Lin J, Wang S, Zhou Z, Li Z, Wang Z, et al. Photosensitizer-conjugated silica-coated gold nanoclusters for fluorescence imaging-guided photodynamic therapy. Biomaterials. 2013;34:4643–54. doi: 10.1016/j.biomaterials.2013.02.063. [DOI] [PMC free article] [PubMed] [Google Scholar]
- 8.Dougherty TJ, Gomer CJ, Henderson BW, Jori G, Kessel D, Korbelik M, et al. Photodynamic therapy. J Natl Cancer Inst. 1998;90:889–905. doi: 10.1093/jnci/90.12.889. [DOI] [PMC free article] [PubMed] [Google Scholar]
- 9.Chen J, Keltner L, Christophersen J, Zheng F, Krouse M, Singhal A, et al. New technology for deep light distribution in tissue for phototherapy. Cancer J. 2002;8:154–63. doi: 10.1097/00130404-200203000-00009. [DOI] [PubMed] [Google Scholar]
- 10.Sun Y, Chen ZL, Yang XX, Huang P, Zhou XP, Du XX. Magnetic chitosan nanoparticles as a drug delivery system for targeting photodynamic therapy. Nanotechnology. 2009;20:135102. doi: 10.1088/0957-4484/20/13/135102. [DOI] [PubMed] [Google Scholar]
- 11.Chen ZL, Sun Y, Huang P, Yang XX, Zhou XP. Studies on preparation of photosensitizer loaded magnetic silica nanoparticles and their anti-tumor effects for targeting photodynamic therapy. Nanoscale Res Lett. 2009;4:400–8. doi: 10.1007/s11671-009-9254-5. [DOI] [PMC free article] [PubMed] [Google Scholar]
- 12.Bechet D, Couleaud P, Frochot C, Viriot M-L, Guillemin F, Barberi-Heyob M. Nanoparticles as vehicles for delivery of photodynamic therapy agents. Trends Biotechnol. 2008;26:612–21. doi: 10.1016/j.tibtech.2008.07.007. [DOI] [PubMed] [Google Scholar]
- 13.Wang S, Gao R, Zhou F, Selke M. Nanomaterials and singlet oxygen photosensitizers: potential applications in photodynamic therapy. J Mater Chem. 2004;14:487–93. [Google Scholar]
- 14.Lin J, Wang S, Huang P, Wang Z, Chen S, Niu G, et al. Photosensitizer-loaded gold vesicles with strong plasmonic coupling effect for imaging-guided photothermal/photodynamic therapy. ACS Nano. 2013;7:5320–9. doi: 10.1021/nn4011686. [DOI] [PMC free article] [PubMed] [Google Scholar]
- 15.Huang P, Li Z, Lin J, Yang D, Gao G, Xu C, et al. Photosensitizer-conjugated magnetic nanoparticles for in vivo simultaneous magnetofluorescent imaging and targeting therapy. Biomaterials. 2011;32:3447–58. doi: 10.1016/j.biomaterials.2011.01.032. [DOI] [PubMed] [Google Scholar]
- 16.Huang P, Xu C, Lin J, Wang C, Wang X, Zhang C, et al. Folic acid-conjugated graphene oxide loaded with photosensitizers for targeting photodynamic therapy. Theranostics. 2011;1:240–50. doi: 10.7150/thno/v01p0240. [DOI] [PMC free article] [PubMed] [Google Scholar]
- 17.Wang S, Huang P, Nie L, Xing R, Liu D, Wang Z, et al. Single continuous wave laser induced photodynamic/plasmonic photothermal therapy using photosensitizer-functionalized gold nanostars. Adv Mater. 2013;25:3055–61. doi: 10.1002/adma.201204623. [DOI] [PMC free article] [PubMed] [Google Scholar]
- 18.Zhu Z, Tang Z, Phillips JA, Yang R, Wang H, Tan W. Regulation of singlet oxygen generation using single-walled carbon nanotubes. J Am Chem Soc. 2008;130:10856–7. doi: 10.1021/ja802913f. [DOI] [PubMed] [Google Scholar]
- 19.Wang J, Zhu G, You M, Song E, Shukoor MI, Zhang K, et al. Assembly of aptamer switch probes and photosensitizer on gold nanorods for targeted photothermal and photodynamic cancer therapy. ACS Nano. 2012;6:5070–7. doi: 10.1021/nn300694v. [DOI] [PMC free article] [PubMed] [Google Scholar]
- 20.Wang J, You M, Zhu G, Shukoor MI, Chen Z, Zhao Z, et al. Photosensitizer–gold nanorod composite for targeted multimodal therapy. Small. 2013;9:3678–84. doi: 10.1002/smll.201202155. [DOI] [PMC free article] [PubMed] [Google Scholar]
- 21.Liu J, Wang C, Jiang Y, Hu Y, Li J, Yang S, et al. Graphene signal amplification for sensitive and real-time fluorescence anisotropy detection of small molecules. Anal Chem. 2013;85:1424–30. doi: 10.1021/ac3023982. [DOI] [PubMed] [Google Scholar]
- 22.Liu F, Zhou X, Chen Z, Huang P, Wang X, Zhou Y. Preparation of purpurin-18 loaded magnetic nanocarriers in cottonseed oil for photodynamic therapy. Mater Lett. 2008;62:2844–7. [Google Scholar]
- 23.Tian B, Wang C, Zhang S, Feng L, Liu Z. Photothermally enhanced photodynamic therapy delivered by nano-graphene oxide. ACS Nano. 2011;5:7000–9. doi: 10.1021/nn201560b. [DOI] [PubMed] [Google Scholar]
- 24.Rong P, Yang K, Srivastan A, Kiesewetter DO, Yue X, Wang F, et al. Photosensitizer loaded nano-graphene for multimodality imaging guided tumor photodynamic therapy. Theranostics. 2014;4:229–39. doi: 10.7150/thno.8070. [DOI] [PMC free article] [PubMed] [Google Scholar]
- 25.Jang B, Choi Y. Photosensitizer-conjugated gold nanorods for enzyme-activatable fluorescence imaging and photodynamic therapy. Theranostics. 2012;2:190–7. doi: 10.7150/thno.3478. [DOI] [PMC free article] [PubMed] [Google Scholar]
- 26.Tang L, Chang H, Liu Y, Li J. Duplex DNA/graphene oxide biointerface: from fundamental understanding to specific enzymatic effects. Adv Funct Mater. 2012;22:3083–8. [Google Scholar]
- 27.Wang K, Ruan J, Song H, Zhang J, Wo Y, Guo S, et al. Biocompatibility of graphene oxide. Nanoscale Res Lett. 2011;6:8. doi: 10.1007/s11671-010-9751-6. [DOI] [PMC free article] [PubMed] [Google Scholar]
- 28.Zhang J, Zhang F, Yang H, Huang X, Liu H, Zhang J, et al. Graphene oxide as a matrix for enzyme immobilization. Langmuir. 2010;26:6083–5. doi: 10.1021/la904014z. [DOI] [PubMed] [Google Scholar]
- 29.Zhang Y, Nayak TR, Hong H, Cai W. Graphene: a versatile nanoplatform for biomedical applications. Nanoscale. 2012;4:3833–42. doi: 10.1039/c2nr31040f. [DOI] [PMC free article] [PubMed] [Google Scholar]
- 30.Shi S, Yang K, Hong H, Valdovinos HF, Nayak TR, Zhang Y, et al. Tumor vasculature targeting and imaging in living mice with reduced graphene oxide. Biomaterials. 2013;34:3002–9. doi: 10.1016/j.biomaterials.2013.01.047. [DOI] [PMC free article] [PubMed] [Google Scholar]
- 31.Hong H, Yang K, Zhang Y, Engle JW, Feng L, Yang Y, et al. In vivo targeting and imaging of tumor vasculature with radiolabeled, antibody-conjugated nanographene. ACS Nano. 2012;6:2361–70. doi: 10.1021/nn204625e. [DOI] [PMC free article] [PubMed] [Google Scholar]
- 32.Chung C, Kim Y-K, Shin D, Ryoo S-R, Hong BH, Min D-H. Biomedical applications of graphene and graphene oxide. Acc Chem Res. 2013;46:2211–24. doi: 10.1021/ar300159f. [DOI] [PubMed] [Google Scholar]
- 33.Kim Y-K, Na H-K, Kwack S-J, Ryoo S-R, Lee Y, Hong S, et al. Synergistic effect of graphene oxide/MWCNT films in laser desorption/ionization mass spectrometry of small molecules and tissue imaging. ACS Nano. 2011;5:4550–61. doi: 10.1021/nn200245v. [DOI] [PubMed] [Google Scholar]
- 34.Sun X, Liu Z, Welsher K, Robinson JT, Goodwin A, Zaric S, et al. Nano-graphene oxide for cellular imaging and drug delivery. Nano Res. 2008;1:203–12. doi: 10.1007/s12274-008-8021-8. [DOI] [PMC free article] [PubMed] [Google Scholar]
- 35.Yang K, Zhang S, Zhang G, Sun X, Lee ST, Liu Z. Graphene in mice: ultrahigh in vivo tumor uptake and efficient photothermal therapy. Nano Lett. 2010;10:3318–23. doi: 10.1021/nl100996u. [DOI] [PubMed] [Google Scholar]
- 36.Yang K, Feng L, Hong H, Cai W, Liu Z. Preparation and functionalization of graphene nanocomposites for biomedical applications. Nat Protoc. 2013;8:2392–403. doi: 10.1038/nprot.2013.146. [DOI] [PMC free article] [PubMed] [Google Scholar]
- 37.Shen H, Zhang L, Liu M, Zhang Z. Biomedical applications of graphene. Theranostics. 2012;2:283–94. doi: 10.7150/thno.3642. [DOI] [PMC free article] [PubMed] [Google Scholar]
- 38.Chang H, Tang L, Wang Y, Jiang J, Li J. Graphene fluorescence resonance energy transfer aptasensor for the thrombin detection. Anal Chem. 2010;82:2341–6. doi: 10.1021/ac9025384. [DOI] [PubMed] [Google Scholar]
- 39.Jang H, Kim YK, Kwon HM, Yeo WS, Kim DE, Min DH. A graphene-based platform for the assay of duplex-DNA unwinding by helicase. Angew Chem Int Ed Engl. 2010;122:5839–43. doi: 10.1002/ange.201001332. [DOI] [PMC free article] [PubMed] [Google Scholar]
- 40.Geng J, Zhou L, Liu B. Graphene oxide enhanced fluorescence of conjugated polyelectrolytes with intramolecular charge transfer characteristics. Chem Commun (Camb) 2013;49:4818–20. doi: 10.1039/c3cc41806e. [DOI] [PubMed] [Google Scholar]
- 41.Zhou L, Wang W, Tang J, Zhou JH, Jiang HJ, Shen J. Graphene oxide noncovalent photosensitizer and its anticancer activity in vitro. Chem Eur J. 2011;17:12084–91. doi: 10.1002/chem.201003078. [DOI] [PubMed] [Google Scholar]
- 42.Zhou L, Jiang H, Wei S, Ge X, Zhou J, Shen J. High-efficiency loading of hypocrellin B on graphene oxide for photodynamic therapy. Carbon. 2012;50:5594–604. [Google Scholar]
- 43.Hu J, Wang X, Zhang K, Wang P, Su X, Li Y, et al. Sinoporphyrin sodium: a novel sensitizer in sonodynamic therapy. Anticancer Drugs. 2014;25:174–82. doi: 10.1097/CAD.0000000000000031. [DOI] [PubMed] [Google Scholar]
- 44.Wang H, Wang X, Zhang S, Wang P, Zhang K, Liu Q. Sinoporphyrin sodium, a novel sensitizer, triggers mitochondrial-dependent apoptosis in ECA-109 cells via production of reactive oxygen species. Int J Nanomed. 2014;9:3077–90. doi: 10.2147/IJN.S59302. [DOI] [PMC free article] [PubMed] [Google Scholar]
- 45.Hummers WS, Jr, Offeman RE. Preparation of graphitic oxide. J Am Chem Soc. 1958;80:1339. [Google Scholar]
- 46.Sun Z, Huang P, Tong G, Lin J, Jin A, Rong P, et al. VEGF-loaded graphene oxide as theranostics for multi-modality imaging-monitored targeting therapeutic angiogenesis of ischemic muscle. Nanoscale. 2013;5:6857–66. doi: 10.1039/c3nr01573d. [DOI] [PMC free article] [PubMed] [Google Scholar]
- 47.Lin H, Shen Y, Chen D, Lin L, Wilson BC, Li B, et al. Feasibility study on quantitative measurements of singlet oxygen generation using singlet oxygen sensor green. J Fluoresc. 2013;23:41–7. doi: 10.1007/s10895-012-1114-5. [DOI] [PubMed] [Google Scholar]
- 48.Yang K, Wan J, Zhang S, Tian B, Zhang Y, Liu Z. The influence of surface chemistry and size of nanoscale graphene oxide on photothermal therapy of cancer using ultra-low laser power. Biomaterials. 2012;33:2206–14. doi: 10.1016/j.biomaterials.2011.11.064. [DOI] [PubMed] [Google Scholar]
Associated Data
This section collects any data citations, data availability statements, or supplementary materials included in this article.
Supplementary Materials
Figure S1. Body weight curve of U87MG tumor-bearing mice after treatment.
Figure S2. Representative H&E stained images (200x magnification) of major organs including the heart, liver, spleen, lung and kidneys collected from each group. The dose of GO-PEG-DVDMS was 2 mg/kg of DVDMS.