

Significance
In patients with acute ischemic stroke (AIS), the abrupt and massive influx of lymphocytes from the periphery to the ischemic region orchestrates focal inflammatory responses, catalyzes tissue death, and worsens clinical outcomes. In this early phase clinical study, we reduced lymphocyte migration to the brain during the first 72 h of AIS via oral administration of three doses of fingolimod. This administration led to a significant reduction of secondary lesion enlargement, microvascular permeability, and better clinical outcomes during the acute phase and 3-mo follow-up visit. This study will provoke new investigations on the efficacy of modulation of brain inflammation in AIS.
Keywords: acute ischemic stroke, immune modulation, fingolimod
Abstract
Peripheral lymphocytes entering brain ischemic regions orchestrate inflammatory responses, catalyze tissue death, and worsen clinical outcomes of acute ischemic stroke (AIS) in preclinical studies. However, it is not known whether modulating brain inflammation can impact the outcome of patients with AIS. In this open-label, evaluator-blinded, parallel-group clinical pilot trial, we recruited 22 patients matched for clinical and MRI characteristics, with anterior cerebral circulation occlusion and onset of stroke that had exceeded 4.5 h, who then received standard management alone (controls) or standard management plus fingolimod (FTY720, Gilenya, Novartis), 0.5 mg per day orally for 3 consecutive days. Compared with the 11 control patients, the 11 fingolimod recipients had lower circulating lymphocyte counts, milder neurological deficits, and better recovery of neurological functions. This difference was most profound in the first week when reduction of National Institutes of Health Stroke Scale was 4 vs. −1, respectively (P = 0.0001). Neurological rehabilitation was faster in the fingolimod-treated group. Enlargement of lesion size was more restrained between baseline and day 7 than in controls (9 vs. 27 mL, P = 0.0494). Furthermore, rT1%, an indicator of microvascular permeability, was lower in the fingolimod-treated group at 7 d (20.5 vs. 11.0; P = 0.005). No drug-related serious events occurred. We conclude that in patients with acute and anterior cerebral circulation occlusion stroke, oral fingolimod within 72 h of disease onset was safe, limited secondary tissue injury from baseline to 7 d, decreased microvascular permeability, attenuated neurological deficits, and promoted recovery.
The devastating, often crippling aftermath of stroke makes it second only to cardiac ischemia as a cause of death worldwide. Therapy for acute ischemic stroke (AIS) centers first on rapid revascularization of arterial territories, with additional focus on the management of blood pressure and cerebral edema. Revascularization is currently achieved by the intravenous administration of tissue plasminogen activator (tPA) and intravascular therapy. However, the benefit of tPA is highly time-dependent, considering that pooled analysis has documented loss of benefit beyond 4.5 h from onset of symptoms (1, 2). This narrow time window renders only about 2–5% of stroke patients eligible for tPA (3). Data from five randomized controlled trials that have been published in the past year show that endovascular therapy has provided no benefit over tPA injected intravenously (4). Therefore, a significant hiatus exists during which no means of effective medical management is available for patients with AIS. Moreover, despite numerous clinical trials conducted to salvage cells from death, no significant breakthrough has been made to improve the outcome of stroke patients (5, 6).
Injured and dying cells during brain hypoxia, after cessation of blood and oxygen supply activates the innate and adaptive immune systems, compromise the blood–brain barrier (BBB) and lead to a massive migration of peripheral leukocytes into the brain (7, 8). Cell types most frequently known to enter the brain during AIS belong to the CD4+ T-cell, CD8+ T-cell, neutrophil, and macrophage, and natural killer (NK) cell subpopulations. Such cells, as infiltrate within the peri-infarcted areas of brain tissues from AIS patients (9, 10), become intimately involved in all stages of the ischemic cascade (7, 8). Studies in experimental stroke have indicated that all these cells contribute to the death of ischemic neurons by promoting focal inflammatory reactions, direct killing, triggering of antigen-specific immune responses, or alterations in neuronal excitability (6, 10–12).
The amplification of initial brain injury by inflammatory and immune reactions continues well beyond the initial 4.5 h of stroke onset (therapeutic window for tPA), and that prolonged response provides a window of opportunity for blocking the secondary events that expand infarction caused by cells of the immune system. Because the extended detrimental impact on stroke-affected sites is likely a coordinated event mediated by multiple cellular and soluble elements of the immune system, the question arises as to whether these events offer a unique target for altering the related outcome. Indeed, among a number of strategies tested to modulate the immune system in this context (12–14), fingolimod emerges as a very promising candidate, presumably because of its action on many lymphocyte subsets bearing the sphinogosine-1-phosphate receptor (S1PR). Fingolimod acts as a S1PR modulator that inhibits the egress of lymphocytes from lymph nodes and limits their recirculation (15, 16). By reducing the trafficking of T cells, B cells, NK cells, and other S1PR-bearing cells into the central nervous system (CNS) (14, 17), thereby reducing relapses as well as brain volume loss, fingolimod became the first oral therapy approved by the Food and Drug Administration for the relapsing form of multiple sclerosis (MS) (18). This compound’s ability to enhance the BBB’s integrity (19) and its direct effects on the CNS (17) are also expected to alleviate infarctions and promote cell regeneration. Indeed, demonstration of the beneficial effect of fingolimod on multiple experimental models of stroke by independent groups establishes a foundation for clinical translation (12–14, 20–26). The goal of this study is to provide preliminary results as to the safety, feasibility, and efficacy of fingolimod for patients with AIS.
Results
Baseline Characteristics.
A total of 22 patients with AIS enrolled directly into this trial (Fig. 1). There was no mortality, no loss during follow-up, and no drop-outs during the study. The mean time from disease onset to fingolimod treatment was 20 ± 15 h. Four patients received fingolimod treatment between 7 and 12 h after enrollment, five patients between 13 and 24 h, one at 32 h, and one at 62 h. The average mean time to admission of the control group was 29 ± 21 h. The 11 fingolimod-treated patients had a mean age of 62.3 ± 8.0 y and a male:female ratio of 8:3. The control group of 11 patients had a mean age of 54.7 ± 11 and a male:female ratio of 9:2. Demographic, clinical, and radiological characteristics are shown in the Table 1. At baseline, brain lesion volume and location on MRI from 22 patients were paired to match each other with our best effort (P = 0.4553, paired t test). Furthermore, no differences in age, stroke etiology, National Institutes of Health Stroke Scale (NIHSS), lesion volume, or location were detected between the two groups (Table 1).
Fig. 1.

Effects of fingolimod in patients with AIS: trial profile. Twenty-two patients with AIS, who exceeded therapeutic window for tPA upon enrollment, were assigned into one of two groups with matched clinical characteristics and subtypes of infarct. All were treated with conventional stroke management and half (n = 11) also received fingolimod (FTY720, Gilenya, Novartis) 0.5 mg orally once daily for 3 consecutive days at the indicated time points. Counts of circulating lymphocyte subsets were monitored by flow cytometry. Clinical assessments (NIHSS, mRS, and mBI) were conducted at the indicated time points. Alterations of infarct volume and microvascular permeability were measured by MRI at the indicated time points.
Table 1.
Baseline characteristics and timing of treatment
| Variable | Control (n = 11) | Fingolimod (n = 11) | P value |
| Age (y) | 54.7 ± 11.0 | 62.3 ± 8.0 | 0.07 |
| Female, n (%) | 2 (18) | 3 (27) | 1.00 |
| Previous stroke | 2 (18) | 2 (18) | 1.00 |
| Risk factors and other diseases, n (%) | |||
| Heart disease | 1 (9) | 3 (27) | 0.59 |
| Hypertension | 9 (82) | 6 (55) | 0.36 |
| Hyperlipidemia | 4 (36) | 3 (27) | 1.00 |
| Smoking | 5 (45) | 4 (36) | 1.00 |
| Renal failure | 0 (0) | 1 (9) | 1.00 |
| Diabetes mellitus | 2 (18) | 2 (18) | 1.00 |
| Etiology*, n (%) | |||
| Subtype 1: atheromatosis | 8 (73) | 8 (73) | 1.00 |
| Subtype 2: embolus | 0 (0) | 0 (0) | 1.00 |
| Subtype 3: lacunar infarct | 3 (27) | 3 (27) | 1.00 |
| Subtype 4: other causes | 0 (0) | 0 (0) | 1.00 |
| Subtype 5: undetermined | 0 (0) | 0 (0) | 1.00 |
| Location†, n (%) | |||
| Total anterior circulation | 1 (9) | 1 (9) | 1.00 |
| Partial anterior circulation | 7 (64) | 7 (64) | 1.00 |
| Lacunar syndrome | 3 (27) | 3 (27) | 1.00 |
| NIHSS on admission | 9.0 ± 2.6 | 11.0 ± 5.6 | 0.30 |
| Infarct volume on admission (mL) | 60 ± 86 | 61 ± 89 | 0.97 |
| Time to enrollment (h) | 29 ± 21 | 20 ± 15 | 0.27 |
Plus-minus values are means ± SD.
Trial of Org 10172 in Acute Stroke Treatment classification.
Oxfordshire Community Stroke Project classification.
Dynamics of Lymphocyte Subset Counts During Fingolimod Treatment.
At baseline, the numbers of CD4+ T, CD8+ T, CD19+ B, and CD56+ NK cells in fingolimod-treated patients were similar to those of controls. Variable but steady reductions of these cell counts were recorded on day 1 after fingolimod administration and on subsequent days 3 and 7 (Fig. 2). At the 3-mo follow-up, the total lymphocyte counts remained comparable with baseline levels for all fingolimod-treated individuals (1.8 ± 0.3 vs. 1.9 ± 0.1 × 10⁶/mL, P = 0.86) and the numbers of CD4+ T, CD8+ T, CD19+ B, and CD56+ NK cells in fingolimod-treated patients returned to normal levels.
Fig. 2.
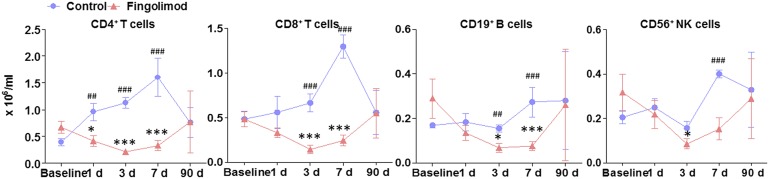
Dynamics of lymphocyte subset counts during fingolimod treatment. Blood was draw from patients at the baseline (20 ± 15 h) and at 1, 3, 7, and 90 d after first dose of fingolimod. Blood was drawn from control subjects at the same time points. Mononuclear cells were purified and stained with antibodies to cells. Percentages of CD4+ T cells, CD8+ T cells, CD19+ B cells, and CD56+ NK cells were determined by flow cytometry; absolute numbers were calculated, and as × 106/mL of blood for patients. *P < 0.05, **P < 0.01, ***P < 0.001 versus baseline of fingolimod-treated patients and #P < 0.05, ##P < 0.01, ###P < 0.001 versus control at same time point. Mean ± SE is shown.
Clinical Outcomes.
Baseline and follow-up clinical assessments are shown in Fig. 3. Recipients of fingolimod exhibited only mild neurological deficits, and most related functions improved profoundly in the first posttreatment week. Specific comparison of values during the first week revealed that control patients registered mean NIHSS score increases from 9 to 10. In sharp contrast, patients treated with fingolimod had a mean NIHSS score that decreased from 11 to 7. This NIHSS score change reached the level of statistically significant difference between the two groups (4 ± 0.3 vs. −1 ± 0.4, P = 0.0001) (Fig. 3 A and B). Moreover, improvement in neurological functions was more prominent in fingolimod-treated patients with total or partial anterior circulation occlusion than those with lacunar infarction (80% vs. 0%, P = 0.02, improved by 4 or more on NIHSS score in the first week). The results that NIHSS scores were significantly lower in the fingolimod-treated group compared with control at 90 d (1.7 ± 0.8 vs. 5.8 ± 1.7, P = 0.02), modified Barthel Index (mBI) scores were significantly higher in the fingolimod-treated group compared with control at 90 d (62 ± 11 vs. 87 ± 8, P = 0.0049), and modified Rankin Scale (mRS) 0–1 at 90 d was 0% in the control group, compared with 73% in the fingolimod treatment group (P = 0.009), which implies that fingolimod promoted rehabilitation in patients with AIS.
Fig. 3.

Clinical outcomes in control and fingolimod-treated groups. (A) Trends of NIHSS scores from control and fingolimod-treated patients at the indicated time points. (B) Sharp contrasts are clear in NIHSS changes for control and fingolimod-treated subjects in the first week. (C) The comparison of mBI between groups. (D) The comparison of mRS between groups.
Lesion Volume and Microvascular Permeability of Lesion.
The dynamic nature of progressive ischemic injury in acute stroke patients develops over hours to days. A local inflammatory response after stroke may contribute to secondary lesion extention and worsened clinical outcome. Lesions on fast fluid attenuated inversion recovery (FLAIR) could be mixed with edema on day 7 that would vanish on day 30 (27). Because inflammatory response at this stage would be the presumed target of fingolimod, brain lesions on day 7, were therefore chosen as the primary end point. All patients in this study were assessed for this parameter at baseline and after 7 ± 1 d. Lesion volumes on diffusion-weighted imaging (DWI) were one-to-one matched to the best of our efforts in the fingolimod-treated group and control group at baseline (61 ± 27 vs. 60 ± 26, P = 0.97) (Fig. 4). Notably, 7 d later the lesion volume on FLAIR in the fingolimod-treated group was smaller than in the control group, but this effect was not significant, presumably because of a large floor effect (70 ± 26 vs. 85 ± 30, P = 0.69) (Fig. 4). However, the enlargement of lesion volume was significantly confined in fingolimod-treated patients compared to controls between baseline and day 7 (9 ± 3 vs. 27 ± 8, P = 0.0494) (Fig. 4). Moreover, this change was notably more prominent in those fingolimod-treated patients with total or partial circulation occlusion (12 ± 4 vs. 36 ± 10, P = 0.04). In addition, the ratio of infarct volume extension (infarct volume change from baseline to day 7/infarct volume at baseline) in fingolimod-treated patients was significantly smaller than controls (15.2 ± 4.2 vs. 41.6 ± 4.5, P = 0.0003). These results suggest that fingolimod was probably responsible for inhibiting the extension of lesion volume or shortening inflammation duration with early phase peak in their lesions in AIS patients from the onset of symptoms to 7 d (Fig. 4), and imply that fingolimod limited the progression of the secondary injury in acute stroke patients.
Fig. 4.

Impact of fingolimod on lesion volumes and vascular permeability in patients and representative MRIs. (A) Representative MRI scans showed an acute right hemisphere infarct in control (Upper) and a fingolimod-treated patient (Lower). At day 7, striking differences were evident in that the infarct volume enlarged in the control patient, and signal intensity was relatively high in FLAIR. In contrast, the infarct volume progress was restrained in our fingolimod-treated patient. Contrast-enhancement T1 images demonstrated prominent contrast in control patient at day 7, largely consistent with infarct volume. Margins of lesion for both patients are marked with lines. (B) Lesion volumes were measured on DWI (base line) and FLAIR (7 d). (C) The ratio of infarct volume increase = infarct volume change from baseline to day 7/infarct volume at baseline. (D) Vascular permeability (Lower) compared in two groups. Microvascular permeability of the infarct lesion were evaluated on CET-WI (7 d), the degree of enhancement on CET-WI was expressed as rT1%, rT1% = (mean signal intensity of a region of the infarction-mean signal intensity of the contra lateral homologous normal brain area)/mean signal intensity of the contra lateral homologous normal brain area. Values are mean ± SE; comparisons were performed with independent t test.
Contrast-enhanced T1-weighted imaging (CET1-WI) has been used routinely in cerebral stroke studies (28). The presence of parenchymal enhancement on CET1-WI is generally accepted as an indicator of contrast medium leakage across the disrupted BBB. Because BBB breakdown and reperfusion reputedly occurs at the subacute stage of AIS [i.e., 5–7 d (28)], we evaluated microvascular permeability on the seventh day of our study. As Fig. 4 illustrates, parenchymal enhancement of the acute ischemic lesion on CET1-WI in one control patient is much larger than in a fingolimod-treated patient. As a group, patients given fingolimod had an rT1% (an indicator of microvascular permeability) of 11.0 ± 2.0, whereas controls’ rT1% value was 20.5 ± 2.2 at 7 d (P = 0.005) (Fig. 4). These results suggest that fingolimod significantly decreased the microvascular permeability of infarct lesions.
Safety.
Suspected lung infection occurred in 27% of the fingolimod-treated patients and in control patients (Table 2). Infection signs in fingolimod-treated patients were relatively mild and disappeared after a brief course of antibiotics. No recipient of fingolimod complained of cardiac discomfort, as confirmed by ECG monitoring, which found no cardiac arrhythmia or atrioventricular blocks. In addition, blood pressure, heart rate, and routine laboratory investigations before and after the treatment had no obvious fluctuations (Fig. S1 and Table S1).
Table 2.
Complications and adverse events
| Complication or event | Control (n = 11) | Fingolimod (n = 11) | P value |
| Complications | |||
| Deaths | 0 (0) | 0 (0) | 1.00 |
| Myocardial infarctions | 0 (0) | 0 (0) | 1.00 |
| Recurrent strokes | 0 (0) | 0 (0) | 1.00 |
| Cerebral hernia | 0 (0) | 0 (0) | 1.00 |
| Hemorrhage of digestive tract | 0 (0) | 0 (0) | 1.00 |
| Fever (>38 °C) | 3 (27) | 3 (27) | 1.00 |
| Event | |||
| All events | |||
| At least one adverse event | 3 (27) | 3 (27) | 1.00 |
| Any adverse event leading to discontinuation | 0 (0) | 0 (0) | 1.00 |
| Any serious adverse event | 0 (0) | 0 (0) | 1.00 |
| Frequent or special-interest adverse event | |||
| Suspected lung infection | 3 (27) | 3 (27) | 1.00 |
| Urinary tract infection | 0 (0) | 0 (0) | 1.00 |
| Herpes virus infection | 0 (0) | 0 (0) | 1.00 |
| Abnormal laboratory liver-function test | 0 (0) | 0 (0) | 1.00 |
| Gastrointestinal disorders | 0 (0) | 0 (0) | 1.00 |
| Leukopenia | 0 (0) | 0 (0) | 1.00 |
| Lymphopenia | 0 (0) | 0 (0) | 1.00 |
| Bradycardia | 0 (0) | 0 (0) | 1.00 |
| Atrioventricular block | 0 (0) | 0 (0) | 1.00 |
| Macular edema | 0 (0) | 0 (0) | 1.00 |
Data are n (%).
Discussion
In this study, we evaluated the impact of modulation of inflammatory and immune reactions on the outcome of human AIS. For this purpose, we monitored AIS patients who had exceeded the accepted timing for treatment with tPA and, instead, received therapy to reduce their content of circulating blood lymphocytes, thereby blocking the homing of these inflammatory cells to the brain. This inhibition was achieved by oral administration of fingolimod, 0.5 mg, given daily for 3 consecutive days between 6 and 72 h after the onset of AIS symptoms. Fingolimod is a S1PR modulator and a Food and Drug Administration-approved oral therapy for MS. Here, we found that compared with 11 AIS patients who received standard stroke management alone, 11 matched AIS patients who ingested this brief course of fingolimod along with standard stroke management manifested significant reductions in secondary injury and microvascular permeability, as well as enjoying better clinical outcomes. These benefits appeared during the acute phase of disease and remained at the 3-mo follow-up visit. It is important to note that the efficacy of fingolimod for patients with large infarcts was more apparent than in those with lacunar infarcts.
Half-life elimination of fingolimod ranges from 89 to 157 h independent of dose. The pharmacodynamics of fingolimod was characterized by a reversible transient lymphopenia within 6 h, the nadir being 42% of baseline. Lymphocyte count returned to baseline within 72 h with 0.25- to 2-mg treatment (29). Fingolimod improved neurological outcome after experimental stroke in mice and rats. This result was associated with smaller lesion size in animals receiving fingolimod within a therapeutic time window from 48 h preceding ischemia to 3 d after the induction of ischemia (12–14, 20–26). Fingolimod reduced circulating blood lymphocytes by 60–80% as early as from 2 to 6 h after the first administration, and lymphocyte counts remained significantly reduced up to 7 d later (22, 25, 30). Two or more doses (two to five doses) and low or high doses have been investigated independently. Overall, longer duration and higher-dose group produced similar or a slightly better neuroprotective effect compared with single- and low-dose group (12–14, 20–26). Inflammatory and immune reactions elicited during the early phase of hypoxia further compromise the BBB, which is initially injured by a secession of blood flow in AIS. Brain swelling (brain edema) then surrounds the infarct core and compresses the adjacent ischemic but also normal brain tissues, thereby causing deterioration and the typical neurological deficits, which usually occurs between 2 and 5 d after the initial stroke episode (31). Furthermore, in a biphasic pattern, BBB opening accompanies acute ischemic pathology (32). That pattern includes early BBB opening just after the onset of an ischemic response and a delayed secondary opening during a neuroinflammatory response occurring 24–72 h later. On the basis of fingolimod’s pharmacokinetic and pharmacodynamics parameters, as well as the preclinical basis in experimental stroke and poststroke inflammatory and immune reactions, we formulated the dose and regimen selection in this study. In the present study, at the time of fingolimod administration (i.e., within 6–72 h after disease onset), pronounced lymphopenia was produced during the first week in all 11 AIS patients. Coincident with that observation was a decrease in microvascular permeability, secondary injury (33, 34), and alleviation of neurological deficits. Thus, a 3-consecutive-day protocol of drug administration, beginning at the time of AIS diagnosis in tPA-ineligible patients, acted successfully on the acute period postischemic inflammation. Additionally, a delayed secondary opening phase ensued, decreasing BBB injury and vascular edema formation. These observations strongly suggest that fingolimod inhibited the homing of inflammatory cells to the brain, as previously demonstrated in animal models (3, 35). This block of immune activity, together with a transient state of relative immune suppression, actions on BBB, and neuronal cells presumably accounted for the beneficial effects evidenced here by clinical parameters and MRI.
Fingolimod readily penetrates the CNS and acts directly on neurons and glia bearing multiple S1PRs (17). Preservation of CNS tissues by fingolimod, which has been suggested in studies of relapsing MS (17), was also a likely contributor to the beneficial effects we witnessed. Indeed, by 3 mo after treatment, fingolimod produced a nearly complete recovery and a strikingly different outcome from that in control AIS patients, whose management varied only by the absence of fingolimod. However, rodent models do not faithfully mimic the pathogenesis of stroke, and in vitro experiments may not simulate the intricate cellular interplay between lymphocytes, glia, and neurons.
An important question that remains is whether treatment prolonged beyond the 3-d course used here would produce more beneficial effects. Without a firm determination of the optimal length of medication, our assumption is that prolongation would not produce additional benefit. This assumption is essentially based on the time window in which fingolimod acts, as discussed extensively above. Additionally, brain insults resulting from ischemia or trauma produce systemic effects and, perhaps, immune deficiency within the brain via cholinergic or hypothalamic–pituitary–adrenal axis pathways (7). If or exactly when these actions might occur is not known; however, down-regulation of the immune reaction, perhaps because of a self-protective mechanism acquired during evolution, might counteract further inflammatory responses. Excessive down-regulation of immunity by the brain itself is believed to be responsible for poststroke infection (7, 8). Finally, inflammatory responses may negate neuro-tissue repair in the recovery phase (36). These aspects argue against the prolonged use of immune modulatory medications during stroke.
Fingolimod was well tolerated in all 11 AIS patients included here. No patients dropped out. No abnormalities in heart rate or cardiac arrhythmia were recorded. The brief duration of fingolimod at the dose of 0.5 mg/d ensured its safety. Notably, both controls and fingolimod recipients exhibited possible lung infections at a same rate (3 of 11). The symptoms in fingolimod-treated patients were relatively mild and quickly resolved after a brief episode of antibiotics. Most likely because of beneficial effects of fingolimod, neurological deficits also resolved well. Because fingolimod causes lymphocyte redistribution rather than deletion, this drug does not necessarily produce an immune deficient state per se, particularly with the brief treatment regimen used here.
Pluripotent agents, such as minocycline, inhibit microglia; statins have broad anti-inflammatory properties; and natalizumab blocks T-cell entry into the CNS. All these agents have shown some promise in preclinical and pilot clinical trials of patients with AIS (35, 37, 38). However, the fact that oral fingolimod is effective at the crucial interval of 6–72 h after stroke onset emphasizes its measurable benefit. This strategy renews our interests in how this and other immune modulators provide for managing patients with AIS as a single (time exceeding 4.5 h) or additive therapy in conjunction with tPA (within 4.5 h). We recently reported that fingolimod administration reduced peri-hematomal edema and improved the clinical outcome of patients with acute intracerebral hemorrhagic stroke (ICH) (39). Although the pathological process, nature of brain lesions, and the dynamic of inflammation in ICH differs substantially from that of AIS, the beneficial effects of fingolimod on ICH suggest that inflammation is amenable for modulation. Furthermore, attenuation of brain inflammation at a defined time window after acute stroke may produce a favorable CNS microenvironment for neuroprotective agents that have failed in previous trials (38). Although the small sample size, nonrandomized wide duration of enrollment, heterogeneous lesion size, and open-label pilot study precludes definite conclusions, our study encourages further investigation of inflammatory modulators and manipulation of immune reactions as a new avenue for managing patients with AIS.
Materials and Methods
Study Population.
During the open enrollment, a total of 230 AIS patients were screened. Twenty-two patients who met the criteria and matched age, stroke etiology, NIHSS, lesion volume, and locations were recruited into this trial at Tianjin Medical University General Hospital, Tianjin, China. The study was designed as a single center, open-label, evaluator-blinded, parallel-group clinical pilot trial. The trial protocol and supporting documentation were approved by the Tianjin Medical University General Hospital institutional review boards. Informed consents or legally acceptable surrogates were obtained from all patients at enrollment. This study is registered with ClinicalTrials.gov, number NCT02002390. A number of inclusion criteria were adopted: (i) >18 y of age; (ii) acute onset of focal neurological deficit consistent with acute ischemic stroke; (iii) measurable neurological deficit (NIHSS ≥ 5); (iv) anterior-circulation ischemic stroke defined by magnetic resonance angiography (MRA) and DWI; (v) onset of symptom to admission more than 4.5 h and less than 72 h. Patients who arrived within 0–4.5 h poststroke were treated with other medications according to the best accepted medical treatment guidelines. Exclusion criteria were patients with: (i) hemorrhagic stroke; (ii) evidence of other diseases of the CNS; (iii) preexisting neurologic disability (a score greater than 2 on the mRS); (iv) swallowing difficulties; (v) patients with any history of bradyarrhythmia or atrioventricular blocks; (vi) concomitant use with antineoplastic, immunosuppressive, or immune modulating therapies; and (vii) macular edema.
Trial Design.
Twenty-two AIS patients were placed into two groups: control group (standard treatment adhered to current American Heart Association guidelines) or fingolimod group [standard treatment plus fingolimod (FTY720, Gilenya, Novartis)]. Our best efforts were made to ensure that members of both groups shared similar clinical and imaging characteristics (Table 1). Each patient in the fingolimod group was given 0.5 mg of the drug orally once daily, for 3 consecutive days, beginning within 1 h after the baseline MRI and no later than 72 h after the onset of symptoms (Fig. 1).
FACS Assessments.
The kinetics of lymphocyte subset alteration were monitored in whole-blood samples from all fingolimod-treated patients at the baseline, which preceded the first dose, and at 1, 3, 7, and 90 d after the first dose for comparison with control patients at the same time points. Mononuclear cells were isolated from the whole-blood specimens and stained with antibodies to CD4-FITC, CD8-PE, CD19-PerCP, and CD56-PE (BD Biosciences). Data were acquired using a FACSCalibur (Becton Dickinson Immunocytometry Systems) and analyzed with Flow Jo software (Tree Star).
Clinical Assessments.
Clinical assessments were performed upon patients’ enrollment, at the time points when fingolimod was given, and on days 7, 14, 30, and 90 afterward in evaluator-blinded fashion (Fig. 1). The extent of neurologic deficit was evaluated by the NIHSS. Global outcomes at 90 d were assessed with mRS, and limitation of the ability to perform activities of daily living was calculated with the mBI.
Imaging Protocol.
For MRIs, 3 Tesla GE and Siemens scanners were used at admission, 7 ± 1 d and 90 d with a comprehensive acute stroke MRI protocol, including DWI and perfusion-weighted imaging, MRA, and CET1-WI. Lesion volume enlargement was measured on DWI (baseline) and FLAIR (7 d). Lesion volume of the T1-weighted image was assessed on day 90. Measurements were independently and blindly done by two neuroradiologists using MIPAV software. Lesion volume was manually outlined on the DWI, FLAIR, and T1 slices and then automatically calculated for each slice from the measured area and corresponding slice thickness. The degree of enhancement on CET1-WI (7 d) was expressed as rT1%, rT1% = (mean signal intensity of a region of the infarction − mean signal intensity of the contralateral homologous normal brain area)/mean signal intensity of the contra lateral homologous normal brain area (28).
Safety Assessments.
Two attending neurologists measured the adverse events in hospital and via outpatient clinic follow-up as well as phone calls until 90 d. A nonserious adverse event was defined as any undesirable medical experience occurring to a patient whether or not considered related to the test treatment, not including abnormal laboratory values without clinical consequences. A serious adverse event was defined as an event suggesting a significant hazard or side effect, related to the test treatment. Cough, fever, leukocytosis, and infiltrates on chest X-rays were the criteria used here for the diagnosis of lung infection. The main safety-outcome measures were the frequency of lung infection and cardiac arrhythmia.
Statistical Analysis.
SPSS for Windows v17.0 software (SPSS) was used for the analysis. For continuous variables, such as age and lesion volumes, descriptive statistics were calculated and reported as means ± SE. All continuous variables were compared for the fingolimod-treatment group with the control group using the t test for independent samples. Categorical variables were compared for the fingolimod-treatment group with controls using the χ2 test (Fisher’s exact test when the expected value is <5). For within-group analyses, variables were evaluated by a paired t test. NIHSS values for the fingolimod-treatment group and controls were analyzed with a two-way ANOVA. Statistical significance is defined as P < 0.05.
Supplementary Material
Acknowledgments
We thank our patients for participating this study; Drs. P. Zhao, Z.-L. Zhu, and Y. Xiao for facilitating recruitment of the patients; Ms. M. Li, Mr. J. Xiao, and Dr. W. Jin for technical support; Ms. P. Minick for editorial assistance; and Drs. D. Huang and J. Dong for fruitful discussions and advice. This study was supported by the National Basic Research Program of China (2013CB966900), the National Science Foundation of China (81230028), the National Key Clinical Specialty Construction Program of China, American Heart Association Grant GRNT18970031, and National Institutes of Health Grants R01AI083294.
Footnotes
The authors declare no conflict of interest.
This article is a PNAS Direct Submission.
This article contains supporting information online at www.pnas.org/lookup/suppl/doi:10.1073/pnas.1416166111/-/DCSupplemental.
References
- 1.Hacke W, et al. ECASS Investigators Thrombolysis with alteplase 3 to 4.5 hours after acute ischemic stroke. N Engl J Med. 2008;359(13):1317–1329. doi: 10.1056/NEJMoa0804656. [DOI] [PubMed] [Google Scholar]
- 2.Lees KR, et al. ECASS, ATLANTIS, NINDS and EPITHET rt-PA Study Group Time to treatment with intravenous alteplase and outcome in stroke: An updated pooled analysis of ECASS, ATLANTIS, NINDS, and EPITHET trials. Lancet. 2010;375(9727):1695–1703. doi: 10.1016/S0140-6736(10)60491-6. [DOI] [PubMed] [Google Scholar]
- 3.Donnan GA, et al. How to make better use of thrombolytic therapy in acute ischemic stroke. Nat Rev Neurol. 2011;7(7):400–409. doi: 10.1038/nrneurol.2011.89. [DOI] [PubMed] [Google Scholar]
- 4.Grossman AW, Broderick JP. Advances and challenges in treatment and prevention of ischemic stroke. Ann Neurol. 2013;74(3):363–372. doi: 10.1002/ana.23993. [DOI] [PubMed] [Google Scholar]
- 5.Chamorro Á, et al. The immunology of acute stroke. Nat Rev Neurol. 2012;8(7):401–410. doi: 10.1038/nrneurol.2012.98. [DOI] [PubMed] [Google Scholar]
- 6.Ahmad M, Graham SH. Inflammation after stroke: Mechanisms and therapeutic approaches. Transl Stroke Res. 2010;1(2):74–84. doi: 10.1007/s12975-010-0023-7. [DOI] [PMC free article] [PubMed] [Google Scholar]
- 7.Eltzschig HK, Carmeliet P. Hypoxia and inflammation. N Engl J Med. 2011;364(7):656–665. doi: 10.1056/NEJMra0910283. [DOI] [PMC free article] [PubMed] [Google Scholar]
- 8.Iadecola C, Anrather J. The immunology of stroke: From mechanisms to translation. Nat Med. 2011;17(7):796–808. doi: 10.1038/nm.2399. [DOI] [PMC free article] [PubMed] [Google Scholar]
- 9.Mena H, Cadavid D, Rushing EJ. Human cerebral infarct: A proposed histopathologic classification based on 137 cases. Acta Neuropathol. 2004;108(6):524–530. doi: 10.1007/s00401-004-0918-z. [DOI] [PubMed] [Google Scholar]
- 10.Gan Y, et al. Ischemic neurons recruit natural killer cells that accelerate brain infarction. Proc Natl Acad Sci USA. 2014;111(7):2704–2709. doi: 10.1073/pnas.1315943111. [DOI] [PMC free article] [PubMed] [Google Scholar]
- 11.Kleinschnitz C, et al. Early detrimental T-cell effects in experimental cerebral ischemia are neither related to adaptive immunity nor thrombus formation. Blood. 2010;115(18):3835–3842. doi: 10.1182/blood-2009-10-249078. [DOI] [PubMed] [Google Scholar]
- 12.Shichita T, et al. Pivotal role of cerebral interleukin-17-producing gammadeltaT cells in the delayed phase of ischemic brain injury. Nat Med. 2009;15(8):946–950. doi: 10.1038/nm.1999. [DOI] [PubMed] [Google Scholar]
- 13.Hasegawa Y, Suzuki H, Sozen T, Rolland W, Zhang JH. Activation of sphingosine 1-phosphate receptor-1 by FTY720 is neuroprotective after ischemic stroke in rats. Stroke. 2010;41(2):368–374. doi: 10.1161/STROKEAHA.109.568899. [DOI] [PMC free article] [PubMed] [Google Scholar]
- 14.Wei Y, et al. Fingolimod provides long-term protection in rodent models of cerebral ischemia. Ann Neurol. 2011;69(1):119–129. doi: 10.1002/ana.22186. [DOI] [PMC free article] [PubMed] [Google Scholar]
- 15.Massberg S, von Andrian UH. Fingolimod and sphingosine-1-phosphate—Modifiers of lymphocyte migration. N Engl J Med. 2006;355(11):1088–1091. doi: 10.1056/NEJMp068159. [DOI] [PubMed] [Google Scholar]
- 16.Schwab SR, et al. Lymphocyte sequestration through S1P lyase inhibition and disruption of S1P gradients. Science. 2005;309(5741):1735–1739. doi: 10.1126/science.1113640. [DOI] [PubMed] [Google Scholar]
- 17.Cohen JA, Chun J. Mechanisms of fingolimod’s efficacy and adverse effects in multiple sclerosis. Ann Neurol. 2011;69(5):759–777. doi: 10.1002/ana.22426. [DOI] [PubMed] [Google Scholar]
- 18.Kappos L, et al. FREEDOMS Study Group A placebo-controlled trial of oral fingolimod in relapsing multiple sclerosis. N Engl J Med. 2010;362(5):387–401. doi: 10.1056/NEJMoa0909494. [DOI] [PubMed] [Google Scholar]
- 19.Cannon RE, Peart JC, Hawkins BT, Campos CR, Miller DS. Targeting blood-brain barrier sphingolipid signaling reduces basal P-glycoprotein activity and improves drug delivery to the brain. Proc Natl Acad Sci USA. 2012;109(39):15930–15935. doi: 10.1073/pnas.1203534109. [DOI] [PMC free article] [PubMed] [Google Scholar]
- 20.Brunkhorst R, et al. FTY720 treatment in the convalescence period improves functional recovery and reduces reactive astrogliosis in photothrombotic stroke. PLoS ONE. 2013;8(7):e70124. doi: 10.1371/journal.pone.0070124. [DOI] [PMC free article] [PubMed] [Google Scholar]
- 21.Wacker BK, Park TS, Gidday JM. Hypoxic preconditioning-induced cerebral ischemic tolerance: Role of microvascular sphingosine kinase 2. Stroke. 2009;40(10):3342–3348. doi: 10.1161/STROKEAHA.109.560714. [DOI] [PMC free article] [PubMed] [Google Scholar]
- 22.Czech B, et al. The immunomodulatory sphingosine 1-phosphate analog FTY720 reduces lesion size and improves neurological outcome in a mouse model of cerebral ischemia. Biochem Biophys Res Commun. 2009;389(2):251–256. doi: 10.1016/j.bbrc.2009.08.142. [DOI] [PubMed] [Google Scholar]
- 23.Pfeilschifter W, et al. Treatment with the immunomodulator FTY720 does not promote spontaneous bacterial infections after experimental stroke in mice. Exp Transl Stroke Med. 2011;9(3):2–7. doi: 10.1186/2040-7378-3-2. [DOI] [PMC free article] [PubMed] [Google Scholar]
- 24.Pfeilschifter W, et al. Activation of sphingosine kinase 2 is an endogenous protective mechanism in cerebral ischemia. Biochem Biophys Res Commun. 2011;413(2):212–217. doi: 10.1016/j.bbrc.2011.08.070. [DOI] [PubMed] [Google Scholar]
- 25.Kraft P, et al. FTY720 ameliorates acute ischemic stroke in mice by reducing thrombo-inflammation but not by direct neuroprotection. Stroke. 2013;44(11):3202–3210. doi: 10.1161/STROKEAHA.113.002880. [DOI] [PubMed] [Google Scholar]
- 26.Campos F, et al. Fingolimod reduces hemorrhagic transformation associated with delayed tissue plasminogen activator treatment in a mouse thromboembolic model. Stroke. 2013;44(2):505–511. doi: 10.1161/STROKEAHA.112.679043. [DOI] [PMC free article] [PubMed] [Google Scholar]
- 27.Gaudinski MR, et al. Establishing final infarct volume: Stroke lesion evolution past 30 days is insignificant. Stroke. 2008;39(10):2765–2768. doi: 10.1161/STROKEAHA.107.512269. [DOI] [PMC free article] [PubMed] [Google Scholar]
- 28.Liu HS, et al. Effects of microvascular permeability changes on contrast-enhanced T1 and pharmacokinetic MR imagings after ischemia. Stroke. 2013;44(7):1872–1877. doi: 10.1161/STROKEAHA.113.001558. [DOI] [PubMed] [Google Scholar]
- 29.Budde K, et al. First human trial of FTY720, a novel immunomodulator, in stable renal transplant patients. J Am Soc Nephrol. 2002;13(4):1073–1083. doi: 10.1681/ASN.V1341073. [DOI] [PubMed] [Google Scholar]
- 30.Liesz A, et al. FTY720 reduces post-ischemic brain lymphocyte influx but does not improve outcome in permanent murine cerebral ischemia. PLoS ONE. 2011;6(6):e21312. doi: 10.1371/journal.pone.0021312. [DOI] [PMC free article] [PubMed] [Google Scholar]
- 31.Hacke W, et al. ‘Malignant’ middle cerebral artery territory infarction: Clinical course and prognostic signs. Arch Neurol. 1996;53(4):309–315. doi: 10.1001/archneur.1996.00550040037012. [DOI] [PubMed] [Google Scholar]
- 32.Yang Y, Rosenberg GA. Blood-brain barrier breakdown in acute and chronic cerebrovascular disease. Stroke. 2011;42(11):3323–3328. doi: 10.1161/STROKEAHA.110.608257. [DOI] [PMC free article] [PubMed] [Google Scholar]
- 33.Schwamm LH, et al. Time course of lesion development in patients with acute stroke: Serial diffusion- and hemodynamic-weighted magnetic resonance imaging. Stroke. 1998;29(11):2268–2276. doi: 10.1161/01.str.29.11.2268. [DOI] [PubMed] [Google Scholar]
- 34.Baird AE, et al. Enlargement of human cerebral ischemic lesion volumes measured by diffusion-weighted magnetic resonance imaging. Ann Neurol. 1997;41(5):581–589. doi: 10.1002/ana.410410506. [DOI] [PubMed] [Google Scholar]
- 35.Liesz A, et al. Inhibition of lymphocyte trafficking shields the brain against deleterious neuroinflammation after stroke. Brain. 2011;134(Pt 3):704–720. doi: 10.1093/brain/awr008. [DOI] [PubMed] [Google Scholar]
- 36.Moalem G, et al. Autoimmune T cells protect neurons from secondary degeneration after central nervous system axotomy. Nat Med. 1999;5(1):49–55. doi: 10.1038/4734. [DOI] [PubMed] [Google Scholar]
- 37.Kohler E, et al. Intravenous minocycline in acute stroke: A randomized, controlled pilot study and meta-analysis. Stroke. 2013;44(9):2493–2499. doi: 10.1161/STROKEAHA.113.000780. [DOI] [PubMed] [Google Scholar]
- 38.Endres M. Statins and stroke. J Cereb Blood Flow Metab. 2005;25(9):1093–1110. doi: 10.1038/sj.jcbfm.9600116. [DOI] [PubMed] [Google Scholar]
- 39.Fu Y, et al. Fingolimod for the treatment of intracerebral hemorrhage: A 2-arm proof-of-concept study. JAMA Neurol. 2014;71(9):1092–1101. doi: 10.1001/jamaneurol.2014.1065. [DOI] [PubMed] [Google Scholar]
Associated Data
This section collects any data citations, data availability statements, or supplementary materials included in this article.