

Significance
Bacteria commonly reside in vivo as communities comprised of small, densely packed aggregates. Aggregates display important phenotypes, including enhanced antibiotic resistance, and recent evidence suggests that chemical interactions between aggregates are critical in human-associated microbial communities. However, studying aggregates is challenging because of the inability to confine and spatially organize small microbial populations. Here, we interface two analytical technologies, micro-3D printing and scanning electrochemical microscopy, to develop an in vitro platform with the capacity to manipulate the size and spatial arrangement of bacterial aggregates and quantify chemical interactions between aggregates in real time. We show that a quorum-sensing metabolite is produced by Pseudomonas aeruginosa aggregates containing as few as 500 cells and determine how spatial structure impacts communication between neighboring aggregates.
Keywords: Pseudomonas aeruginosa, scanning electrochemical microscopy, quorum sensing, 3D printing, pyocyanin
Abstract
Microbes frequently live in nature as small, densely packed aggregates containing ∼101–105 cells. These aggregates not only display distinct phenotypes, including resistance to antibiotics, but also, serve as building blocks for larger biofilm communities. Aggregates within these larger communities display nonrandom spatial organization, and recent evidence indicates that this spatial organization is critical for fitness. Studying single aggregates as well as spatially organized aggregates remains challenging because of the technical difficulties associated with manipulating small populations. Micro-3D printing is a lithographic technique capable of creating aggregates in situ by printing protein-based walls around individual cells or small populations. This 3D-printing strategy can organize bacteria in complex arrangements to investigate how spatial and environmental parameters influence social behaviors. Here, we combined micro-3D printing and scanning electrochemical microscopy (SECM) to probe quorum sensing (QS)-mediated communication in the bacterium Pseudomonas aeruginosa. Our results reveal that QS-dependent behaviors are observed within aggregates as small as 500 cells; however, aggregates larger than 2,000 bacteria are required to stimulate QS in neighboring aggregates positioned 8 μm away. These studies provide a powerful system to analyze the impact of spatial organization and aggregate size on microbial behaviors.
Bacterial populations are often found in nature as small, densely packed aggregates containing ∼101–105 cells (1–5). These aggregates serve as building blocks for larger biofilm communities as well as a primary mode of transmission for pathogenic microbes (5–8). Similar to biofilm communities, aggregates develop microscale physical and chemical heterogeneity and display clinically relevant phenotypes, including enhanced antibiotic resistance (2, 8–16). Moreover, aggregate sizes containing as few as 103 bacteria have been shown to engage in quorum sensing (QS)-mediated behaviors (17–21). In its simplest form, QS is a communication strategy that allows bacteria to effectively monitor their population density through the secretion and sensing of extracellular signals (7, 22–24). When the population reaches a specific density, activation of the QS regulatory cascade results in enhanced transcription of a defined set of genes. These genes control distinct behaviors, including virulence, in the opportunistic pathogen Pseudomonas aeruginosa (25). In addition to displaying QS-mediated behaviors, bacterial aggregates have been shown to interact with neighboring aggregates both in vitro and in vivo (9, 26–28). Indeed, these interactions have a profound impact on virulence and are often mediated by small diffusible molecules (8–10, 22, 29–31).
Despite the prevalence of aggregates in nature, understanding the mechanisms controlling their behavior and interaction has been difficult because of the inability to create spatially organized aggregate communities in vitro. Droplet-based, emulsion, and microfluidic approaches have evolved as high-throughput tools for screening interactions within small groups of isolated bacteria (32–40). However, these confinement strategies typically offer little control over the spatial arrangement of aggregates, and diffusion of extracellular signals between the confinement volume and the surrounding environment is limited. We recently developed a system to control aggregate size and spatial organization using protein-based micro-3D printing (28). Micro-3D printing is a flexible technology capable of creating arbitrary, complex spatial configurations of bacteria in three dimensions with submicrometer resolution. In this approach, bacteria are confined within micrometer-sized houses (referred to here as microtraps) constructed using a biocompatible multiphoton lithography technique (41–44). The protein-based walls and roof of the microtrap define aggregate size and shape in three dimensions and are permeable to many small molecules. Cells confined within microtraps divide at normal rates and reach maximum cell density (1012 cells mL−1) while maintaining cell numbers typical of natural aggregates (14, 28, 42).
Using microtraps, our group showed that as few as 2,600 P. aeruginosa cells engage in QS-mediated behaviors when present at maximum density (42). This work used a cell-based biosensor, in which production of GFP served as a proxy for QS-mediated communication (14, 42). Although this biosensor-based approach provided exciting insights into QS in P. aeruginosa aggregates, this system suffers from several limitations, including a delay in synthesis of detectable GFP on QS activation because of the need to transcribe, translate, and fold the protein; heterogeneity in GFP expression between individual cells within the community; and the need for high levels of GFP production because of the intrinsic autofluorescence of P. aeruginosa.
Because of the limitations of GFP, it would be valuable to develop a system that allows quantitative, real-time monitoring of bacterial behaviors in aggregate populations. Our groups recently used scanning electrochemical microscopy (SECM) as a sensitive, quantitative technique for studying small-molecule production by bacterial biofilms (45, 46). SECM has the ability to measure the local concentration of redox-active small molecules with resolution on the micrometer scale using an ultramicroelectrode sensing tip (47). In addition, SECM can set the exact distance between the ultramicroelectrode tip and a biological substrate through a feedback approach curve and subsequently, scan over the substrate in the x–y direction (47). Here, we coupled micro-3D printing and SECM to provide quantitative, real-time monitoring of bacterial behaviors in aggregate populations. By measuring the P. aeruginosa QS-controlled secondary metabolite pyocyanin (48), we provide evidence that QS occurs in aggregates as small as 500 P. aeruginosa cells. By spatially localizing QS signal-producing and QS-responsive cells at defined distances using micro-3D printing, we also define the number of cells required for P. aeruginosa aggregates to communicate.
Results
Electrochemical Characterization of 3D-Printed Bacterial Microtraps.
One of the primary challenges of coupling 3D-printed microtraps with SECM is positioning the ultramicroelectrode at a defined height above the roof of the microtrap (49). SECM has the ability to establish a fixed distance from a surface by plotting the change in ultramicroelectrode tip current as a function of the distance from the surface (referred to as an approach curve) (47). However, the current measurements used to generate the feedback approach curve are dependent on not only the distance between the tip and the surface but also, the permeability of the surface. Because of the high permeability of 3D-printed surfaces, it was first necessary to develop conditions that would allow precise identification and surface mapping of microtraps (49). For these experiments, 8-pL microtraps (20 × 20 × 20-µm inner chamber) consisting of 8-µm-thick walls and a 3-µm-thick roof (Fig. 1A) were constructed on a glass coverslip and immersed in growth media. Initially, the photo-cross–linked protein matrix was too porous to differentiate the microtrap from the bulk solution or the glass surface using SECM. To overcome this challenge, we took advantage of the flexibility that this 3D printing method offers to design customized materials and tuned the fabrication parameters to increase the cross-link density within the protein matrix and decrease the permeability, which has been described in detail elsewhere (49).
Fig. 1.
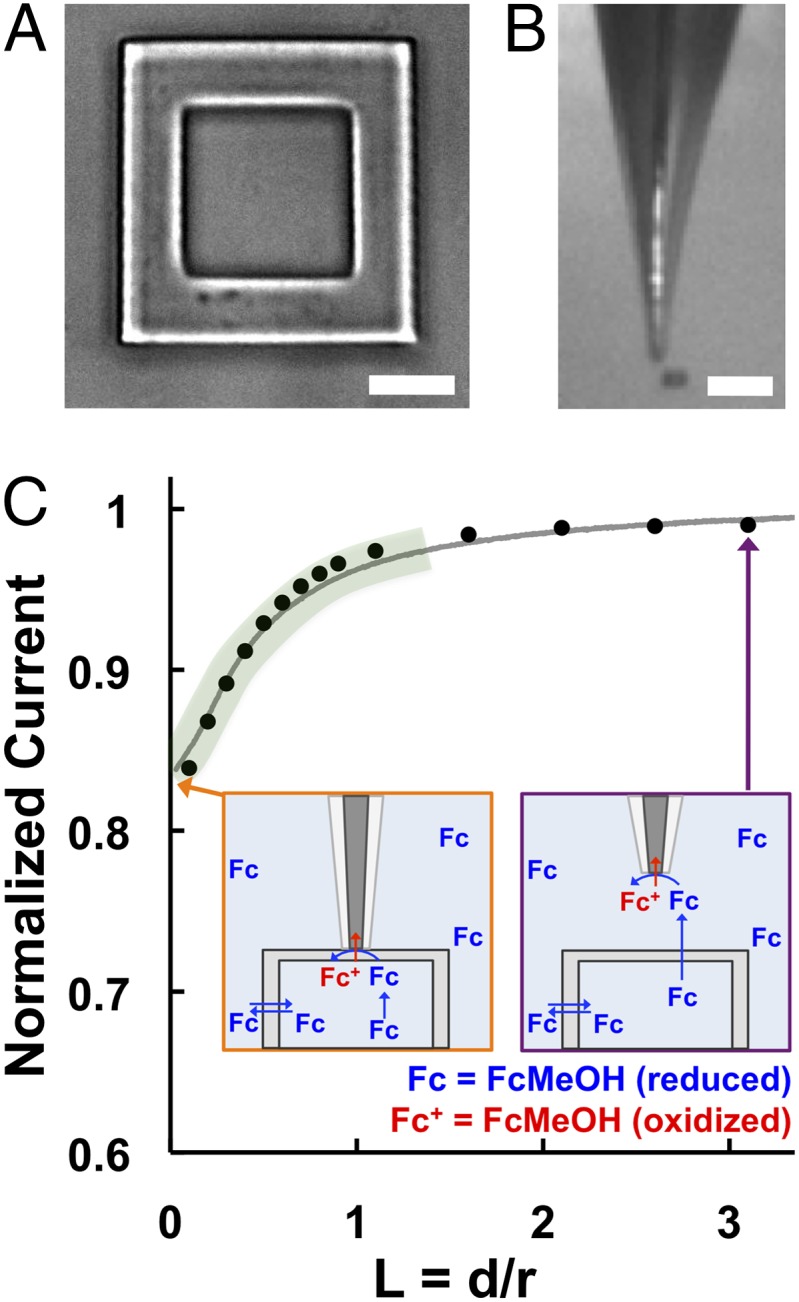
(A) Bright-field image of an empty 3D-printed microtrap. The trap has an 8-pL inner chamber (20 × 20 × 20 µm; length × width × height) that is surrounded by four 8-µm-thick walls and a 3-µm-thick roof. (Scale bar: 10 µm.) (B) A video microscope image of the 5-µm-diameter SECM probe positioned adjacent to a 3D-printed microtrap. (Scale bar: 100 µm.) (C) SECM feedback approach curve (solid line) collected over a microtrap using FcMeOH as a redox mediator, where L is the normalized distance between the tip and the microtrap roof. The experimental curve (gray line) was fit to a simulated negative feedback approach curve (black circles). Schematics with the tip positioned at (Orange Inset) L = 0 and (Purple Inset) L = 3 (∼7.5 µm above the trap) illustrate how the current response from FcMeOH changes as a function of L within close proximity (∼3 µm) to the trap (green region).
A feedback approach curve was first generated using ferrocenemethanol (FcMeOH) as a redox mediator to identify the glass surface adjacent to the microtrap. The tip was then withdrawn to a known distance to recover the original steady-state current response and moved laterally to position the tip over the microtrap using light microscopy (Fig. 1B) (49). A steady-state current response was recorded in the bulk solution (Fig. 1C, Purple Inset) [normalized to the tip radius (L = d/r) of L = 3] as the tip approached the roof until the amperometric current response at the tip decreased significantly at a distance (d) of ∼3 µm (L = 1.2) (Fig. 1C) and continued to decrease as a function of L as the tip approached the microtrap (Fig. 1C, region of the curve outlined in green). The contact between the roof surface and the glass sheath surrounding the tip is seen as the inflection point of the approach curve (Fig. 1C, Orange Inset) (L = 0). After contacting the roof, the tip was withdrawn again to recover the original current response, and the difference between the original tip position over the roof and the displacement until the inflection point at the contact moment corresponds to the microtrap height (49). The measured height of the microtrap (22.0–25.0 μm) shows the reproducibility of the micro-3D printing process.
We have previously shown that the walls and roof of 3D-printed microtraps are porous (28, 42); however, the transport of small molecules diffusing through these fully enclosed structures has not been quantified. Because the physically robust and smooth surface of the roof allows for the formation of a stable, nanometer-wide gap under the ultramicroelectrode tip, the remarkably high permeability of the microtrap could be measured reliably using SECM (49). The permeability of the microtrap to FcMeOH [k = 1.2 (± 0.1) × 10−1 cm/s] was determined by fitting an experimental approach curve obtained from a finite element simulation of a two-phase SECM diffusion problem as described in detail elsewhere (49). FcMeOH was used in lieu of pyocyanin for determining trap porosity (49) for two reasons. (i) FcMeOH and pyocyanin have similar molecular weights (FcMeOH = 216.06; pyocyanin = 210.23), the same calculated Stokes radius of 0.33 nm (50, 51), and diffusion coefficients of ∼7.5 × 106 cm/s (which were confirmed by the limiting current in the cyclic voltammograms collected in known concentrations of each molecule). (ii) A deposit formed on the surface of the ultramicroelectrode tip during the electrochemical reduction of oxidized pyocyanin (52, 53), and this polymer formed a film that both created a larger capacitance and blocked the electrochemical reaction on the platinum surface, thus decreasing the current response. This polymerization did not affect our previous work (45), because a large ultramicroelectrode tip was used.
Coupling Micro-3D Printing and SECM to Investigate Pyocyanin Production by Bacterial Aggregates.
Pyocyanin is a redox-active secondary metabolite (Fig. 2A) important for P. aeruginosa virulence. Because it is under strict QS control (48) and can be detected electrochemically (45, 52, 54, 55), pyocyanin can be used as a proxy for QS-mediated communication. To determine the number of bacteria required for P. aeruginosa to initiate QS, 8-pL microtraps were printed directly around one to five P. aeruginosa cells in situ (28), and the pyocyanin concentration was monitored by SECM imaging as the population grew over time. For these experiments, a 5-µm-diameter platinum ultramicroelectrode tip was positioned 2 µm above the roof of the microtrap and scanned to enable sensitive, real-time detection of pyocyanin (Fig. 2B). Here, the platinum tip was biased at 0 V vs. Ag/AgCl to instantaneously oxidize the reduced form of pyocyanin produced by P. aeruginosa cells. Because the amperometric current response over the microtrap is a function of the tip–substrate distance and permeability (Fig. 2C) as well as the concentration of pyocyanin (49), the current response above the microtrap was converted to the pyocyanin concentration using the measured permeability as described above and in more detail elsewhere (49), a calibration curve (Fig. S1), and theoretical simulations (Figs. S2 and S3).
Fig. 2.

(A) Pyocyanin (PYO) redox reaction. (B) Schematic of the microtrap- SECM system for measuring PYO in real time. (C) Simulated approach curve (points) based on the oxidation of PYO over a microtrap roof. The solid line represents the theoretical diffusion-limited response. (D) A SECM reactive image for PYO collected above a microtrap containing WT P. aeruginosa. The SECM tip was biased at 0 V vs. Ag/AgCl to oxidize PYO, and a 2D scan was acquired by moving the tip in the x–y direction over the microtrap containing P. aeruginosa at a fixed height of 2 µm above the roof. The change in the current response is highest (dark yellow) directly over the bacteria producing PYO (∼2.7 µM) in the chamber. The microtrap walls and roof are outlined in dark and light blue, respectively. (E) A 3D confocal reconstruction was used to count the number of cells (∼700) in the microtrap. The walls appear green, and the bacteria appear red. (Scale bars: 10 µm.)
No pyocyanin was detected above the microtraps containing fewer than 10 cells. After 6–10 h of growth at room temperature, SECM imaging (Fig. S4 and Fig. 2D) revealed that the local pyocyanin concentration above microtraps containing 500–3,200 WT P. aeruginosa reached ∼2.7 µM on average (Fig. 3A), which is the maximum pyocyanin concentration measured from the oxidative current above the center of the microtrap roof in the SECM image, where we can obtain the highest collection efficiency of pyocyanin at the platinum tip. Cell number was determined immediately after SECM imaging by fixing the microtraps in 2.5% glutaraldehyde, staining with propidium iodide, and imaging by confocal microscopy (cells appear red in Fig. 2E). Despite the fact that the microtraps had sufficient capacity for 12,000 bacteria, those containing as few as 500 cells were shown to produce pyocyanin. These data show that as few as 500 bacteria growing at high density (1012 cells/mL) initiate QS, a number significantly lower than previously shown (2,600 cells) using our biosensor-based approach (42). As a control, a P. aeruginosa strain (Δphz) lacking the genes necessary for pyocyanin production because of a clean deletion of both phenazine (phz) biosynthetic operons was shown not to produce detectable pyocyanin when confined in microtraps (Fig. 3B).
Fig. 3.

Pyocyanin (PYO) was used as a proxy for P. aeruginosa QS-controlled communication during growth in 8-pL microtraps. The average PYO concentration detected above the microtrap roof and a representative SECM image based on PYO oxidation for each condition tested are shown in Right. (A) PYO (2.7 ± 0.3 µM) is observed over microtraps containing WT P. aeruginosa (green), establishing that as few as 500 cells are needed to initiate QS in an individual aggregate. No PYO is detected above either (B) a QS signal-producing strain unable to produce PYO (∆phz; red) or (C) a QS-responder strain that cannot produce a signal (C4-HSL) required for PYO production (∆rhlI; blue). (D) Addition of 25 µM C4-HSL (red triangles) induces PYO production (2.5 ± 0.1 µM PYO) in ∆rhlI populations containing 8,000–10,000 cells. (E and F) Communication between physically separated populations was investigated by arranging the two mutant strains in neighboring chambers with a shared wall. (E) No response is detected over the ∆rhlI population by SECM when ≤2,000 ∆phz cells are present in the adjacent microtrap, whereas (F) aggregates of ≥5,000 ∆phz cells are capable of inducing PYO production in the neighboring ∆rhlI community. The error represents 1 SD; n ≥ 4 for all conditions.
Impact of Community Spatial Structure on QS.
In addition to understanding how P. aeruginosa communicates in bacterial aggregates, a critical question in QS is understanding how spatial structure impacts communication between neighboring aggregates. Here, we used the unique advantages offered by micro-3D printing and SECM to investigate how QS communication proceeds between physically separated P. aeruginosa aggregates. Two mutant strains of P. aeruginosa, a QS signal-producing strain (∆phz) (Fig. 3, red) (22) and a QS-responsive strain (∆rhlI) (Fig. 3, blue) (56), were placed in side-by-side 8-pL microtraps with a shared 8-µm-thick wall. P. aeruginosa ∆phz produces the P. aeruginosa QS signal N-butanoyl-l-homoserine lactone (C4-HSL) but lacks ability to produce all phenazines, including pyocyanin. P. aeruginosa ∆rhlI is unable to produce C4-HSL but responds to this signal by producing pyocyanin. As expected, no pyocyanin production was observed by SECM imaging above microtraps containing each mutant individually (Fig. 3 B and C); however, exogenous addition of 25 µM C4-HSL induced pyocyanin production by ∆rhlI aggregates to WT levels (Fig. 3D).
To determine the number of ∆phz cells required to stimulate pyocyanin production in the neighboring ∆rhlI aggregates, pyocyanin production by ∆rhlI was monitored when growing adjacent to variable numbers of ∆phz cells. The current level measured above the microtrap was uniform over both chambers when 200–2,000 ∆phz cells were present, indicating that the ∆phz population did not induce pyocyanin production in the neighboring ∆rhlI aggregates when present at these numbers (Fig. 3E). However, when the ∆phz population size increased to over 5,000 cells, the current above the ∆rhlI population increased steadily in the SECM image for all of the responder aggregate sizes examined (1,300–9,000 ∆rhlI cells) (Fig. 3F). Quantification of pyocyanin revealed a concentration of ∼1.6 μM, indicating that QS was initiated in the responder community (1,300–9,000 ∆rhlI cells) by the neighboring ∆phz aggregate. This result shows that, at a defined distance of 8 µm, aggregates larger than 2,000 cells are required to stimulate QS in a neighboring aggregate.
Discussion
In vivo microbial populations often exist as dense, spatially organized aggregates containing 101–105 cells, and recent evidence suggests that the spatial structure of these aggregates has a profound impact on infection (9). However, little is known regarding how cells residing within a single aggregate communicate or how neighboring aggregates interact. Characterizing these interactions remains difficult primarily because of the technical challenges associated with both manipulating the spatial arrangement of bacteria at the microscale level and detecting communication between aggregates with high sensitivity. Here, we pioneered a system that uses SECM metabolite quantification in concert with micro-3D printing to address this challenge. Partnering these two analytical technologies allowed us to control the size and spatial orientation of dense aggregates to follow communication within and between aggregates in real time. One of the key requirements for interfacing these two technologies was positioning the ultramicroelectrode tip accurately over the roof of the microtrap. Despite the fact that the microtrap roof was highly porous, we were able to accurately sense the roof and map the transport of small molecules through it using SECM (49). This ability to set the SECM tip very close to the microtrap roof and scan the tip over the roof surface was essential for establishing a powerful system for monitoring bacterial aggregate behaviors in real time with high spatial resolution.
Using this system, we first asked a question: how many cells are needed to initiate QS-mediated communication in a P. aeruginosa aggregate? Although this question has been the subject of significant attention in recent years, many of the strategies used to isolate and study small groups of cells have used closed systems that have minimal chemical exchange with the outside environment or conditions that support little or no bacterial growth (32–39). We recently used microtraps to address this question using a P. aeruginosa biosensor strain that produces high levels of GFP on QS activation. This earlier study revealed that as few as 2,600 cells could initiate QS when confined at high densities under very low flow (42). Here, we show that as few as 500 cells produce detectable levels of the QS-controlled metabolite pyocyanin, indicating that aggregates as small as a few hundred cells can produce biologically relevant levels of this potent toxin. Interestingly, the level of pyocyanin produced by aggregates (∼2.7 µM) is similar to levels measured above ∼5-mm-diameter biofilms (45, 54), suggesting that this concentration may be the maximum amount produced by P. aeruginosa during aggregate/biofilm growth.
After establishing that pyocyanin production by P. aeruginosa aggregates could be detected using SECM imaging, we next asked a question: how does spatial structure impact QS communication between neighboring P. aeruginosa aggregates? To address this question, we took advantage of the fact that our micro-3D printing technology can be performed in stages, thus allowing us to construct two microtraps containing different bacterial strains separated by a defined distance (8 µm). A finite element analysis (Fig. S5) revealed that the flux of the signal molecule through the shared microtrap wall is ∼50% higher than through the roof, indicating that, as expected, the 8-µm-thick wall offers the most direct and efficient signal transfer pathway between the neighboring aggregates. One trap contained a QS signal-producing P. aeruginosa strain (∆phz), and the other contained a QS signal-responsive strain (∆rhlI) that produced pyocyanin on QS stimulation. Our finding that greater than 2,000 signal-producing cells are required to stimulate the neighboring QS-responsive population (1,300–9,000 ∆rhlI cells) when separated by 8 µm provides quantitative insight into how cell number impacts aggregate interactions. It is not surprising that more cells are needed to induce QS between neighboring aggregates (>2,000) than within an individual aggregate (∼500) simply because of the requirement for the effective amount of signal molecule to diffuse to the adjacent aggregate.
In summary, we present the practical application of an analytical strategy developed recently (49) that couples two powerful techniques: micro-3D printing and SECM. Together, they provide a versatile platform to study and manipulate physical and chemical interactions both between and within small, spatially structured populations of bacteria. Although the primary importance of this study is in the development and successful application of this system to quantify chemical interactions between bacterial aggregates, this strategy has clear advantages over others and provides the platform necessary to begin to probe important questions in microbiology focused on understanding communication in spatially structured microbial communities.
Materials and Methods
Materials.
Details are provided in SI Text.
Bacterial Strains and Cell Culture.
WT P. aeruginosa strain PA14, P. aeruginosa PA14 ∆phz1/2 (22), and P. aeruginosa PA14 ∆rhlI (56) were used in these studies. The growth medium for all experiments was a 1:15 (vol/vol) mixture of LB broth (5 g/L yeast extract, 10 g/L tryptone, 10 g/L NaCl) (57) and morpholinepropanesulfonic acid (Mops) minimal medium (50 mM Mops, 43 mM NaCl, 93 mM NH4Cl, 2 mM KH2PO4, 3.5 mM FeSO4, 1 mM MgSO4) buffered to pH 7.2 (58) with 20 mM sodium succinate as the carbon source. Planktonic cultures were grown aerobically overnight at 37 °C. Cells were diluted from overnight cultures, grown at 37 °C to midlogarithmic phase, and then diluted into a fabrication precursor solution for printing as described below.
Micro-3D Printing.
Photo-cross–linked gelatin microtraps were printed on the untreated surface within a 0.8-mL well of a Lab-Tek chambered #1 coverglass using a dynamic mask-directed multiphoton lithography process described in detail elsewhere (28, 41, 43). In brief, a galvanometer-driven scanner (GVS002; Thor Labs) raster-scanned the output from a mode-locked titanium:sapphire laser (Tsunami; Spectra Physics) operating at 740 nm across the face of a digital micromirror device (800 × 600 SVGA; Texas Instruments) displaying binary mask sequences created using Adobe Photoshop. The reflected light was aligned to the back aperture of an Olympus PlanApo 60×, 1.40 N.A. oil-immersion objective positioned on an inverted microscope (Zeiss; Axiovert). All 3D microtraps in this work were printed at 2.5 s per plane in a layer-by-layer process by coordinating the mask presentation on the digital micromirror device with 0.25-µm steps on the optical (z) axis using a motorized focus driver (H122; Prior Scientific). All fabrication parameters were optimized to achieve a sufficient cross-linking density to produce a current response large enough to position the platinum ultramicroelectrode accurately above the microtraps using a feedback approach curve generated with 0.1 mM FcMeOH as described in Fig. 1 and more detail elsewhere (49).
Midlogarithmic phase P. aeruginosa cells were diluted to an OD at 600 nm of 0.01 in a warmed (37 °C) fabrication precursor solution containing 200 mg/mL gelatin (Type A; porcine), 75 mg/mL bovine serum albumin (BSA), and 9 mM Rose Bengal prepared in Hepes buffer (20 mM Hepes, 0.1 M NaCl, pH 7.4). After cooling to room temperature, the 8-pL microtraps were printed directly around one to five P. aeruginosa cells embedded in the thermally set gel using an average laser power of ∼40 mW measured at the back aperture of the objective. The 3D-printed microtraps were stored overnight in the fabrication gel at 4 °C to arrest cell growth. The next morning, the uncross-linked gelatin/BSA was washed out of the sample well using multiple volumes (0.5 mL per wash) of the Hepes buffer used to prepare the fabrication precursor at 37 °C. After the precursor had been removed completely, the sample was washed in the LB/Mops growth medium with 0.1 mM FcMeOH added as a redox mediator for positioning the ultramicroelectrode tip. Samples were placed inside a microscope incubator maintained at 37 °C for 2–5 h before SECM imaging to monitor cell growth directly using phase contrast microscopy as described previously (14, 42).
A multistep printing process using the same fabrication conditions as described above was used to arrange P. aeruginosa ∆phz and ∆rhlI cells in side-by-side microtraps (Fig. 3 E and F). In the first stage, a trap was printed around one to five QS responder strain (∆rhlI) cells embedded in a thermally set gel at room temperature. After printing was complete, the excess precursor material and any remaining untrapped cells were washed out using 37 °C media. Then, a new gel containing the QS signal-producing strain (∆phz) was cast in the same sample well, and a second microtrap was printed around ∆phz cells directly next to each ∆rhlI trap, creating a two-chambered microtrap with one shared wall separating the populations (Fig. 3 E and F). After the second printing step, the 3D-printed microtraps were stored in the precursor gel overnight at 4 °C, and the samples were treated in the same manner as described above.
Optical Imaging and Data Analysis.
Details of bright-field, phase contrast, and confocal fluorescence imaging are provided in SI Text.
Electrochemical Characterization of Microtraps.
Details describing the microtrap height and permeability measurements by SECM are provided elsewhere (49).
Quantitative SECM Measurements.
All electrochemical measurements were performed using a CHI model 920C potentiostat (CH Instruments) with the two-electrode cell placed in the grounded stage. Ag/AgCl in a saturated KCl solution was used as a reference and counterelectrode. A 5-µm-diameter platinum electrode was used as the SECM tip, and all electrochemical data were collected at room temperature in the LB/Mops growth medium with 0.1 mM FcMeOH added as a redox mediator for accurate tip positioning. Details about the SECM tip fabrication can be found in SI Text and elsewhere (47, 49, 50). The tip was biased at 0.4 V vs. Ag/AgCl to oxidize FcMeOH or 0 V vs. Ag/AgCl to oxidize pyocyanin. The tip approach rate was 100 nm/s for all approach curves. All SECM images were obtained by scanning the tip in the x and y axes at a rate of 10 µm/s at a fixed height of 2 µm above the microtrap roof. Details about generating the pyocyanin calibration curve are provided in SI Text.
Simulations.
Details about simulation models are in SI Text and elsewhere (49).
Supplementary Material
Acknowledgments
We acknowledge support from Air Force Office of Scientific Research Multidisciplinary University Research Initiative (AFOSR MURI) Grant FA9550-14-1-0003 and US Army Research Office Grant W911NF-13-1-0199. J.L.C. is a Cystic Fibrosis Foundation Ann Weinberg Memorial Postdoctoral Research Fellow. M.W. is a Burroughs Wellcome Investigator in the Pathogenesis of Infectious Disease.
Footnotes
The authors declare no conflict of interest.
This article contains supporting information online at www.pnas.org/lookup/suppl/doi:10.1073/pnas.1421211111/-/DCSupplemental.
References
- 1.Hall-Stoodley L, Stoodley P. Biofilm formation and dispersal and the transmission of human pathogens. Trends Microbiol. 2005;13(1):7–10. doi: 10.1016/j.tim.2004.11.004. [DOI] [PubMed] [Google Scholar]
- 2.Bjarnsholt T, et al. The in vivo biofilm. Trends Microbiol. 2013;21(9):466–474. doi: 10.1016/j.tim.2013.06.002. [DOI] [PubMed] [Google Scholar]
- 3.Davies DG, et al. The involvement of cell-to-cell signals in the development of a bacterial biofilm. Science. 1998;280(5361):295–298. doi: 10.1126/science.280.5361.295. [DOI] [PubMed] [Google Scholar]
- 4.Stoodley P, et al. Growth and detachment of cell clusters from mature mixed-species biofilms. Appl Environ Microbiol. 2001;67(12):5608–5613. doi: 10.1128/AEM.67.12.5608-5613.2001. [DOI] [PMC free article] [PubMed] [Google Scholar]
- 5.Schleheck D, et al. Pseudomonas aeruginosa PAO1 preferentially grows as aggregates in liquid batch cultures and disperses upon starvation. PLoS ONE. 2009;4(5):e5513. doi: 10.1371/journal.pone.0005513. [DOI] [PMC free article] [PubMed] [Google Scholar]
- 6.Yarwood JM, Bartels DJ, Volper EM, Greenberg EP. Quorum sensing in Staphylococcus aureus biofilms. J Bacteriol. 2004;186(6):1838–1850. doi: 10.1128/JB.186.6.1838-1850.2004. [DOI] [PMC free article] [PubMed] [Google Scholar]
- 7.Hibbing ME, Fuqua C, Parsek MR, Peterson SB. Bacterial competition: Surviving and thriving in the microbial jungle. Nat Rev Microbiol. 2010;8(1):15–25. doi: 10.1038/nrmicro2259. [DOI] [PMC free article] [PubMed] [Google Scholar]
- 8.Alhede M, et al. Phenotypes of non-attached Pseudomonas aeruginosa aggregates resemble surface attached biofilm. PLoS ONE. 2011;6(11):e27943. doi: 10.1371/journal.pone.0027943. [DOI] [PMC free article] [PubMed] [Google Scholar]
- 9.Stacy A, et al. Bacterial fight-and-flight responses enhance virulence in a polymicrobial infection. Proc Natl Acad Sci USA. 2014;111(21):7819–7824. doi: 10.1073/pnas.1400586111. [DOI] [PMC free article] [PubMed] [Google Scholar]
- 10.Wang YJ, Leadbetter JR. Rapid acyl-homoserine lactone quorum signal biodegradation in diverse soils. Appl Environ Microbiol. 2005;71(3):1291–1299. doi: 10.1128/AEM.71.3.1291-1299.2005. [DOI] [PMC free article] [PubMed] [Google Scholar]
- 11.Okegbe C, Price-Whelan A, Dietrich LE. Redox-driven regulation of microbial community morphogenesis. Curr Opin Microbiol. 2014;18:39–45. doi: 10.1016/j.mib.2014.01.006. [DOI] [PMC free article] [PubMed] [Google Scholar]
- 12.Stewart PS. Diffusion in biofilms. J Bacteriol. 2003;185(5):1485–1491. doi: 10.1128/JB.185.5.1485-1491.2003. [DOI] [PMC free article] [PubMed] [Google Scholar]
- 13.Stewart PS, Franklin MJ. Physiological heterogeneity in biofilms. Nat Rev Microbiol. 2008;6(3):199–210. doi: 10.1038/nrmicro1838. [DOI] [PubMed] [Google Scholar]
- 14.Wessel AK, et al. Oxygen limitation within a bacterial aggregate. MBio. 2014;5(2):e00992–e00914. doi: 10.1128/mBio.00992-14. [DOI] [PMC free article] [PubMed] [Google Scholar]
- 15.Wessel AK, Hmelo L, Parsek MR, Whiteley M. Going local: Technologies for exploring bacterial microenvironments. Nat Rev Microbiol. 2013;11(5):337–348. doi: 10.1038/nrmicro3010. [DOI] [PMC free article] [PubMed] [Google Scholar]
- 16.Cho H, et al. Self-organization in high-density bacterial colonies: Efficient crowd control. PLoS Biol. 2007;5(11):e302. doi: 10.1371/journal.pbio.0050302. [DOI] [PMC free article] [PubMed] [Google Scholar]
- 17.Henke JM, Bassler BL. Bacterial social engagements. Trends Cell Biol. 2004;14(11):648–656. doi: 10.1016/j.tcb.2004.09.012. [DOI] [PubMed] [Google Scholar]
- 18.Connell JL, Whiteley M, Shear JB. Sociomicrobiology in engineered landscapes. Nat Chem Biol. 2012;8(1):10–13. doi: 10.1038/nchembio.749. [DOI] [PubMed] [Google Scholar]
- 19.Parsek MR, Greenberg EP. Sociomicrobiology: The connections between quorum sensing and biofilms. Trends Microbiol. 2005;13(1):27–33. doi: 10.1016/j.tim.2004.11.007. [DOI] [PubMed] [Google Scholar]
- 20.Bassler BL, Losick R. Bacterially speaking. Cell. 2006;125(2):237–246. doi: 10.1016/j.cell.2006.04.001. [DOI] [PubMed] [Google Scholar]
- 21.Diggle SP, Griffin AS, Campbell GS, West SA. Cooperation and conflict in quorum-sensing bacterial populations. Nature. 2007;450(7168):411–414. doi: 10.1038/nature06279. [DOI] [PubMed] [Google Scholar]
- 22.Dietrich LEP, Price-Whelan A, Petersen A, Whiteley M, Newman DK. The phenazine pyocyanin is a terminal signalling factor in the quorum sensing network of Pseudomonas aeruginosa. Mol Microbiol. 2006;61(5):1308–1321. doi: 10.1111/j.1365-2958.2006.05306.x. [DOI] [PubMed] [Google Scholar]
- 23.Ramsey MM, Rumbaugh KP, Whiteley M. Metabolite cross-feeding enhances virulence in a model polymicrobial infection. PLoS Pathog. 2011;7(3):e1002012. doi: 10.1371/journal.ppat.1002012. [DOI] [PMC free article] [PubMed] [Google Scholar]
- 24.Korgaonkar A, Trivedi U, Rumbaugh KP, Whiteley M. Community surveillance enhances Pseudomonas aeruginosa virulence during polymicrobial infection. Proc Natl Acad Sci USA. 2013;110(3):1059–1064. doi: 10.1073/pnas.1214550110. [DOI] [PMC free article] [PubMed] [Google Scholar]
- 25.Rutherford ST, Bassler BL. Bacterial quorum sensing: Its role in virulence and possibilities for its control. Cold Spring Harb Perspect Med. 2012;2(11):a012427. doi: 10.1101/cshperspect.a012427. [DOI] [PMC free article] [PubMed] [Google Scholar]
- 26.Flickinger ST, et al. Quorum sensing between Pseudomonas aeruginosa biofilms accelerates cell growth. J Am Chem Soc. 2011;133(15):5966–5975. doi: 10.1021/ja111131f. [DOI] [PMC free article] [PubMed] [Google Scholar]
- 27.Kim HJ, Boedicker JQ, Choi JW, Ismagilov RF. Defined spatial structure stabilizes a synthetic multispecies bacterial community. Proc Natl Acad Sci USA. 2008;105(47):18188–18193. doi: 10.1073/pnas.0807935105. [DOI] [PMC free article] [PubMed] [Google Scholar]
- 28.Connell JL, Ritschdorff ET, Whiteley M, Shear JB. 3D printing of microscopic bacterial communities. Proc Natl Acad Sci USA. 2013;110(46):18380–18385. doi: 10.1073/pnas.1309729110. [DOI] [PMC free article] [PubMed] [Google Scholar]
- 29.Alberghini S, et al. Consequences of relative cellular positioning on quorum sensing and bacterial cell-to-cell communication. FEMS Microbiol Lett. 2009;292(2):149–161. doi: 10.1111/j.1574-6968.2008.01478.x. [DOI] [PubMed] [Google Scholar]
- 30.Dilanji GE, Langebrake JB, De Leenheer P, Hagen SJ. Quorum activation at a distance: Spatiotemporal patterns of gene regulation from diffusion of an autoinducer signal. J Am Chem Soc. 2012;134(12):5618–5626. doi: 10.1021/ja211593q. [DOI] [PubMed] [Google Scholar]
- 31.Price-Whelan A, Dietrich LEP, Newman DK. Pyocyanin alters redox homeostasis and carbon flux through central metabolic pathways in Pseudomonas aeruginosa PA14. J Bacteriol. 2007;189(17):6372–6381. doi: 10.1128/JB.00505-07. [DOI] [PMC free article] [PubMed] [Google Scholar]
- 32.Theberge AB, et al. Microdroplets in microfluidics: An evolving platform for discoveries in chemistry and biology. Angew Chem Int Ed Engl. 2010;49(34):5846–5868. doi: 10.1002/anie.200906653. [DOI] [PubMed] [Google Scholar]
- 33.Guo MT, Rotem A, Heyman JA, Weitz DA. Droplet microfluidics for high-throughput biological assays. Lab Chip. 2012;12(12):2146–2155. doi: 10.1039/c2lc21147e. [DOI] [PubMed] [Google Scholar]
- 34.Baca HK, et al. Cell-directed-assembly: Directing the formation of nano/bio interfaces and architectures with living cells. Biochim Biophys Acta. 2011;1810(3):259–267. doi: 10.1016/j.bbagen.2010.09.005. [DOI] [PMC free article] [PubMed] [Google Scholar]
- 35.Carnes EC, et al. Confinement-induced quorum sensing of individual Staphylococcus aureus bacteria. Nat Chem Biol. 2010;6(1):41–45. doi: 10.1038/nchembio.264. [DOI] [PMC free article] [PubMed] [Google Scholar]
- 36.Boedicker JQ, Li L, Kline TR, Ismagilov RF. Detecting bacteria and determining their susceptibility to antibiotics by stochastic confinement in nanoliter droplets using plug-based microfluidics. Lab Chip. 2008;8(8):1265–1272. doi: 10.1039/b804911d. [DOI] [PMC free article] [PubMed] [Google Scholar]
- 37.Boedicker JQ, Vincent ME, Ismagilov RF. Microfluidic confinement of single cells of bacteria in small volumes initiates high-density behavior of quorum sensing and growth and reveals its variability. Angew Chem Int Ed Engl. 2009;48(32):5908–5911. doi: 10.1002/anie.200901550. [DOI] [PMC free article] [PubMed] [Google Scholar]
- 38.Fidalgo LM, et al. From microdroplets to microfluidics: Selective emulsion separation in microfluidic devices. Angew Chem Int Ed Engl. 2008;47(11):2042–2045. doi: 10.1002/anie.200704903. [DOI] [PubMed] [Google Scholar]
- 39.Yaguchi T, et al. Micropatterning bacterial suspensions using aqueous two phase systems. Analyst (Lond) 2010;135(11):2848–2852. doi: 10.1039/c0an00464b. [DOI] [PubMed] [Google Scholar]
- 40.Weitz M, et al. Communication and computation by bacteria compartmentalized within microemulsion droplets. J Am Chem Soc. 2014;136(1):72–75. doi: 10.1021/ja411132w. [DOI] [PubMed] [Google Scholar]
- 41.Kaehr B, Shear JB. Mask-directed multiphoton lithography. J Am Chem Soc. 2007;129(7):1904–1905. doi: 10.1021/ja068390y. [DOI] [PubMed] [Google Scholar]
- 42.Connell JL, et al. Probing prokaryotic social behaviors with bacterial “lobster traps.”. MBio. 2010;1(4):e00202–e00210. doi: 10.1128/mBio.00202-10. [DOI] [PMC free article] [PubMed] [Google Scholar]
- 43.Nielson R, Kaehr B, Shear JB. Microreplication and design of biological architectures using dynamic-mask multiphoton lithography. Small. 2009;5(1):120–125. doi: 10.1002/smll.200801084. [DOI] [PubMed] [Google Scholar]
- 44.Harper JC, Brozik SM, Brinker CJ, Kaehr B. Biocompatible microfabrication of 3D isolation chambers for targeted confinement of individual cells and their progeny. Anal Chem. 2012;84(21):8985–8989. doi: 10.1021/ac301816c. [DOI] [PubMed] [Google Scholar]
- 45.Koley D, Ramsey MM, Bard AJ, Whiteley M. Discovery of a biofilm electrocline using real-time 3D metabolite analysis. Proc Natl Acad Sci USA. 2011;108(50):19996–20001. doi: 10.1073/pnas.1117298108. [DOI] [PMC free article] [PubMed] [Google Scholar]
- 46.Liu X, et al. Real-time mapping of a hydrogen peroxide concentration profile across a polymicrobial bacterial biofilm using scanning electrochemical microscopy. Proc Natl Acad Sci USA. 2011;108(7):2668–2673. doi: 10.1073/pnas.1018391108. [DOI] [PMC free article] [PubMed] [Google Scholar]
- 47.Bard AJ, Mirkin MV. 2001. Scanning Electrochemical Microscopy (Marcel Dekker, New York), p 650.
- 48.Price-Whelan A, Dietrich LEP, Newman DK. Rethinking ‘secondary’ metabolism: Physiological roles for phenazine antibiotics. Nat Chem Biol. 2006;2(2):71–78. doi: 10.1038/nchembio764. [DOI] [PubMed] [Google Scholar]
- 49.Kim J, Connell JL, Whiteley M, Bard AJ. Development of a versatile in vitro platform for studying cellular interactions using micro-3D printing and scanning electrochemical microscopy. Anal Chem. 2014 doi: 10.1021/ac5036204. in press. [DOI] [PubMed] [Google Scholar]
- 50.Kim J, Izadyar A, Nioradze N, Amemiya S. Nanoscale mechanism of molecular transport through the nuclear pore complex as studied by scanning electrochemical microscopy. J Am Chem Soc. 2013;135(6):2321–2329. doi: 10.1021/ja311080j. [DOI] [PMC free article] [PubMed] [Google Scholar]
- 51.Zheng G, Price WS. Direct hydrodynamic radius measurement on dissolved organic matter in natural waters using diffusion NMR. Environ Sci Technol. 2012;46(3):1675–1680. doi: 10.1021/es202809e. [DOI] [PubMed] [Google Scholar]
- 52.Sharp D, Gladstone P, Smith RB, Forsythe S, Davis J. Approaching intelligent infection diagnostics: Carbon fibre sensor for electrochemical pyocyanin detection. Bioelectrochemistry. 2010;77(2):114–119. doi: 10.1016/j.bioelechem.2009.07.008. [DOI] [PubMed] [Google Scholar]
- 53.Láng GG, Barbero CA. Laser Techniques for the Study of Electrode Processes. Springer; Dordrecht, The Netherlands: 2012. [Google Scholar]
- 54.Bellin DL, et al. Integrated circuit-based electrochemical sensor for spatially resolved detection of redox-active metabolites in biofilms. Nat Commun. 2014;5:3256. doi: 10.1038/ncomms4256. [DOI] [PMC free article] [PubMed] [Google Scholar]
- 55.Webster TA, Sismaet HJ, Conte JL, Chan IPJ, Goluch ED. Electrochemical detection of Pseudomonas aeruginosa in human fluid samples via pyocyanin. Biosens Bioelectron. 2014;60:265–270. doi: 10.1016/j.bios.2014.04.028. [DOI] [PubMed] [Google Scholar]
- 56.Hogan DA, Vik A, Kolter R. A Pseudomonas aeruginosa quorum-sensing molecule influences Candida albicans morphology. Mol Microbiol. 2004;54(5):1212–1223. doi: 10.1111/j.1365-2958.2004.04349.x. [DOI] [PubMed] [Google Scholar]
- 57.Sambrook J, Maniatis T, Fritsch EF. Molecular Cloning: A Laboratory Manual. 2nd Ed Cold Spring Harbor Lab Press; Plainview, NY: 1989. [Google Scholar]
- 58.Palmer KL, Mashburn LM, Singh PK, Whiteley M. Cystic fibrosis sputum supports growth and cues key aspects of Pseudomonas aeruginosa physiology. J Bacteriol. 2005;187(15):5267–5277. doi: 10.1128/JB.187.15.5267-5277.2005. [DOI] [PMC free article] [PubMed] [Google Scholar]
Associated Data
This section collects any data citations, data availability statements, or supplementary materials included in this article.