Abstract
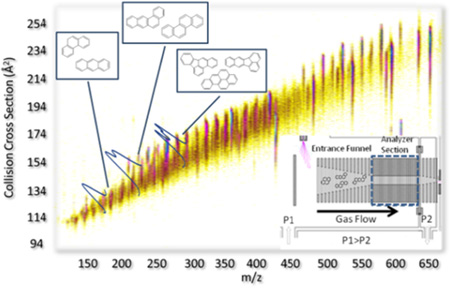
In the present paper, we showed the advantages of trapped ion mobility spectrometry coupled too mass spectrometry (TIMS-MS) combined with theoretical calculations for fast identification (millisecond timescale) of polycyclic aromatic hydrocarbons (PAH) compounds from complex mixtures. Accurate PAH collision cross sections (CCS, in nitrogen as a bath gas) are reported for the most commonly encountered PAH compounds and the ability to separate PAH geometric isomers is shown for three isobaric pairs with mobility resolution exceeding 150 (3–5 times higher than conventional IMS devices). Theoretical candidate structures (optimized at the DFT/B3LYP level) are proposed for the most commonly encountered PAH compounds showing good agreement with the experimental CCS values (<5%). The potential of TIMS-MS for the separation and identification of PAH compounds from complex mixtures without the need of lengthy pre-separation steps is illustrated for the case of a complex soil mixture.
Introduction
Over the last decade, there has been an increase in the demand for faster and more comprehensive analytical tools for the characterization and separation of PAHs from complex mixtures (see more details in ref1,2). The main challenges encountered during PAH characterization are attributable to the large number of compounds present in complex mixtures and their structural diversity. PAH incorporation into the environment occurs from multiple sources (e.g., oil spills, incomplete combustion processes, etc.) and one way to determine the origin of PAHs is by analysing their molecular fingerprint. For example, PAHs can be incorporated into the human body via absorption in the gastrointestinal tract after ingestion of contaminated food or water and via skin contact.3–5 Despite recent efforts to improve the sensitivity and analytical specificity of PAHs quantification (e.g., SPE6, SPME7, LLE coupled to HPLC and GC-MS8, and GCxGC-FID9), the development of more accurate analytical separations (e.g., post-ionization, gas-phase separation) for molecular structure assignment with minimal to no sample preparation remains necessary. Previous work has shown the advantage of ion mobility spectrometry coupled to mass spectrometry for the separation and identification of PAHs from crude oils with varying complexity.10 With the advent of trapped ion mobility spectrometry, higher analytical separation power and improved molecular characterization has become possible.11–13
In the present paper, we explore for the first time the capabilities of trapped ion mobility spectrometry coupled to mass spectrometry (TIMS-MS) combined with theoretical calculations for a faster and better characterization of PAH from complex mixtures. Accurate ion-neutral collision cross sections are measured for commonly encountered PAH standards and compared with candidate structures. The capability to separate (in the ms scale) and identify PAHs (by CCS and m/z) from a complex soil mixture is demonstrated.
Experimental
Sample Preparation
Individual standards of 2,3-Benzanthracene, 1,2-Benzanthracene, Triphenylene, Rubrene, Pentacene, 1,2:5,6-Dibenzanthracene, and 1,2,3,4-Dibenzanthracene were purchased from Fisher Scientific (Waltham, MA). Pyrene, Benzo(a)pyrene, Benzo(e)pyrene, and Perylene were obtained from Sigma Aldrich (St. Louis, MO). Chrysene was obtained from Ultra Scientific (North Kingstown, RI). All chemicals were used as received without further purification. Individual standards were diluted to a final concentration of 0.7 ng/ml in toluene (Fisher Scientific, Waltham, MA). The PAHs in Soil certified research material which contains 16 PAHs at concentrations of 100 ppb to 1 ppm was obtained from Research Technologies Corporation (SQC017, Laramie, WY). The PAH containing soil was processed using ultrasonic extraction according to EPA method 3550C. A Tuning Mix mass spectrometry standard (Tunemix, G2421A, Agilent Technologies, Santa Clara, CA) was used as a mass and mobility calibration standard. Details on the Tuning Mix structures (e.g., m/z = 322 Ko= 1.376 cm2V−1s−1, m/z = 622 Ko= 1.013 cm2V−1s−1, and m/z = 922 Ko= 0.835 cm2V−1s−1) and TIMS mobility calibration procedures can be found elsewhere.13,14
Sample characterization
Individual standards were analyzed using high resolution mass spectrometry to confirm the purity of the samples. High resolution mass spectrometry analysis was performed in a Solarix 7T FTICR-MS from Bruker Daltonics Inc. (Billerica, MA). An atmospheric pressure photo ionization source (APPI, based on the Apollo II design, Bruker Daltonics Inc., MA) using a Kr lamp with main emission bands at 10.0 and 10.6 eV was used for all analyses. All standards were observed with sub ppm mass accuracy.
Fast separation by TIMS-MS
Details regarding the TIMS operation and specifics compared to traditional IMS can be found elsewhere.11−13 Briefly, in TIMS mobility separation is based on holding the ions stationary using an electric field against a moving gas. The separation in a TIMS device can be described by the center of the mass frame using the same principles as in a conventional IMS drift tube.15 Since mobility separation is related to the number of ion-neutral collisions (or drift time in traditional drift tube cells), the mobility separation in a TIMS device depends on the bath gas drift velocity, ion confinement and ion elution parameters. The mobility, K, of an ion in a TIMS cell is described by:
| (1) |
where vg, E, Velution and Vbase are the velocity of the gas, applied electric field, elution and base voltages, respectively. The constant A can be determined using calibration standards of known mobilities. In TIMS operation, multiple geometric isomers/conformers are trapped simultaneously at different E values resulting from a voltage gradient applied across the IMS tunnel. After thermalization, geometrical isomers/conformers are eluted by decreasing the electric field in stepwise decrements (referred to as the “ramp”). Each isomer/conformer eluting from the TIMS cell can be described by a characteristic voltage (i.e., Velution − Vbase). Eluted ions are then mass analyzed and detected by a maXis impact Q-ToF mass spectrometer (Bruker Daltonics Inc, Billerica, MA).
In a TIMS device, the total analysis time can be described as:
| (2) |
where, Ttrap is the thermalization/trapping time, ToF is the time after the mobility separation, and Vramp and Tramp are the voltage range and time required to vary the electric field, respectively. The elution voltage can be experimentally determined by varying the ramp time for a constant ramp voltage. This procedure also determines the time ions spend outside the separation region To (e.g., ion trapping and time-of-flight).
The TIMS funnel is controlled using in-house software, written in National Instruments Lab VIEW, and synchronized with the maXis Impact Q-ToF acquisition program.11 Separation was performed using nitrogen as a bath gas at ca. 300 K and typical P1 and P2 values are 2.6 and 1.0 mbar, respectively. The same RF (2040 kHz and 200–350 Vpp) was applied to all electrodes including the entrance funnel, the mobility separating section, and the exit funnel.
Mobility values (K) were correlated with CCS (Ω) using the equation:
| (3) |
where ze is the charge of the ion, kB is the Boltzmann constant, N* is the number density at standard temperature and pressure and mI and mb refer to the masses of the ion and bath gas, respectively.15
Theoretical calculations
Candidate structures were optimized at the DFT/B3LYP level with 6-31+g(d), 6-31++g(d,p), cc-pVDZ, and cc-pVTZ basis sets using Gaussian 09 software.16 Theoretical ion-neutral collision cross sections were calculated using MOBCAL version for helium17,18 and nitrogen19 as a bath gas at ca. 300K. Partial atomic charges were calculated using the Merz-Singh-Kollman scheme constrained to the molecular dipole moment.20 All optimized geometries and MOBCAL input files can be found in the supporting information.
Results and Discussion
Molecular ions [M]+ for all the PAH standards were produce by APPI and introduced into the TIMS-MS instrument. The mass spectrometry signals of single PAHs were isolated (Δm/z < 1 Da, monoisotopic peak) and the corresponding TIMS spectra were collected (Figure 1). As previously described in ref11,13,16,17,TIMS spectra were collected as a function of the ramp time for each isolated m/z signal of the PAH [M]+ standards in order to calculate the elution voltage (see equation 2). Thereafter, mobility and ion-neutral (nitrogen) collision cross sections were calculated using Tuning Mix as external calibration (see supplemental Table S2). A good agreement is observed between the TIMS PAHs mobility and ion-nitrogen collision cross sections with previously reported values using drift-tube based IMS instruments.19,21
Figure 1.
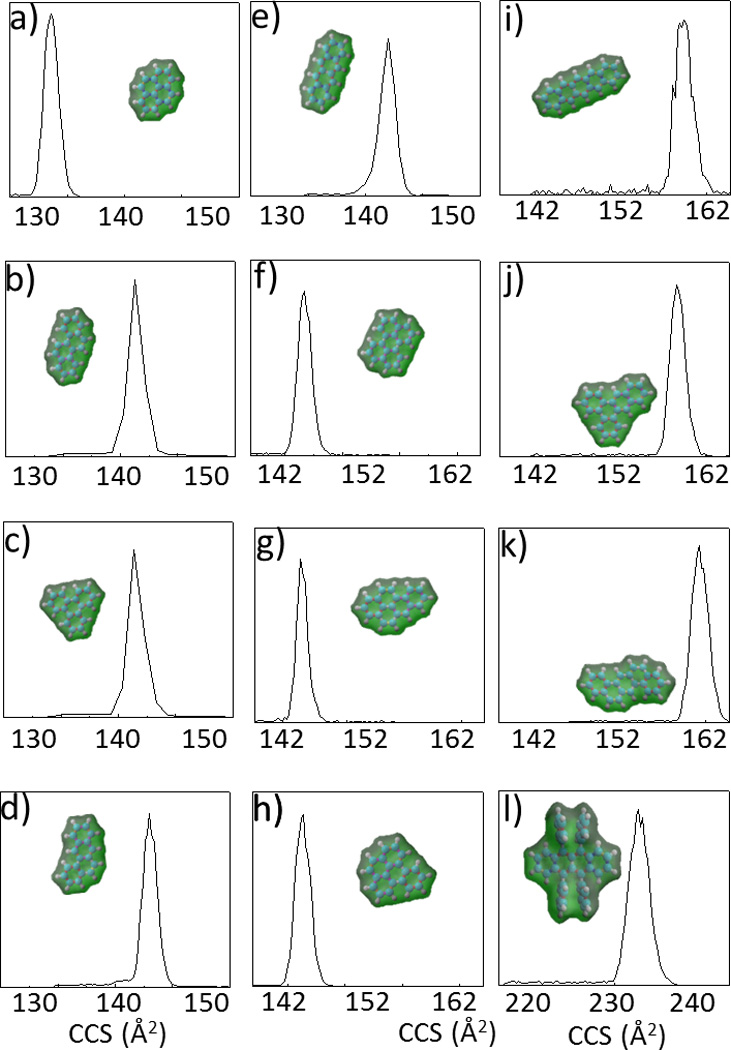
Typical TIMS spectra (Tramp=500ms) of a) Pyrene (R=90), b) Chrysene (R=103), c) Triphenylene (R=107), d) 1,2- Benzanthracene (R=98), e) 2,3- Benzanthracene (R=96), f) Perylene (R=113), g) Benzo(a)pyrene (R=133), h) Benzo(e)pyrene (R=102), i) Pentacene (R=96), j) 1,2,3,4- Dibenzanthracene (R=155), k) 1,2:5,6 Dibenzanthracene (R=98) and l) Rubrene (R=125). In the inset, the DFT/B3LYP/6-31++G(d,p) isosurface and a space-filled model representation of the molecular ions is
Candidate structures were proposed for all the PAH compounds (shown as inset of Figure 1). Optimized geometries and partial atomic charges were calculated at the DFT/B3LYP level using multiple basis sets (see supporting information). With the increase of the basis sets, variations of less than 1% were observed in the CCS(N2) for all the structures considered. A good agreement is observed between the theoretical and experimental ion-neutral collision cross sections (< 5%).
A characteristic feature of TIMS is the ability to tune the mobility separation from low to high resolution by increasing the ramp time and narrowing the scan voltage across the ramp as a function of the analytical challenge. Typical mobility resolution of R= 90–150 was obtained for a ramp time of 500 ms with a voltage ramp of ΔV= 10 V for individual compounds. It should be noted that TIMS analysis of PAH compounds comprises an additional challenge compared to previously studied biomolecules where higher TIMS mobility resolutions were obtained.12,13 That is, smaller m/z and CCS require the use of a lower electric field given the same bath velocity (resolution is directly related to the electric field strength).2,15 To better illustrate the TIMS capability to separate molecular PAH isobars [M]+, four isobaric pairs (C18H12, m/z= 228.093 Da) : chrysene vs triphenylene, triphenylene vs. 1,2-Benzathracene, and triphenylene vs. 2,3-Benzathracene were studied as a function of the ramp time (Figure 2). As the ramp time increases higher mobility separations are observed for all considered PAH isobaric pairs. Traditional PAH analysis of isobaric compounds involves the use of relatively slow separation methodologies (e.g., gas chromatography, GC or liquid chromatography, HPLC) prior mass spectrometry analysis. Separation conditions are highly compound-specific, co-eluting PAH interferences must be specifically addressed and require operation times upwards of 40 minutes.9
Figure 2.
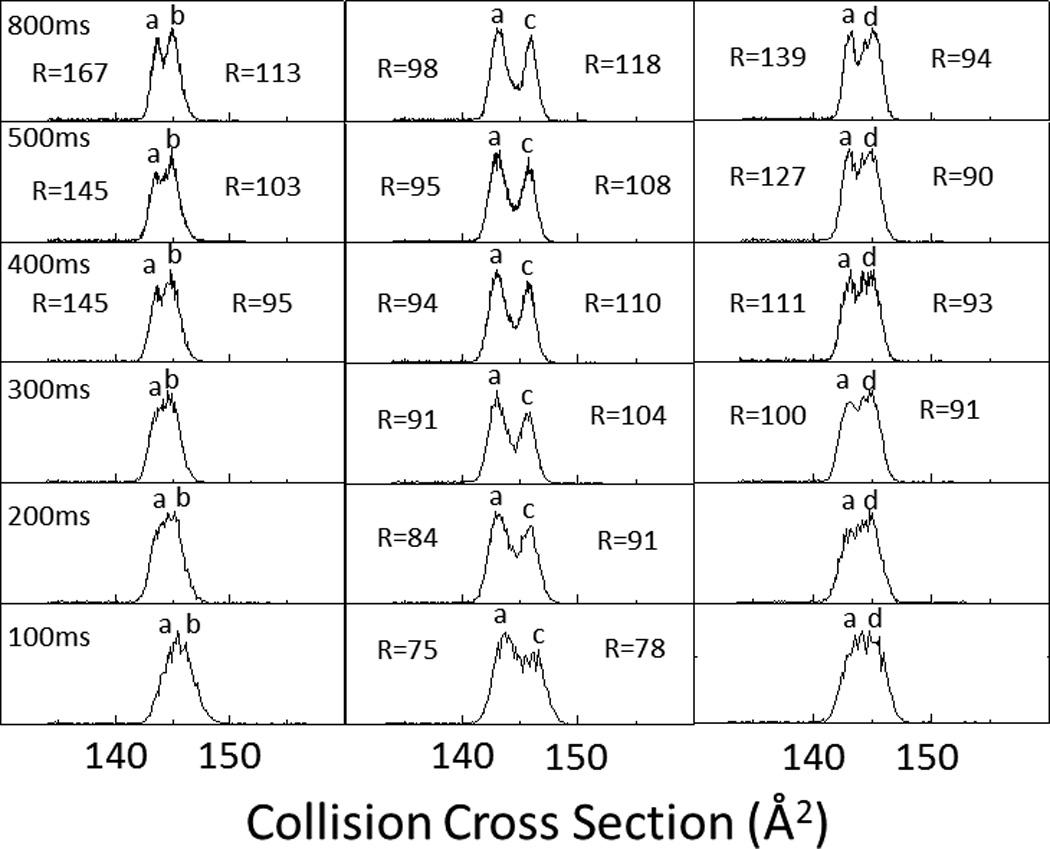
TIMS spectra as a function of the ramp time (100 – 800 ms) for a two component isobaric mixture of Triphenylene (a), Chrysene (b), 1,2-Benzanthracene (c), and 2,3-Benzanthracene (d). In the inset, TIMS peak resolution is shown for single components.
The use of TIMS-MS for the separation of PAH-containing complex mixtures is illustrated for the case of a soil standard (SC0 17) featuring over 16 different PAHs, including sets of structural isomers (Figure 3). Inspection of the 2D TIMS-MS contour plot shows a single trend line of singly charged species. Mobility projection plots are shown for three m/z's and illustrate the capability to separate molecular isobars in the TIMS domain (Figure 4). Although multiple peaks are observed at the level of nominal mass, the mass resolution of the mass analyzer (R= 30–40k) permitted the isolation of the PAH mass signal and the construction of the corresponding TIMS projection plot (Δ m/z < 0.2 Da, monoisotopic peak). Inspection of the mobility profiles shows that under theses low resolution TIMS conditions (70ms ramp time of and 20V ramp) some isobaric pairs are resolved (Figure 4 b and c) while other pairs are not resolved (Figure 4a). Comparison with the theoretical and single standard values shows that peaks that are not resolved have similar mobility values in a nitrogen bath gas (e.g., Anthracene and Phenantrene CCS(N2) = 128 Å2). Moreover, the PAH isobars that are resolved (Figure 4b and c) showed the correct relative abundance as the certified concentrations specified for the sample (see Supporting Information). The analysis time to generate a TIMS-MS data set is typically on the order of a few minutes, and low signal intensities from low abundance components can be compensated by summing multiple datasets. Additionally TIMS can improve signal-to-noise ratio in cases where the peak width is less than the ion accumulation time similar to conventional chromatography.
Figure 3.
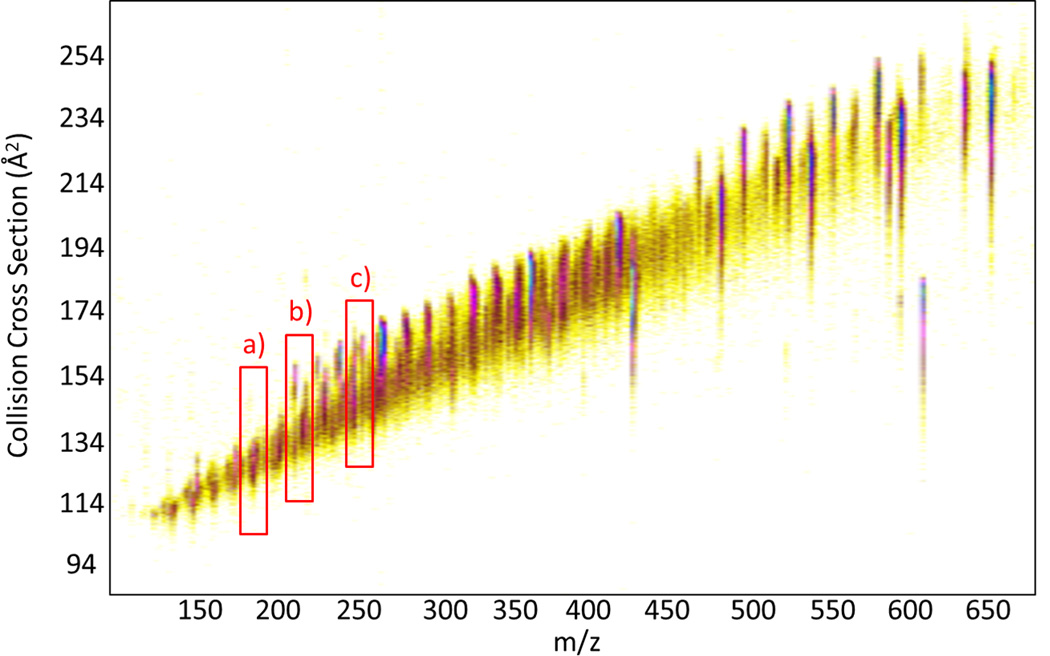
2D TIMS-MS contour plot of a fast scan (low resolution R~30–60) of a PAH mixture in soil (SC0 17) featuring over 16 different PAHs, including multiple sets of structural isomers.
Figure 4.
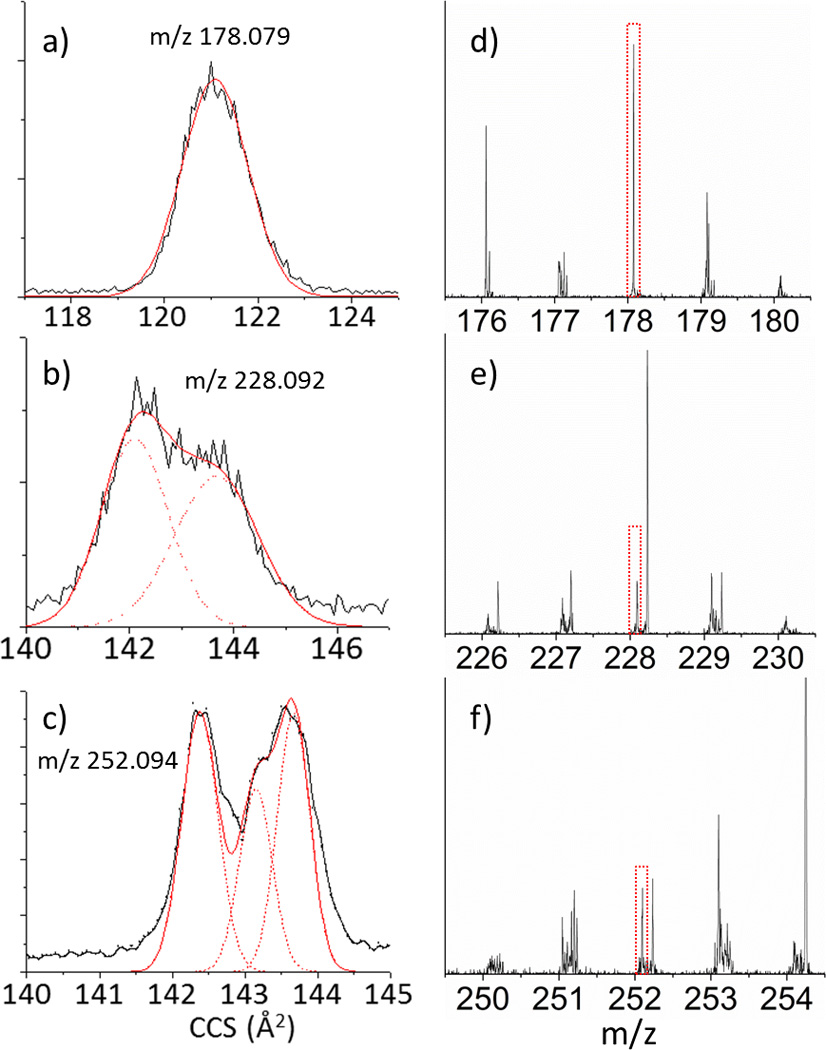
TIMS and MS projection plots for the insets shown in Figure 3 of the structural isobars a) Phenanthracene and Anthracene (not resolved), b) Chrysene (56%) and 1,2 Benzanthracene (44%), and c) Benzo(a)Pyrene (45%), Benzo(b)Fluoranthene(14%) and Benzo(k)fluoranthene (41%). d–f) Excerpts of the mass spectrum corresponding to the compounds in a–c.
Conclusions
The present study showed that comprehensive and fast characterization of PAH from complex mixture is feasible using TIMS-MS in the millisecond scale without the need of lengthy pre-fractionation separations. TIMS-MS has the added benefit that when combined with theoretical calculations permits the characterization of the conformational space of PAH and their separation from other chemical classes in a single analysis (or scan). Accurate ion-neutral collision cross sections were obtained for commonly encountered PAHs in the m/z= 124–523 with CCS(N2) = 114–232 Å2 range. A good agreement was obtained between the theoretical and experimental ion-neutral collision cross sections (<5%). The unique capability of TIMS to tune mobility resolution from low (R= 30–60) to high (R= 90–150) as a function of the analytical challenge was shown for the case of PAHs compounds from a soil extract.
Supplementary Material
Acknowledgements
This work was supported by the National Institute of Health (Grant No. R00GM106414) and a FFL Bruker Daltonics, Inc. fellowship. The authors wish to acknowledge Dr. Desmond Kaplan from Bruker Daltonics, Inc. for the development of TIMS acquisition software. The authors would like to thank Dr. Alexander Mebel (Florida International University) and Dr. Matthew Bush (University of Washington) for helpful discussions during the theoretical calculations and the use of MOBCAL for nitrogen, respectively.
Footnotes
Electronic Supplementary Information (ESI) available: Description of the soil standard (Table S1), experimental and theoretical CCS (Table S2) and the optimized geometry files for all reported PAH structures can be found in the supplementary information. See DOI: 10.1039/b0000000x/
Notes and references
- 1.Simoneit BRT. Mass Spectrom. Rev. 2005;24:719–765. doi: 10.1002/mas.20036. [DOI] [PubMed] [Google Scholar]
- 2.Rodgers RP, McKenna AM. Anal. Chem. 2011;83:4665–4687. doi: 10.1021/ac201080e. [DOI] [PubMed] [Google Scholar]
- 3.Angerer J, Mannschreck C, Gundel J. Int. Arch. Occup. Environ. Health. 1997;70:365. doi: 10.1007/s004200050231. [DOI] [PubMed] [Google Scholar]; Marczynski B, Preuss R, Mensing T, Angerer J, Seidel A, El Mourabit A, Wilhelm M, Bruning T. Int. Arch. Occup. Environ. Health. 2005;78:97. doi: 10.1007/s00420-004-0567-5. [DOI] [PubMed] [Google Scholar]
- 4.Jacob J, Seidel A. J. Chromatogry B. 2002;778:31. [Google Scholar]
- 5.Jongeneelen F. J. Sci. Total Environ. 1997;199:141. doi: 10.1016/s0048-9697(97)00064-8. [DOI] [PubMed] [Google Scholar]
- 6.Rossbach B, Preuss R, Letzel S, Drexler H, Angerer J. Int. Arch. Occup. Environ. Health. 2007;81:221. doi: 10.1007/s00420-007-0209-9. [DOI] [PubMed] [Google Scholar]
- 7.Smith CJ, Walcott CJ, Huang W, Maggio V, Grainger J, Patterson DG., Jr J. Chromatogry B. 2002;778:157. doi: 10.1016/s0378-4347(01)00456-x. [DOI] [PubMed] [Google Scholar]
- 8.Grova N, Monteau F, Le Bizec B, Feidt C, Andre F, Rychen GJ. Anal. Toxicol. 2005;29:175. doi: 10.1093/jat/29.3.175. [DOI] [PubMed] [Google Scholar]; Li Z, Romanoff LC, Trinidad DA, Hussain N, Jones RS, Porter EN, Patterson DG, Sjodin A. Anal. Chem. 2006;78:5744. doi: 10.1021/ac0606094. [DOI] [PubMed] [Google Scholar]; Gmeiner G, Gartner P, Krassnig C, Tausch H. J. Chromatogry. B. 2002;766:209. doi: 10.1016/s0378-4347(01)00471-6. [DOI] [PubMed] [Google Scholar]
- 9.Amorim LCA, Dimandja JM, Cardeal ZL. J. Chromatogry A. 2009;1216:2900–2904. doi: 10.1016/j.chroma.2008.11.012. [DOI] [PubMed] [Google Scholar]
- 10.Fernandez-Lima FA, Becker C, McKenna AM, Rodgers RP, Marshall AG, Russell DH. Anal. Chem. 2009;81:9941–9947. doi: 10.1021/ac901594f. [DOI] [PubMed] [Google Scholar]; Ahmed A, Cho Y, Giles K, Riches E, Lee JW, Kim HI, Choi CH, Kim S. Anal. Chem. 2014;86:3300–3307. doi: 10.1021/ac4032737. [DOI] [PubMed] [Google Scholar]; Ahmed A, Cho YJ, No Mh, Koh J, Tomczyk N, Giles K, Yoo JS, Kim S. Anal. Chem. 2010;83:77. doi: 10.1021/ac101934q. [DOI] [PubMed] [Google Scholar]; Maire F, Neeson K, Denny R, McCullagh M, Lange C, Afonso C, Giusti P. Anal. Chem. 2013;85:5530. doi: 10.1021/ac400731d. [DOI] [PubMed] [Google Scholar]
- 11.Fernandez-Lima FA, Kaplan DA, Park MA. Rev. Sci. Instr. 2011;82:126106. doi: 10.1063/1.3665933. [DOI] [PMC free article] [PubMed] [Google Scholar]; Feernandez-Lima FA, Kaplan DA, Suetering J, Park MA. Int. J. Ion Mobility Spectrom. 2011;14:93–98. doi: 10.1007/s12127-011-0067-8. [DOI] [PMC free article] [PubMed] [Google Scholar]
- 12.Schenk ER, Ridgeway ME, Park MA, Leng F, Fernandez-Lima F. Anal. Chem. 2013;86:1210–1214. doi: 10.1021/ac403386q. [DOI] [PMC free article] [PubMed] [Google Scholar]; Schenk ER, Mendez V, Landrum JT, Ridgeway ME, Park MA, Fernandez-Lima F. Anal. Chem. 2014;86:2019–2024. doi: 10.1021/ac403153m. [DOI] [PMC free article] [PubMed] [Google Scholar]
- 13.Hernandez DR, DeBord JD, Ridgeway ME, Kaplan DA, Park MA, Fernandez-Lima F. Analyst. 2014;139:1913–1921. doi: 10.1039/c3an02174b. [DOI] [PMC free article] [PubMed] [Google Scholar]
- 14.Flanagan LA. 5872357. United States Patent. 1999
- 15.McDaniel EW, Mason EA. Mobility and diffusion of ions in gases. New York: John Wiley and Sons, Inc., New York; 1973. p. 381. [Google Scholar]
- 16.Frisch MJ, Trucks GW, Schlegel HB, Scuseria GE, Robb MA, Cheeseman JR, Montgomery JJA, Vreven T, Kudin KN, Burant JC, Millam JM, Iyengar SS, Tomasi J, Barone V, Mennucci B, Cossi M, Scalmani G, Rega N, Petersson GA, Nakatsuji H, Hada M, Ehara M, Toyota K, Fukuda R, Hasegawa J, Ishida M, Nakajima T, Honda Y, Kitao O, Nakai H, Klene M, Li X, Knox JE, Hratchian HP, Cross JB, Bakken V, Adamo C, Jaramillo J, Gomperts R, Stratmann RE, Yazyev O, Austin AJ, Cammi R, Pomelli C, Ochterski JW, Ayala PY, Morokuma K, Voth GA, Salvador P, Dannenberg JJ, Zakrzewski VG, Dapprich S, Daniels AD, Strain MC, Farkas O, Malick DK, Rabuck AD, Raghavachari K, Foresman JB, Ortiz JV, Cui Q, Baboul AG, Clifford S, Cioslowski J, Stefanov BB, Liu G, Liashenko A, Piskorz P, Komaromi I, Martin RL, Fox DJ, Keith T, Al-Laham MA, Peng CY, Nanayakkara A, Challacombe M, Gill PMW, Johnson B, Chen W, Wong MW, Gonzalez C, Pople JA. Wallingford CT: In Gaussian, Inc.; 2004. [Google Scholar]
- 17.Mesleh MF, Hunter JM, Shvartsburg AA, Schatz GC, Jarrold MF. J. Phys. Chem. 1996;100:16082–16086. [Google Scholar]
- 18.Shvartsburg AA, Jarrold MF. Chem. Phys. Lett. 1996;261:86–91. [Google Scholar]
- 19.Campuzano I, Bush MF, Robinson CV, Beaumont C, Richardson K, Kim H, Kim HI. Anal. Chem. 2011;84:1026–1033. doi: 10.1021/ac202625t. [DOI] [PubMed] [Google Scholar]
- 20.Singh UC, Kollman PA. J. Comp. Chem. 1984;5:129–145. [Google Scholar]; Besler BH, Merz KM, Kollman PA. J. Comp. Chem. 1990;11:431–439. [Google Scholar]
- 21.Young D, Douglas KM, Eiceman GA, Lake DA, Johnston MV. Analytica Chimica Act a. 2002;453:231–243. [Google Scholar]
Associated Data
This section collects any data citations, data availability statements, or supplementary materials included in this article.


