Although considerable evidence suggests that the chemical synapse is a lynchpin underlying affective disorders, how molecular insults differentially affect specific synaptic connections remains poorly understood. For instance, Neurexin 1a and 2 (NRXN1 and 2) and CNTNAP2 (aka. CASPR2), all members of the neurexin superfamily of transmembrane molecules, have been implicated in neuropsychiatric disorders. However, their loss leads to deficits that have been best characterized with regard to their impact on excitatory cells1,2. Notably, other disease-associated genes such as BDNF and ErBb4 implicate specific interneuron synapses in psychiatric disorders3,4. Consistent with this, cortical interneuron dysfunction has been linked to epilepsy, schizophrenia, and autism5,6. Using a microarray screen that focused upon synapse-associated molecules, we identified Cntnap4 (contactin-associated protein 4, also known as Caspr4) as highly enriched in developing interneurons. In this study we show that Cntnap4 (aka. Caspr4) is localized presynaptically and its loss leads to a reduction in the output of cortical PV-positive GABAergic basket cells. Paradoxically, the loss of Cntnap4 augments midbrain dopaminergic release at the nucleus accumbens. In Cntnap4 mutant mice, synaptic defects in these disease-relevant neuronal populations are mirrored by sensory-motor gating and grooming endophenotypes; These symptoms could be pharmacologically reversed, providing promise for therapeutic intervention in psychiatric disorders.
Having identified Cntnap4 in developing cortical interneurons, we examined its expression at later stages of development. In situ hybridization revealed that it is widely but sparsely distributed in a manner similar to cortical interneurons. Double in situ hybridization demonstrated that almost all Cntnap4-positive cells within the somatosensory cortex are GAD67-positive (Fig. 1a and Extended Data Fig. 1b). Using a Cntnap4-EGFP knock-in allele (Extended Data Fig. 1a), we assessed its expression in interneuron subtypes. Analysis at postnatal day 21 revealed that many eGFP+ neurons also expressed PV (47% ± 4). Conversely, 64 ± 3% of all PV+ interneurons were eGFP+ (Fig. 1b and Extended Data Fig. 1d and e). The remaining 53% of Cntnap4-eGFP+ neurons were immuno-positive for other interneuron markers, reelin, VIP, NPY and calretinin, but not somatostatin (Extended Data Fig. 1c). As the mice matured, there was a steady rise in the percentage of Cntnap4-eGFP+ PV cells. By P60 almost all PV cells expressed Cntnap4 (94% ± 3; PV+ cells as a proportion of total Cntnap4-eGFP+ cells was 76% ± 2) (Fig. 1B), suggesting a possible involvement of Cntnap4 in their maturation. In addition, Cntnap4 expression was also enriched in the substantia nigra pars compacta (SnC) and ventral tegmental area (VTA) midbrain dopaminergic projection populations. Approximately 90% of the tyrosine hydroxylase (TH)-positive dopaminergic neurons also expressed Cntnap4 (Fig. 1c).
Figure 1. Cellular and subcellular localization of Cntnap4.
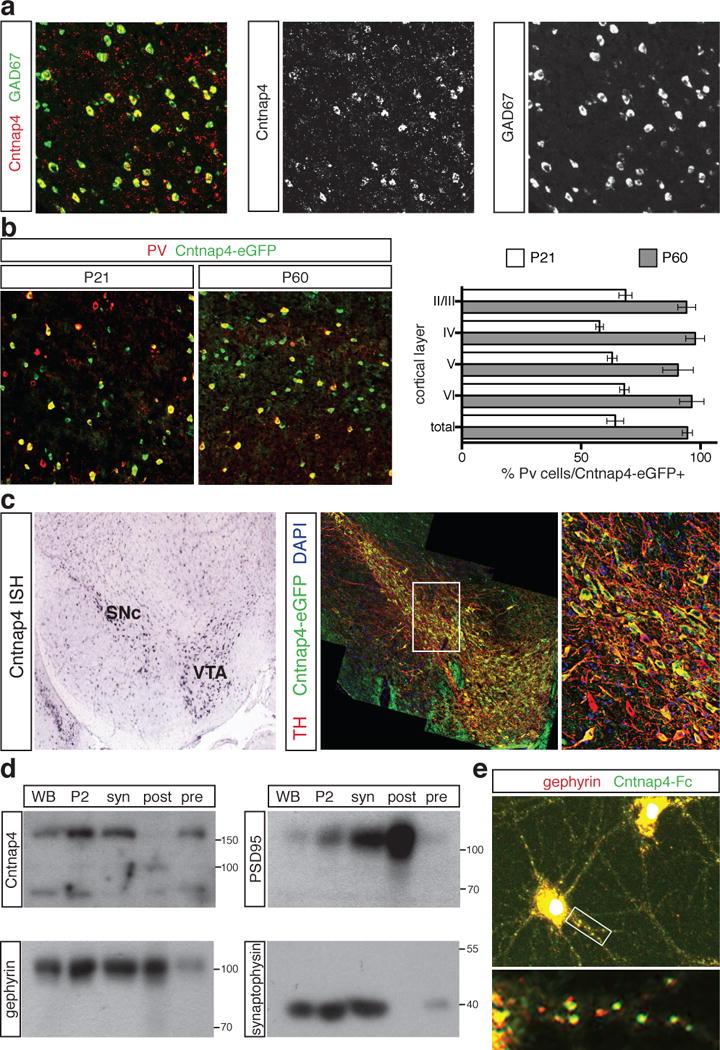
A. Double fluorescent in situ hybridization on P21 WT somatosensory cortex with colocalization of Cntnap4 (green) and GAD67 (red).
B. Overlap between parvalbumin (PV) (red) and Cntnap4 (eGFP knock-in) at P21 and P60.
C. In situ hybridization of Cntnap4 in VTA and SNc of P21 WT (Allen Brain Atlas) and Cntnap4-eGFP (green) co-localization with tyrosine hydroxylase (red) at P21. Close-up of white square on right.
D. Western blots on whole brain (WB), total membrane (P2), synaptosomes (syn), presynaptic (pre) and postsynaptic (post) compartments. Cntnap4 present at presynaptic site (pre). Internal controls for pre-(synaptophysin) and post-synaptic (gephyrin and PSD95) fractions.
E. Cntnap4-Fc fusion protein (green) binds to soma and proximal dendrits, apposed to gephyrin puncta (red) in dissociated cortical neurons.
Previously, Cntnap4 was shown to associate with presynaptic proteins such as NB-2/Contactin-5, as well as Mint1 and CASK, which are important for inhibitory synapses7–10. We examined pre- and post-synaptic fractions prepared from WT and KO Cntnap4 animals. Cntnap4 was found to be enriched in synapses, exclusively within the presynaptic compartment (Fig. 1d). These results were extended by using a fusion of Cntnap4 and Fc domains on hippocampal neuronal cultures, demonstrating the majority of Cntnap4 protein is found on the cell body and proximal dendrites in a punctate pattern, co-localized with gephyrin (Fig. 1e and Extended Data Fig. 1f). Hence, Cntnap4 is highly expressed in cortical PV cells and midbrain dopaminergic neurons and is localized presynaptically.
To assess Cntnap4 function, we generated two lines of Cntnap4 null mice of mixed inbred background (line #149, line #13) by replacing the first coding exon of Cntnap4 with eGFP and a Neo cassette (Extended Data Fig 1a). Focusing primarily on the 149 line, we examined the functional consequences of Cntnap4 loss to the dopaminergic and GABAergic populations. We used fast-scan cyclic voltammetry to monitor axonal dopamine spillover in the caudate putamen (CPu) and nucleus accumbens (NAc) of HET (heterozygous), KO (knock out) and WT (wild type) mice11. Dopamine release was evoked by single or brief pulse trains (20 pulses at 10 Hz or 5 pulses at varying frequencies). Both HET and KO compared to WT animals, showed an increase in peak extracellular dopamine concentration ([DA]o) that was more pronounced in the NAc than CPu, especially with multiple pulse stimulation (Fig. 2a). Moreover, evoked [DA]o was enhanced evenly across frequencies varying from 5 to 100 Hz (Extended Data Fig. 2a) indicating both tonic and phasic firing are affected. Analysis of the maximum dopamine uptake rate, Vmax12, revealed that the rates were somewhat higher in HET and KO animals compared to WT (CPu: 7.48 ± 0.30 μM/s mutants versus 7.25 ± 0.43 μM/s in WTs; NAc: 5.39 ± 0.23 μM/s mutants versus 4.95 ± 0.23 μM/s in WTs). However, the excitability of dopaminergic neurons between KO and WT cells appeared unaffected (data not shown). Hence, increased evoked [DA]o in Cntnap4 mutants does not appear to be a consequence of impaired DA transporter activity or intrinsic electrophysiological properties. We conclude that Cntnap4 normally acts to attenuate dopamine release through a presynaptic mechanism.
Figure 2. Cntnap4 mutant mice show increased dopamine, but decreased GABA signaling.
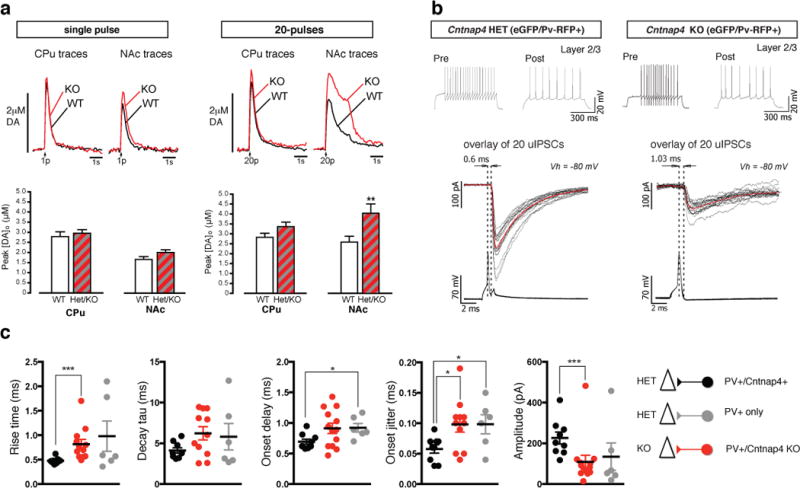
A. Evoked dopamine measurements by voltammetry in vitro in WT and mutant. Increased extracellular dopamine release in mutants vs. WT. 20 pulses lead to a significant increase in NAc. Representative traces of extracellular dopamine concentration levels [DA]o in time of WT (black) versus KO mouse (red). Distribution of peak [DA]o values for all the data points included in the analysis (n = 3 for each genotype).
B. Paired recordings between PV-positive and excitatory cells in somatosensory cortex in vitro. Examples of firing in pre- and post-synaptic cells.upon step depolarization. A single action potential evokes fast, reliable postsynaptic responses in HET. Responses smaller, slower and more unreliable in KO (in grey are the individual traces and in red the average).
C. Overall data of synaptic values for responses recorded in three groups of paired recordings. Black denotes presynaptic Cntnap4-positive PV cells in HET mice; grey denotes PV cells yet to express Cntnap4 in HET mice; red denotes PV cells in KO mice.
Given the DA findings, we expected that GABAergic signaling would also be elevated in mutant mice. However in Cntnap4 KO animals compared to controls, spontaneous inhibitory postsynaptic currents (sIPSCs) from pyramidal cells of layer II/III were fewer, smaller and slower (Extended Data Fig. 2b). Intriguingly, paired-cell recordings between PV and excitatory cells in KO mice had synaptic responses reminiscent of those in immature FS cells13 (Fig. 2b). IPSC amplitude was reduced and kinetics were prolonged, with longer rise-times and decay tau values (Fig. 2b and c, Extended Data Fig 2c). In addition, the average latency of the IPSCs was marginally increased and between-trials variability (jitter) was larger (Fig. 2b and c). Some of these defects persisted into adulthood and hence were not due to developmental delay (Extended Data Fig. 3a). By comparing Cntnap4-positive and Cntnap4-negative PV interneurons at P21 (Fig. 2c) we showed that negative cells resembled mutant neurons. This indicates not only that the defects we saw are cell-autonomous (Cntnap4-negative PV-positive interneurons, gray symbols versus Cntnap4 KO cells, red symbols, Fig. 2c), but also that Cntnap4 appears necessary for the full maturation of the output of PV-positive interneurons.
How then does the loss of Cntnap4 affect the function of PV interneurons? A change in the probability of release seems unlikely as the paired pulse ratios in HET and KO PV interneurons were unchanged (Extended Data Fig. 2d). Moreover, no obvious differences in intrinsic firing properties, morphology or synaptogenesis between WT, HET and KO animals (Extended Data Fig. 4a–c) were observed. Another possible mechanism is a failure to transition from N-type to P/Q-type presynaptic calcium channels13,14. However, application of the specific N-type calcium channel blocker Ω-conotoxin GVIA in KO paired recordings (n=3) produced no change in postsynaptic responses (Extended Data Fig 2e). Yet another possibility is that Cntnap4 affects the localization of postsynaptic GABAA receptors. Protein samples from P60 Cntnap4 WT and KO cortex were sub-fractionated and tested by western blot for levels of GABAA γ2 (probes for synaptically-localized GABAA receptors) as well as GABAA α1 (enriched in FS-pyramidal synapses) and, if anything, we observed a slightly elevated level for both receptor subunits in Cntnap4 KO samples (Extended Fig. 4d). As Cntnap proteins help localize GPi-anchored cell adhesion molecules15 and neurexins16 play a structural adhesion role at the synapse, we examined symmetric perisomatic synapses onto pyramidal cells by electron microscopy (EM) in adult KO, HET and WT animals (Fig. 3a). We observed that the cleft width was significantly larger in the HET versus WTs, and was further increased in the KO (WT: 14.37 ± 0.28 nm, HET: 15.61 ± 0.28 nm, KO: 17.37 ± 0.43 nm) (Fig. 3a and b), while the PSD was shortest in the KO and intermediate in HET compared to WT mice (Fig. 3a and b) (WT: 221.71 ± 7.34 nm, HET: 195.45 ± 6.9 nm, KO: 185.34 ± 6.67 nm). By contrast, excitatory (compared to inhibitory) synapses exhibited a significant but milder widening of the synaptic cleft in KO versus WT mice (6.4% versus a 20.8% increase (Extended Data Fig. 5) and no difference in excitatory PSD length. Our results show that Cntnap4 joins the short list of molecules that contribute to the structural maturation of inhibitory interneuron synapses3,4,17,18 and acts in a gene dose-dependent manner19.
Figure 3. Loss of Cntnap4 results in ultrastructural deficits in perisomatic inhibitory synapses.
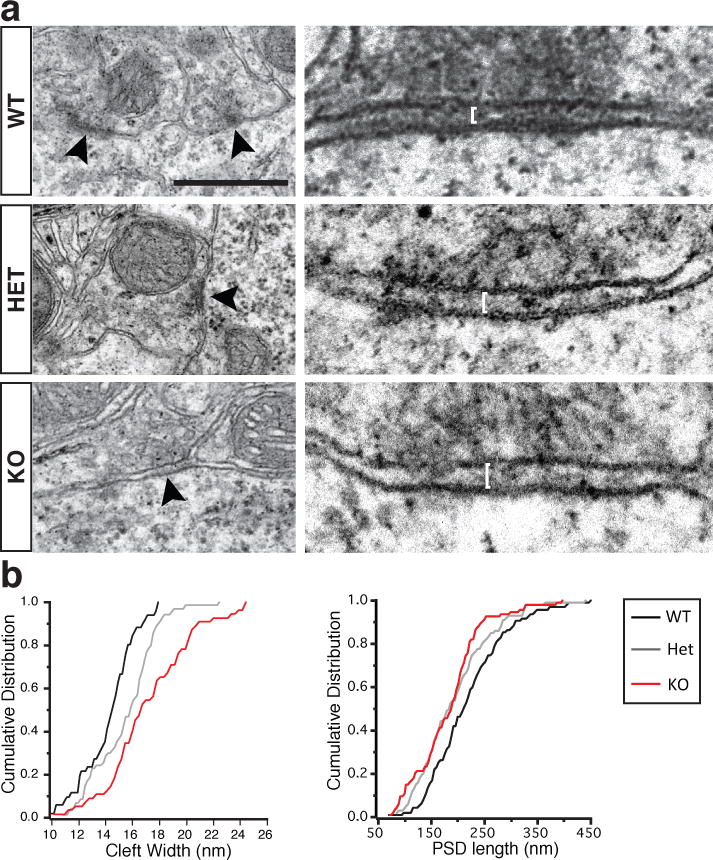
A. Electron micrographs of symmetric perisomatic synaptic contacts in WT, HET and KO littermate mice (black arrowheads). Higher magnification on right (white bars indicate cleft width). Scale bar 500nm.
B. Cumulative distributions of cleft width and PSD length. (PSD width WT vs. KO < 0.0001, WT vs. HET = 0.002, HET vs. KO = 0.005; PSD length WT vs. KO = 0.007, WT vs. HET = 0.049, HET vs. KO = 0.399).
A number of synaptic molecules, including Cntnap2, have been extensively implicated in neuropsychiatric disorders. Given the synaptic localization of Cntnap4 and its differential effects on synaptic transmission in dopaminergic versus GABAergic neurons, it is a promising disease target. Indeed, in addition to a handful of previously reported cases (see Extended Data Fig. 6a and Supplementary Results) our human genetics analysis identified 8 individuals with psychiatric illness and CNTNAP4 gene disruption. Two harbored coding deletions, with one missing the whole gene, the other lacking the last 3 exons. The remaining six individuals had non-coding deletions, all contained within the 5′ region of intron II (Extended Data Fig. 6a and Supplementary Results and Extended Data Fig. 6–8). Given these findings and the behavioral abnormalities described in Cntnap2 mutant animals1, we tested whether Cntnap4 HET or KO mice exhibited abnormal behaviors consistent with neuropsychiatric disorders: grooming, prepulse inhibition (PPI), marble burying, and behavior in an Open Field Arena (OFA) and an Elevated Plus Maze (EPM).
Repetitive, perseverative movements comprise a common behavioral abnormality in individuals with ASDs and manifest in mice as over-grooming20,21. Both KO and HET Cntnap4 mice displayed a severe and highly penetrant over-grooming behavior, resulting in whisker, face and sometimes body lesions (Fig. 4a). This was observed equally in male and female mice, and was apparent prior to weaning (Fig. 4b). It was even evident in wild type offspring raised by mutant parents. By cross-fostering, we established unequivocally that allo-grooming in affected litters was always associated with the presence of a mutant Cntnap4 allele (HET or KO) in one or both of the parents (Extended Data Fig. 9g). Strain differences also affected this behavior, as line #13 did not display robust over-grooming when crossed onto an outbred background, but re-gained it when re-crossed into an inbred strain (Supplementary Results). Moreover, the observed over-grooming behavior in mutant mice is unlikely to stem from overt changes in anxiety levels or deficits in locomotion, since OFA, EPM and marble burying tests did not reveal significant differences between the three genotypes (Extended Data Fig. 9a–f).
Figure 4. Aberrant behavior exhibited by Cntnap4 mutant mice can be rescued by specific pharmacological intervention.
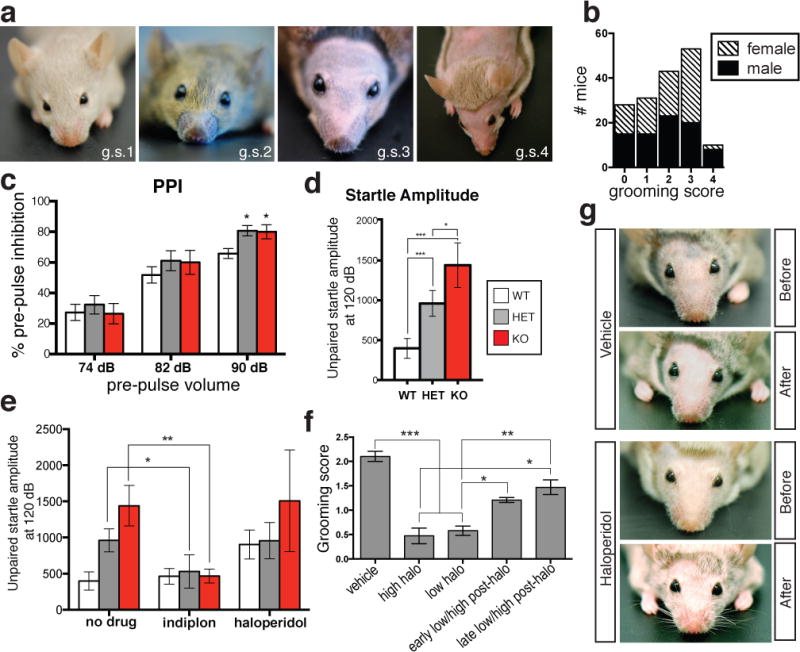
A. Over-grooming score (g.s) in Cntnap4 mutant mice from 1–4. (1 = lacks whiskers; 2 = lacks whiskers and snout hair ; 3 = complete facial hair loss; 4 = additional body hair loss)
B. Grooming score for 165 Cntnap4 mice.
C. Increase in Pre-Pulse Inhibition at 90dB between mutant and WT (n = 15 WT, n = 12 HET, n = 10 KO; WT vs. Het, p<0.05; WT vs. KO, p<0.05; one-way ANOVA, Tukey’s post-hoc test).
D. Increase in startle response amplitude in mutant vs. WT (n = 15 WT, n = 12 HET, n = 10 KO; WT vs. Het, p<0.05; WT vs. KO, p<0.01; Het vs. KO, P<0.05; one-way ANOVA-Tukey’s post-hoc test).
E. Startle amplitude normalized upon acute administration of indiplon, unaffected by chronic delivery of haloperidol.
F. Amelioration of over-grooming behavior by chronic haloperidol (halo) administration. After halo regimen, over-grooming returns. Early halo is 90 days after implantation; late halo is 180 days after implantation (n = 58 pups for vehicle, n = 19 pups for high haloperidol, n = 44 for low haloperidol, n = 24 pups for early post-halo, n = 17 pups for late post-halo).
G. Representative vehicle- and haloperidol-treated adult HET before and after 60 days halo. Re-emergence of facial hair and whiskers in treated mouse only.
In addition to perseverative behaviors, neuropsychiatric patients often show impaired ability to process sensory information22. We performed PPI of the auditory startle reflex22,23 and found that HET and KO mice exhibited both elevated startle responses and abnormal PPI indexes (Fig. 4c and d). Based on our cellular findings, we reasoned that the behavioral phenotypes might be reversed by augmenting inhibitory output and by dampening dopaminergic signaling.
There is extensive literature that links increased activity in the dopaminergic system and overt repetitive behaviors, both in mice and humans24,25. We therefore administered the D2 receptor antagonist haloperidol via slow-release pellets (0.2 mg/kg or 0.6 mg/kg) implanted subcutaneously26. Haloperidol-treated parents showed a significant reduction in their own grooming score and did not over-groom their pups (Fig. 4f). In contrast, the pairs treated with vehicle did not show any overall hair and/or whisker recovery and continued to over-groom themselves and their offspring (Fig. 4f). After the 90-day treatment period when haloperidol levels were depleted, over-grooming progressively re-emerged (Fig. 4f and g). The effect of haloperidol on grooming was not the result of hypoactivity (Extended Data Fig. 10a). Therefore, increased dopaminergic signaling in the striatal complex of mutant Cntnap4 mice in vivo leads to over-grooming, a behavior that can be rescued by chronic pharmacological treatment.
In order to assess if the defects in GABAergic transmission can account for the heightened startle or PPI defect in Cntnap4 mutant animals, indiplon was administered. Indiplon is a highly specific positive allosteric modulator for GABAA receptors containing the α1 subunit27,28, enriched in PV basket cells synapses29. Indeed, indiplon application in vitro (300 nM) enhanced spontaneous IPSCs recorded from layer 2–3 cortical pyramidal cells of Cntnap4 mutant mice (Extended Data Fig 10c). Acute administration of indiplon by oral gavage27 restored the startle response in KO and HET to WT levels (Fig. 4e). At the same dosage, WT animal startle was unaffected (Fig. 4e). Indiplon did not however affect PPI in KO, HET or WT animals (Extended Data Fig. 10b). This suggests that the GABAergic system is involved in the proper maturation of sensory-motor processing. Consistent with defective PV cell output, Cntnap4 mutant mice exhibited mild epileptiform-like activity under deep anaesthesia that was not seen in controls (Extended Data Fig. 3b).
Our results show that Cntnap4 is located presynaptically and suggest that it functions in two distinct ways depending on the system. In dopaminergic synapses, which work by volume transmission on a relatively slow timescale, mis-regulated release plays a prominent role. In contrast, the GABAergic system works through fast synaptic transmission to deliver properly timed inhibition, and as a result the structural abnormality in the synapses predominates and leads to less efficient output with slower kinetics. Thus, in each instance, the kinetics of the system dictates the outcome of the loss of protein. Intriguingly, our findings that the loss of Cntnap4 results in opposing failures in neurotransmission in the dopaminergic and GABAergic systems line up well with the deficiencies observed in neuropsychiatric patients5,30.
Methods Summary
Cntnap4 knock-in mice used in this study were generated by introducing eGFP in frame with Cntnap4 start codon. To characterize gene expression, eGFP was used to represent Cntnap4-expressing cells in the brain. Western blot analysis for Cntnap4 localization was performed on adult mouse cortex using a Cntnap4 rabbit polyclonal antibody described previously8. Cntnap4-Fc fusion protein was applied to live neuronal cultures for in vitro localization studies. Evoked extracellular dopamine release was measured using fast-scan cyclic voltammetry of P60 in vitro slice preparations in WT, HET and KO animals11. For paired cell recordings between FS and excitatory neurons, Cntnap4 mice were crossed to a parvalbumin-cre:RFP reporter background to enable targeted physiological recordings. For synaptic ultrastructural analysis, P60 Cntnap4 WT, HET and KO animals were analyzed by electron microscopy, focusing on perisomatic inhibitory synaptic contacts. Cntnap4 mice were assessed by a number of behavioral analyses including grooming score and pre-pulse inhibition28,29 (San Diego Instruments). Pharmacological rescue was performed using indiplon (Tocris), which was administered acutely by oral gavage as well as haloperidol (Innovative Research of America), which was delivered chronically via subcutaneous slow-release pellet27.
Materials and Methods
Human genetics
CNV Identification
The subjects included in this study that have been reported in previously published work have given their consent1,2,3. In the case of the new cohort of 784 patients with ASD, it was approved by the local Institutional Review Board (IRB) and written inform consents were obtained from all participants of the study. The local IRB are the “Comité de Protection des Personnes” (Île-de-France Hôpital Pitié-Salpêtrière Paris, France). Written informed consent was obtained from all participating subjects. Since proband of family II was under 18 years old, the proband’s consent and written parental consent were obtained.
Genome-wide SNP genotyping for ASDs1 and ADHD2 cases and controls was done using the InfiniumII HumanHap550 BeadChip (Illumina) at the Center for Applied Genomics at the CHOP and with the Illumina Infinium 1M array at the Centre for National Genotyping (CNG, Evry, France). Schizophrenia3 samples were genotyped using the Affymetrix 6.0 array. To identify CNVs, we used PennCNV and QuantiSNP. Quality metrics for inclusion included: identification rate >98%, standard deviation of the normalized intensity (LRR) < 0.35, European descent based on principle components analysis, low genomic inflation factor between case and control populations, |GC base pair wave factor| < 0.05, CNV call count <70 and no duplicate samples. Statistical association was assessed using Fisher’s exact test.
CNV Validation
TaqMan® Copy Number Assay experiments were run on Applied Biosystems 7900HT Fast Real-Time PCR System to validate the presence of deletions on CNTNAP4. Applied Biosystems CopyCaller™ Software performed relative quantitation analysis of genomic DNA targets using the real-time PCR data from TaqMan® Copy Number Assay experiments or the Universal Probe Library (UPL) system from Roche. HS05422219_cn assayed Chr16:74920706 (hg18) on the CHOP deletion overlapping region. Each assay was conducted in 2–3 replicates for target region probe-set and control region probe-set. All deletions predicted by the Illumina array data were positively validated. To test if the deletion extended across the upstream exon 2 of CNTNAP4 which was not definitive based on the Illumina probe resolution, HS02779798_cn assayed Chr16:74907734 (hg18) just upstream of CNTNAP4 exon 2. All samples showed diploid signals indicating that exon 2 was not overlapped by the deletions. Positive and negative controls were used to confirm probe accuracy.
SNP Analysis
A sample of 232 individuals meeting diagnostic criteria for schizophrenia or schizo-affective disorder and their families were genotyped on a Human Genome-Wide SNP Array 5.0 (Affymetrix), which contains 500,568 SNPs (manuscript in preparation). Among the available data, we extracted information on 1045 genotyped and imputed SNPs spanning the CNTNAP4 locus and 500 bp on either end of the gene. The sample has been previously described in detail4–7. Average call rate on arrays used in this study was 99.43%. All microarray experiments were performed in the Vanderbilt Microarray Shared Resource. Quality control procedures per family, individual, and marker were performed with PLINK (http://pngu.mgh.harvard.edu/purcell/plink/)8 and PedStats (http://www.sph.umich.edu/csg/abecasis/PedStats/). Following quality control we selected samples with a call rate > 95%. We eliminated from the analysis duplicated SNPs, monomorphic SNPs, and SNPs with Hardy-Weinberg exact test P < 10−6. Only SNPs with minor allele frequency > 0.01 were included in the downstream analyses. We also checked for Mendelian inheritance errors among families and removed SNPs with > 4 Mendelian errors in the total sample. Imputation of non-genotyped HapMap SNPs was performed with MACH (http://www.sph.umich.edu/csg/abecasis/MACH/) using 100 MarKOv iterations with the two-step procedure recommended in the manual. HapMap Phased Haplotypes (release 22) on CEU subjects were used in the imputation. After imputation, only SNPs with a MACH R2 > 0.3 were further considered. This estimates the correlation between imputed and true genotypes; a value less than 0.3 flags poorly imputed SNPs9. In addition, Mendelian checks and Hardy-Weinberg equilibrium tests were performed to eliminate unreliable imputation calls in order to include imputed genotypes in downstream analyses. Imputed SNPs were then analyzed similarly to the genotyped SNPs. Family-based association tests for single SNPs were performed using LAMP (http://www.sph.umich.edu/csg/abecasis/LAMP/). LAMP assesses association by taking into account linkage information from the pedigrees and the multiple generations in the pedigrees and appropriately corrects for family structure10,11. We adopted a free model for the analysis that does not constrain the penetrance for the three genotypes.
Generation of mutant mice
The Cntnap4 targeting vector was designed to replace a genomic fragment of 585 bp containing the first exon of the gene, encoding the ATG and the signal sequence, with an in frame egfp, followed by an oppositely directed neo gene (Fig.1B). A 2.45kb genomic fragment located upstream of exon 1 was amplified by PCR from 129SvJ genomic BAC library using primers gacagtcttaaatagcctagaatc – ctccagcgctctgagagcca, and cloned into pKO-901 Scrambler vector (Lexicon Genetics) containing a GFP. A 6.6kb fragment downstream of exon 1 was amplified using primers gacatactgcagacttcgcgg – catgcaccatgtatgcgcagga, and cloned into the same plasmid, followed by the insertion of a neomycin selection cassette between the two homology arms. A promoter-driven diphtheria toxin A fragment (DT) that was then added and used to select against random integration. This targeting vector resulted in a deletion of 585 bp R1 ES cells were electroporated with the linearized targeting construct, and recombinant ES clones were selected with G418. Clones containing correctly targeted integrations were identified by Southern blot analysis of EcoRI-digested genomic DNA using a probe (prepared by PCR using primers catgtataagctctctccttccg – CTGACAGCACAGHGCCCAGACC) located outside of the targeting vector sequence. Correctly targeted ES cell lines were used to produce chimeric mice by aggregation, as described before12. Chimeric mice were mated with ICR females, and germ-line transmission was detected by coat color and Southern analysis of tail DNA. Genotyping of progenies was performed by PCR of genomic tail DNA using the primer sets described in Fig.1A; a – (within the first intron) ACACTACTTAAGCGGGTGGTG, b – (within exon 1) GGATCTGTCGCTGGAGCTG, and c – (within the neo gene) CCTCTGAGCCCAGAAAGCG. Two lines were generated (designated #13 and #145) from two different ES clones. These lines were backcrossed once (#149) or five times (#13) to ICR and then kept intercrossed. Most of the data presented was obtained using KO line #149. All experiments were performed in compliance with the relevant laws and institutional guidelines and were approved by the Animal Care and Use Committees of NYU and the Weizmann Institute.
RNA analysis
Total RNA was isolated from freshly dissected tissues using either TRI-reagent (Sigma-Aldrich) and cDNAs were obtained with SuperScript-II reverse transcriptase (Invitrogen) using oligo-dT. The following specific PCR primer sets were used for RT-PCR analysis: actin GAGCACCCTGTGCTGCTCACCGAGG and GTGGTGGTGAAGCTGTAGCCACGCT; Cntnap4 (exons 1–3), GGATCTGTCGCTGGAGCTG and CCACTATCACTGAACATCAGG; Cntnap4 (exons 2–4), GGTCCCCACTTGTGTCCAAC and TACAACCACCGGTATGCAC.
Antibodies and Western blot analysis
Brains were homogenized in 20 mM Hepes pH 7.4, 0.32 M Sucrose, 1 mM EGTA, 1.5 mM MgSO4, Protease inhibitors (Sigma P8340) centrifuged at low speed (1000 × g) for 10 mintues. Supernatants were collected and centrifuged at high speed (20000 × g) for 1 hour. Pellets were then solubilized in 2% NP-40, 2mM MgCl2, protease inhibitors (Sigma P8340) in PBS, incubated on ice for 15 minutes and centrifuged at high speed (20000 × g) for 15 minutes. SDS-PAGE and Western blotting was done as previously described13 with the exception that the chemiluminescence signal was detected using the ChemiDoc MP System (Bio-Rad). Affinity purified antibodies against Cntnap4 (rb 1:500) were generated as described previously using a GST- Cntnap4CT Sepharose14.
To quantify postsynaptic GABAA receptors and other synaptically localized proteins, the following antibodies were employed: GABAA α1 (NeuroMab, ms 1:1000); GABAA γ2 (PhosphoSolutions, rb 1:1000); N-Cadherin (BD Pharmingen, ms 1:1000); PSD-95 (NeuroMab, ms 1:1000); gephyrin (Synaptic Systems, ms 1:1000). Blots were visualized using IRDye secondary antibodies (Li-Cor, 1:30 000), scanned and quantified using the Li-Cor Odyssey system.
Presynaptic and postsynaptic fractionation
Synaptosomal fractions from mouse brain were prepared as described previously15. Presynaptic and postsynaptic fractions were prepared from synaptosomes by extraction at differential buffer pH as described previously16,17. Equal amount of fractions (20 micrograms) were loaded onto SDS-PAGE gel. Western blots were probed with different antibodies. Synaptophysin was used as loading control for WB, P2, whole synaptosome, and presynaptic fractions. PSD-95 was used as loading control for postsynaptic fractions.
In vitro voltammetric dopamine recordings
Coronal striatal slices (350μm thick) were prepared from male littermate Cntnap4+/+, Cntnap4−/+ and Cntnap4−/− mice (3 to 4 months old, 4 mice per genotype, 2 slices per mouse) using a VT1200S vibrating blade microtome (Leica Microsystems) and allowed to recover for at least an hour at room temperature as described previously18,19. To decrease any bias in dopamine recordings, we examined 2 mice per experimental day using a design in which each mouse genotype was assessed either first or second on the experimental day and paired with one of each of the other genotypes.
For recording, slices were transferred to a submersion chamber (Warner Instruments) maintained at 32°C and superfused at 1.2 mL/min with bicarbonate-buffered aCSF containing (in mM): NaCl (124); KCl (3.7); NaHCO3 (26); MgSO4 (1.3); KH2PO4 (1.3); glucose (10); CaCl2 (2.4), and saturated with 95% O2/5% CO2. After a brief equilibration period of 30 min, fast-scan cyclic voltammetry with carbon fiber electrodes was used to monitor [DA]o evoked by local electrical stimulation (0.1 ms pulse duration, 0.4 mA amplitude) CPu and NAc core, as described previously18,19. Carbon-fiber electrodes (30–70 μm length) were constructed in-house using un-sized 7 μm diameter carbon fibre (Goodfellows) according to methods described by Patel and Rice18. Fast-scan cyclic voltammetry measurements were made using a Millar voltammeter (available by special request to Dr. Julian Millar at St. Bartholomew’s and the Royal London School of Medicine and Dentistry, University of London, UK). The scan range used was −0.7 V to +1.3 V (vs. Ag/AgCl), scan rate was 800 V/s, and the sampling interval was 100 ms. The experimental design for each slice involved sampling [DA]o, evoked by a single pulse or by a brief pulse train of 20 pulses at 10 Hz in 8 recording sites (4 sites for each stimulation parameter), within the dorsolateral CPu and 8 recording sites in the NAc core. Given that 2 slices were examined per mouse, this gave a total n number of 8 recordings for each stimulation parameter per region in each mouse. A frequency response curve (5 pulses, 5, 10, 25, 50 and 100 Hz) was also collected for each region in each slice19.
Identification of released dopamine was based on voltammograms with single oxidation and reduction peak potentials that define the voltammetric signature of dopamine18.
Evoked [DA]o was quantified by postexperimental calibration of carbon-fiber electrodes with known concentrations of dopamine at 32°C18. To quantify changes in dopamine uptake by the DAT, we fitted the initial segment of the falling phase of single-pulse evoked [DA]o curves to the Michaelis-Menten equation to extract Vmax (the maximal rate constant for uptake which is proportional to the number of functional DATs) values (for details see20,21. The value of Km (which is inversely related to the affinity of the DAT for dopamine) was fixed at 0.9 μM20,21 and assumed not to be altered in the transgenic lines. The use of single pulses for this analysis allows evoked [DA]o to be assessed in the absence of autoreceptor regulation by endogenous dopamine and avoids modulation by concurrently released glutamate or GABA18,22.
In vitro electrophysiology
Acute slice preparation
Mice of postnatal day 17–22 were anesthetized and decapitated, and their brains quickly removed and placed into ice-cold high-sucrose artificial CSF (ACSF) (composition in mM: 85 NaCl, 25 NaHCO3, 2.5 KCl, 1.25 NaH2PO4, 0.5 CaCl2, 7 MgCl2, 10 glucose, 75 sucrose) saturated with 95% O2, 5% CO2, at pH ~7.3. Using a vibratome (VT 1000S; Leica Microsystems or Vibratome), coronal sections (250–300 μm) were cut containing the somatosensory barrel field cortex. The slices were allowed to recover in recording ACSF (same as above but 130 NaCl, 2 CaCl2, 2 MgCl2, 0 sucrose) at room temperature for at least 45 min before recording. Acute slices were then placed in a recording chamber mounted on the stage of an upright microscope (Axioscope; Zeiss) equipped with immersion differential interference contrast objectives (5×, 40×) coupled to an infrared camera system (Zeiss), superfused at a rate of 1–2 ml/min with oxygenated recording ACSF, and maintained at a temperature of 31 ± 1°C.
Electrophysiological recordings and data analysis
Experiments were performed in current-clamp mode using the Axoclamp 2B (Molecular Devices) or the Axopatch 200B amplifier and in voltage clamp using the latter.
When recording in current-clamp mode for assessing the active and passive membrane properties, cells were patched with electrodes containing the following (in mM): 126 K-gluconate, 10 HEPES, 10 Na2-phosphocreatine, 4 KCl, 4 Mg-ATP, 0.3 Na-GTP, pH 7.3, with KOH; the osmolarity was ~280 mOsmol. A series of sub- and supra-threshold current steps were applied and the analysis was done in Clampfit. The resting membrane potential (Vrest) was ascertained in current clamp right after rupturing the patch by applying zero current.
Spontaneous synaptic currents were recorded using a pipette filled with 40mM KCl and 90mM K-gluconate with the rest being the same as for current clamp recordings (see above). The rationale for using such a concentration of KCl was to try to differentially amplify the proximally occurring spontaneous IPSCs (sIPSCs) such as the ones coming from PV basket cells compared to all other IPSCs. The currents were filtered online at 3 kHz and recorded with a sampling rate of 10 kHz for at least 120 seconds. The series resistance was compensated online by 50%. No correction was made for the junction potential between the pipette and the ACSF. Individually acquired sIPSCs were recorded at Vh = −65 mV after application of kynurenic acid (3 mM) or a combination of CNQX (20 μM) and D-AP5 (20 μM). The recorded files were analysed using Minianalysis software (Synaptosoft, Decatur, GA, USA). The synaptic values were obtained for the average trace after visual inspection of individual events. The decay time was calculated by fitting the average trace with a single exponential. For generating the cumulative distribution plots and performing the K-S statistics all the individual events were taken for all the cells recorded in each group and were compared against each other.
For paired-cell recordings the recording pipettes were filled with the following (in mM): 88 KCl, 42 K-gluconate, 10 HEPES, 10 Na2-phosphocreatine, 4 Mg-ATP, 0.3 Na-GTP, pH 7.3 with KOH, to increase the driving force for Cl− ions (ECl = −11 mV) to the extent that the IPSC polarity was inward at the holding potential (Vh) of −80 mV. Biocytin was added to the intracellular solutions before recording at a final concentration of 0.1–0.5% (w/v). Recording electrodes had resistances between 4 and 6 MΩ. Access resistance was always monitored to ensure the stability of recording conditions. Cells were only accepted for analysis if the initial series resistance was ≤20 MΩ and did not change by >20% throughout the recording period. No correction was made for the junction potential between the pipette and the ACSF, and therefore the recorded membrane potential, as calculated post hoc using a junction potential calculator, was 11 mV more depolarized than the true membrane potential for high-Cl− intracellular solution. The presynaptic cells were held at −70mV and the postsynaptic neurons were voltage clamped at the same potential, but during the occurrence of presynaptic action potentials a voltage pulse was applied that hyperpolarized the cell to −80 mV to obtain unitary IPSCs. Postsynaptic currents were filtered at 3 kHz and recorded with a sampling rate of 20 kHz. They analysis of the synaptic events was performed in Clampfit.
All values presented in the manuscript are average ± standard error of the mean (SEM) and all the statistical values are obtained doing a standard Student’s t-test or a Kolmogorov-Smirnov test, unless otherwise stated (*p ≤ 0.05, **p ≤ 0.01, ***p ≤ 0.005).
In vivo electrophysiology
Wild type, heterozygous and homozygous adult Cntnap4 mutant mice were anaesthetized with ketamine/xylazine (100 mg/kg K, 20 mg/kg X, i.p.). A maintenance injection (10 mg/kg K, 2 mg/kg X) was given every 30 min. Depth of anesthesia was verified periodically throughout the experiment by absence of the foot withdrawal reflex. Mice were placed in a sterotaxic frame and secured in place with ear bars (David Kopf Instruments). Body temperature was maintained at 37oC +/− 1oC using an electric heating blanket. An incision was made along the midline of the scalp to expose the skull and a craniotomy 1 mm in diameter was made with a dental drill over primary somatosensory cortex (approximately 1 mm posterior and 3 mm lateral to bregma). A well was made around the craniotomy with QwikSil, and the exposed brain was kept moist by application of normal saline. A small hole was made in the dura and a 32-channel silicon probe (a linear array of 32 contacts, 50 μm apart) was positioned normal to the cortical surface with the most superficial contact just above the surface of the brain. An hour after positioning the probe, a series of 1-minute recordings was made every 2–5′. Maintenance doses were discontinued for 30–60 minutes, until the LFP exhibited a reduction in the amplitude of the slow oscillation, at which point a large dose of ketamine/xylazine (150 mg/kg K, 30 mg/kg X) was given. Data acquisition and analysis was performed using custom routines written in Igor Pro (Wavemetrics). LFPs for analysis were obtained by subtracting the signal from the most superficial recording site from the signal from a site 600–700 μm deep. Field spikes were defined as negative deflections in the LFP greater than three standard deviations in amplitude.
Immunohistochemistry
Mice were trans-cardially perfused with 4% ice-cold paraformaldehyde (PFA), the brain was removed from the skull and immersed in 4% PFA for an hour. It was then washed at least 3 times/5′ each and subsequently allowed to immerse in 25% PBS sucrose solution overnight. The following day it was mounted in OCT and 12μm sections were cut using a cryostat and collected on glass slides. After blocking with 10% Donkey serum in 0.3% Triton PBS for an hour at room temperature (RT), slices were incubated with primary antibodies at 4°C overnight. The following day the slices were washed at least three times for 10′ each in PBS and then incubated with the secondary antibody for 1 hour at RT. The slices were then washed a few times and mounted in Fluoromount-G for visualization under an epifluorescent microscope (Zeiss AxiosKOp using Spot Advanced software) or under a confocal microscope (Zeiss LSM 510 Meta system)
The molecular expression profiles and layering of Cntnap4-positive interneurons was analyzed on somatosensory barrel cortex slices at postnatal day 21 (P21), P30 and P60 brains from Cntnap4 wild type, Cntnap4 heterozygous and knock-out littermate mice, which counterstained with DAPI.
The following antibodies were used at specific concentrations: rabbit anti-GFP (1:2000; Invitrogen), rat anti-GFP (1:2000; Nacalai Tesque), goat anti-GFP (1:2000; Rockland), mouse anti-parvalbumin (1:1000; Sigma), guinea pig anti-parvalbumin (1:1000; a gift from Dr. D.A. Lewis, University of Pittsburgh) rat anti-somatostatin (1:500; Millipore Bioscience Research Reagents), rat anti-somatostatin (1:250; Chemicon), rabbit anti-Neuropeptide Y (1:500; ImmunoStar), rabbit anti-vasoactive intestinal polypeptide (1:500; ImmunoStar), mouse anti-calretinin (CR) (1:1500; Millipore Bioscience Research Reagents), rabbit anti-calretinin (1:1500; Millipore Bioscience Research Reagents), mouse anti-Reelin (CR50) (1:500; MBL). Secondary antibodies conjugated with Alexa Fluoro dyes 488, 594 or 643 (Invitrogen) or AMCA (Jackson Immunoresearch) raised from the same host used for blocking serum were chosen for signal visualization. Fluorescent images were captured using a cooled-CCD camera (Princeton Scientific Instruments) using MetaMorph software (Universal Imaging).
Double in situ hybridization
Sections were dried for 1 h before 10 min fixation in 4% PFA. After wash, endogenous peroxidase activity was quenched by 1.5% H2O2 in methanol for 15 min at room temperature. Sections were then treated in 0.2 M HCl for 8 min before a proteinase K treatment (10 μg/ml; Roche) for 3 min and a postfixation in 4% PFA for 10 min at 4°C with washing steps in between. Before hybridization, the tissue was acetylated in TEA (tetraethylammonium) (0.185 g/ml; Sigma-Aldrich), 0.5N NaOH, and 0.25% acetic anhydride (Sigma-Aldrich). The digoxigenin (DIG)- and FITC-labeled probes (full-length cDNA probes of Gad67, Cntnap414) were mixed 2 μl per slide in 250 μl of hybridization buffer (50% formamide, 10% dextrane sulfate, 0.25 mg/ml yeast RNA, 0.3 M NaCl, 20 mM Tris, 5 mM EDTA, 10 mM NaPO4, and 1% n-lauroylsarcosine in Denhardt’s solution) and denatured at 80°C for 2 min. Hybridization was made overnight at 55°C. After hybridization, the sections was rinsed in a 2× SSC with 50% formamide solution for 30 min at 65°C before several washes in RNase buffer (0.5 M NaCl, 10 mM Tris, pH 7.5, and 5 mM EDTA, pH 8.0). The tissue was treated with RNase (20 μg/ml; Roche) in RNase buffer for 30 min at 37°C before rinsing in decreasing amounts of SSC (2×, 0.2×, and 0.1×) for 15 min at 37°C each. After equilibrating in TN buffer (0.1 M Tris, pH 7.5, and 0.15 M NaCl), the sections were blocked in 0.5% blocking reagent (Roche) in TN buffer for 30 min at room temperature. The sections were then incubated with primary antibody against FITC or DIG overnight at 4°C. On the third day, sections were rinsed in TNT buffer (TN buffer with 0.05% Tween 20) before amplification and visualization step using the TSA Plus Cyanine 3/Fluorescein System (PerkinElmer) according to the manufacturer’s instruction (10–60 min incubation). After washes in TNT, the peroxidase was quenched in 3% H2O2 in TN for 2 h at room temperature before incubation with the other primary antibody for 1 h at room temperature followed by visualization using the same kit as above. After washes in TNT, sections were incubated in DAPI before mounting in Fluoromount-G. Images were obtained under a confocal microscope (Zeiss LSM 510 Meta system).
Hippocampal cultures
Cultures were prepared from embryonic day 19 Sprague Dawley rat embryonic brain tissue. Animals were killed by CO2 in compliance with New York University Medical Center’s Institutional Animal Care and Use Committee. Hippocampal neurons were prepared as described previously23. Neurons were plated at a density of 100,000 cells on poly-L-lysine-coated glass coverslips in a six-well plate for immunofluorescence. Neurons were grown in Neurobasal medium with B27 (Invitrogen). At the first change of medium, a one-time dose of the drug AraC (4 μM; Sigma-Aldrich) was added to inhibit growth of dividing cells for immunofluorescence experiments24. All immunocytochemical reactions were performed on five week old cultures.
To identify localization of Cntnap4 binding a tagged-Cntnap Fc protein was applied in the cultures as described previously25. Briefly, live cells are washed with binding buffer, incubated with 100nM control human Fc or Cntnap4-Fc for 90 minutes at RT, rinsed five times and then fixed with 4% PFA in PBS. After rinsing with Hepes buffer, endogenous alkaline phosphatase (AP) activity was inactivated by heating at 65°C for 30 minutes. An AP-conjugated antibody was applied to visualize signal. For experiments in which cells were double-labeled with gephyrin, cells were permeablized after fixation, AP heat inactivation was not performed. Mouse anti-gephyrin (1:250; Synaptic Systems) was then applied applied and anti-human Alexa 488-conjugated secondary and anti-mouse Alexa 594 were used to visualize signal.
Transmission Electron Microscopy
The mice were anesthetized and were perfused transcardially with saline followed by fixative containing 4% paraformaldehyde (PFA) and 2.5% Glutaraldehyde in 0.1M phosphate buffer (PB, pH 7.4). Brains were sliced using a brain slicer so as to obtain only parts of the somatosensory barrel field cortex. The cut pieces were then post-fixed with the same fixative at room temperature for 2 hours and then at 4°C overnight. After washing with PB 3×15min, the samples were fixed in 1% OsO4 for 2 hours, block stained with 1% uranyl acetate for 1 hour, dehydrated in ethanol and embedded in EMbed 812 (Electron Microscopy Sciences, Hatfield, PA). 60nm ultrathin sections were cut and stained with uranyl acetate and lead citrate by standard methods. Stained grids were examined under a Philips CM-12 electron microscope (FEI; Eindhoven, The Netherlands) and photographed with a Gatan (4k x2.7k) digital camera (Gatan, Inc., Pleasanton, CA). For analyzing perisomatic inhibitory synapses we first identified pyramidal cells based on their characteristic body shape from which an apical dendrite emanated towards the pia. The soma was surveyed under high magnification and symmetric synapses were identified as appositions between terminals containing vesicles and most of the times mitochondria and soma membrane bearing a very narrow post-synaptic density (PSD). The synaptic cleft was measured as the gap between the presynaptic and postsynaptic membranes under digitally zoomed in images and the synaptic length as the length of the PSD. For excitatory synapses randomly selected assymetric contacts were captured against unidentified elements and the synaptic cleft and PSD length were analyzed similarly to the inhibitory synapses and as previously reported. The analysis was performed in Image J (NIH). Although it was not originally done blind by the authors, an independent individual not part of the study assessed half of the dataset blindly and verified the original findings.
Only synapses with a clear post- and pre-synaptic element were included in the analysis for synaptic length. Only synapses that had a clear synaptic cleft separating the pre- and post-synaptic elements were taken for width measurements.
Behavioral testing
The behavioral testing was done in the following order: OFA-EPM-PPI in 3–4 cohorts of mice.
Open Field Analysis (OFA)
OFA was measured in an activity test chamber (27.3 cm × 27.3 cm) in a self-enclosed sound attenuating cubicle (Med Associates, St. Albans, VT) with 16 infrared light beams per side. Mice were released into the center of the OFA for testing. The activity of the mouse over 10 or 15 minutes was determined by beam breaks and recorded by computer for subsequent analysis. The apparatus was thoroughly cleaned with 70% isopropanol before each mouse was tested. The periphery and center were arbitrarily defined (6 cm in 27.3 cm) and the dependent variables measured were distance traveled, time in the periphery vs. time in center and vertical time. Illumination levels during testing were maintained at a constant 60 lux.
Elevated Plus Maze (EPM)
The EPM consisted of four white, equally spaced arms, 39 cm in height and 33.9 cm from the center of the apparatus. Two opposing arms were each enclosed by white walls extending 15.3 cm above the surface and two arms were open. Individual mice were placed in the center of the maze to start and their activity recorded on computer for five minutes by video camera (Bosch LTC 0335). Animals were released using bottomless holding chamber at the start of the test. The animals’ movements were captured and analyzed with Ethovision XT software (Noldus, Wageningen, Netherlands). The apparatus was thoroughly cleaned with 70% isopropanol before each mouse was tested. Dependent variables were distance covered and time spent in the exposed vs. enclosed arms and center. Illumination levels during testing were maintained at a constant 195 lux.
Pre Pulse Inhibition
PPI was determined using SR Lab startle response chambers (San Diego Instruments, San Diego, CA, USA). Each mouse was placed into a Plexiglas cylinder attached to a piezoelectric sensor. The startle response to an acoustic stimulus was measured in the presence of a 65 dB white noise background that began a 5-minute acclimation period. Each session consisted of a randomized block design of 40 trials that presented a 20 ms pre-pulse of 74, 82 or 90 dB followed 100 ms later by either a 40ms 120 dB startle pulse or no pulse at all (null). The ITI averaged 15 seconds but was pseudo randomized during presentations. The apparatus was thoroughly cleaned with 70% isopropanol before each mouse was tested. The percent PPI for each pre-pulse startle stimulus was determined by dividing the startle response to a pre-pulse stimulus by the startle response for that trial, multiplying the quotient by 100 and subtracting the product from 100 (100−(pre-pulse startle response/startle response) × 100) for each trial. The mean response for each group, WT, Het and KO mice was calculated for each pre-pulse stimulus level. For the indiplon experiments, the drug was orally gavaged at a concentration of 10mg/kg 30′–1hr before performing the PPI test, since that is when the drug reaches its peak concentration in the brain26.
Animals were excluded from the analysis when non-responsive to the acoustic stimulus, presumed to have hearing deficits.
Grooming
Mice were scored on a scale from 1–4 depending on the extent of their grooming. A score of “0.5” means that the whiskers were half the length of what that of controls, whereas “1” means that they were trimmed all the way to the skin. A score of “2” indicates that the hair around whiskers are also gone, “3” that there is a more extensive and spread facial hair loss and “4” that there is additional body hair loss. For the pharmacological rescue of the overgrooming phenotype custom-made slow release pellets lasting for 90 days were used (Innovative Research of America, Sarasota, Florida) and placed subcutaneously using a 10 gauge precision trochar in WT and heterozygous mice under 5 minutes of isoflurane anesthesia.
Marble burying
Mice were placed in the middle of a cage (27×16.5×12.5cm) with 5cm high corncob bedding that had 20 black marbles of ~14mm diameter gently placed in a 4×5 arrangement as previously reported27,28. One picture was taken prior to putting the mice in the cage and another after taking the mice out of the cage. The mice were video-monitored for 10 minutes and the extent of marble burying was assessed by comparing the two pictures in terms of overall dark pixels present, by using Image J software (NIH). The analysis was done blind and white noise was present during testing.
Antibodies Used In This Study
Rabbit anti-calretinin, Millipore (MAB1568), IHC 1:150029; rabbit anti-Cntnap4, Elior Peles (Weizmann Institute), WB 1:50030; mouse anti-GABAA α1, NeuroMab (75–136, clone N95/35), WB 1:100031; rabbit anti- GABAA α2, PhosphoSolutions (830-GG2), WB 1:100032; mouse anti-gephyrin Synaptic Systems (147 021, clone mAb7a), ICC 1:25033; mouse anti-gephyrin, Synaptic Systems (147 111, clone 3B11), WB 1:100034; rat anti-GFP, Nacalai-Tesque (04404-84, clone GF090R), IHC 1:200035; goat anti-GFP, Rockland (600-101-215), IHC 1:200035; mouse anti-N-Cadherin, BD Pharmingen (561553, clone 8c11), WB 1:100036; rabbit anti-neuropeptide Y, Immunostar (22940), IHC 1:50037; mouse anti-parvalbumin, Sigma (P3088, clone PARV-19), IHC 1:100037; guinea pig anti-parvalbumin, David Lewis (Univ. Pittsburgh), IHC 1:100038; mouse anti-PSD-95, NeuroMab (75–348, clone K28/74), WB 1:100039; mouse anti-reelin, MBL (D223-3, clone R3b9), IHC 1:50040; rat anti-somatostatin, Chemicon (MAB354), IHC 1:25041; rabbit anti-tyrosine hydroxylase, Pel Freez (P040101), IHC 1:100042; rabbit anti-vasointestinal peptide, Immunostar (20077), IHC 1:50035.
Extended Data
Extended Data Figure 1. Generation of Cntnap4 knock-out (KO) mice and localization of the gene and the protein.
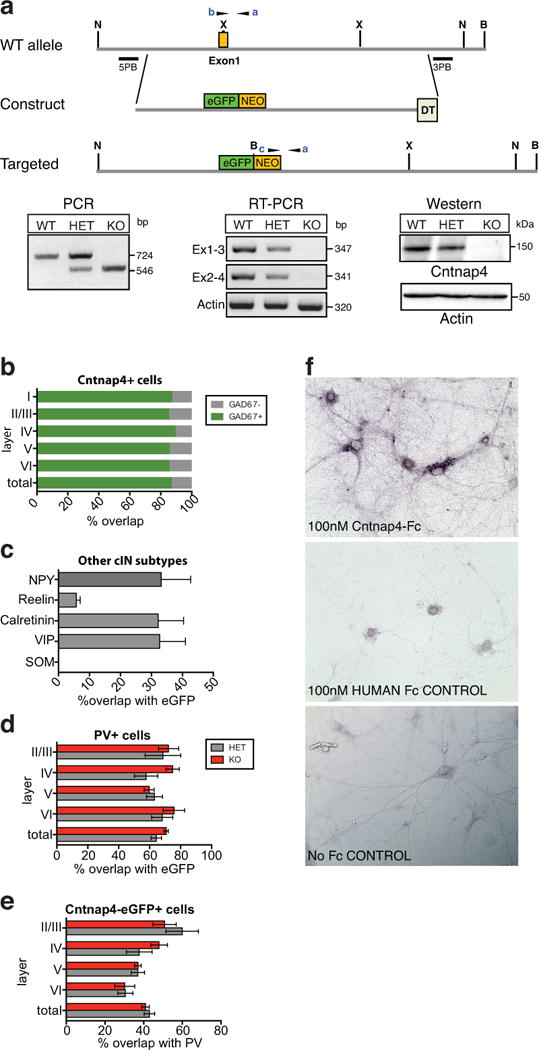
a, Schematic representation of targeting strategy to generate mutant eGFP-knockin knockout Cntnap4 allele. Primers used for genotyping (a-c) are indicated. X, XhoI, H, NheI, B, BahmHI sites. PCR, RT-PCR and western blot show correct gene targeting, disrupted transcription and translation of Cntnap4, respectively. b, Distribution of Cntnap4-positive cells that are also GAD67 positive by layer in a double fluorescent in situ hybridization analysis (n=2 brains). c, Percentage of overlap between interneuron markers (NPY, reelin, calretinin and VIP) and Cntnap4-eGFP. d, e, Percentage of overlap between PV and Cntnap4-eGFP across all layers (b-d: bars represent the mean, error bars SEM; n=4 brains). f, Cntnap4-Fc in vitro labeling and controls. Colorimetric detection of a human Fc-tagged Cntnap4 extracellular domain on live dissociated hippocampal neuronal cultures (top image). No specific binding or signal upon application of human-Fc negative control (middle panel) or with no human Fc present (bottom panel) (n=4 cultures, 2 replicates each)
Extended Data Figure 2. Pre-synaptic measures for dopaminergic and GABAergic transmission.
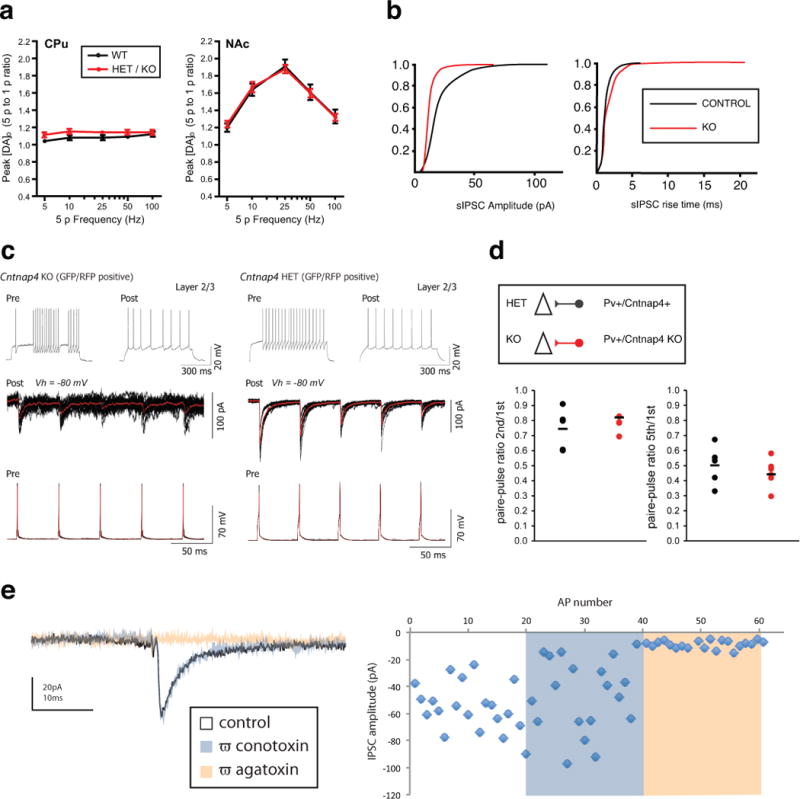
a, Voltammetric monitoring of extracellular [DA]o in the CPu and NAc of striatal slices. Frequency dependence (5 p-to-1 p ratio) of evoked [DA]o in WT and mutant Cntnap4 mice (HET/KO), was not different across frequencies (5, 10, 15, 50, 100Hz; n=4 per genotype; 2-way ANOVA, posthoc Bonferroni test) b, Cumulative distributions of spontaneous inhibitory postsynaptic current (sIPSC) amplitude and rise time recorded from P17-P21 control (n=8 cells) and Cntnap4 KO (n=7 cells) layer 2-3 pyramidal cells in vitro. Kolmogorov-Smirnov test used for statistical analysis. c, Series of evoked synaptic IPSCs recorded in RS pyramidal cells at 20Hz (below) in HET (right) versus KO Cntnap4 mice (left). Average trace in red with black individual traces (10 sweeps). d, Plots showing the paired pulse ratios calculated for the 1st and 2nd and the 1st and 5th responses in the synaptic train (HET: n=4 brains, n=8 cells; KO n=4 brains, n=11 cells; unpaired t-test used to compare groups statistically) e, Loss of Cntnap4 does not alter pre-synaptic calcium channel type dependence for synaptic release. IPSCs completely blocked by the P/Q-type blocker ω−agatoxin (100μM), not altered by the N-type blocker w−conotoxin (200μM) (n=3 brains, n=3 cells).
Extended Data Figure 3. FS to pyramidal cell synaptic transmission deficits persist into adulthood in Cntnap4 KO mice by in vitro slice physiology and mild epileptiform-like discharges observed in vivo under anaesthesia.
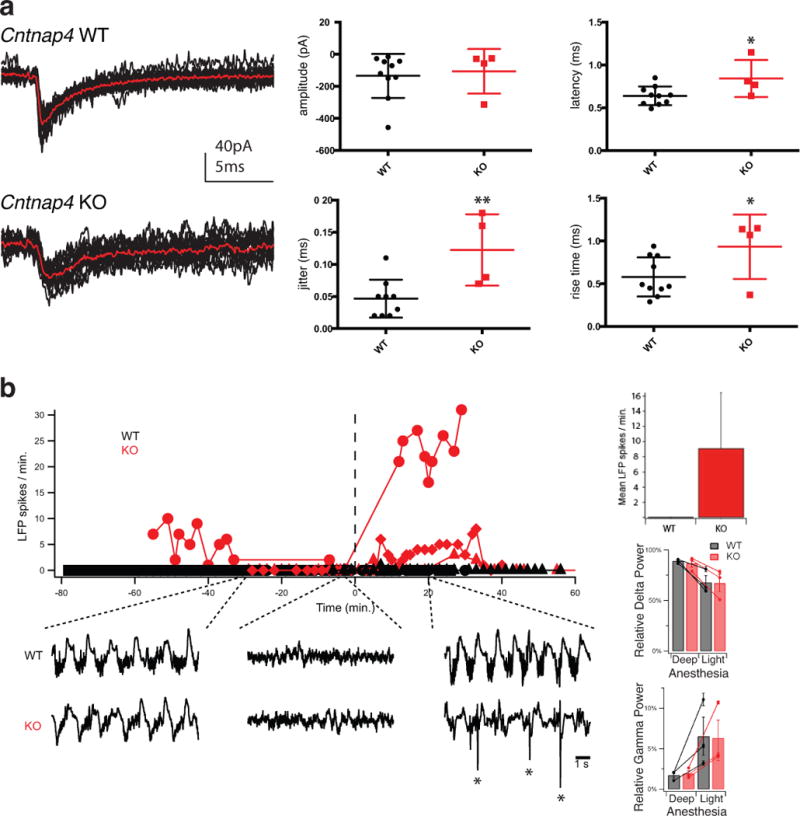
a, Examples of FS evoked IPSCs from adult Cntnap4 WT and KO mice (P60-P90), showing that the latter remain immature (unpaired t-test, * p<0.05, ** p<0.01, ***p<0.005. WT: n=2 brains, n=10 pairs; KO n=1 brain; n=4 pairs). b, Graph depicting the number of LFP spikes per minute over the time course of the in vivo recordings of 3 wild type (WT-black circle, triangle and diamond) and 3 knock out (KO-red circle, triangle and diamond) adult mice. Time “0” is the time a large injection of ketamine/xylazine was given, bringing the animal back into deep anaesthesia. Example traces from LFP signals of a WT and a KO mouse taken sequentially under deep, light and deep anaesthesia are shown underneath (asterisks mark spikes). Bar graph of the average number of LFP spikes/min shows absence of spikes in WT animals. Calculated relative power (relative power = band power/total power) for Delta (0.5–4 Hz) and Gamma (20–80 Hz) frequency bands are shown underneath for light and deep anaesthesia. No statistically significant effect of genotype on the relative power in either frequency band was detected (3-way ANOVA performed with animal ID as factor within genotype on Gamma and Delta power.)
Extended Data Figure 4. Intrinsic electrophysiological properties, morphology and localization of postsynaptic GABAA receptors in Cntnap4 WT and KO mice.
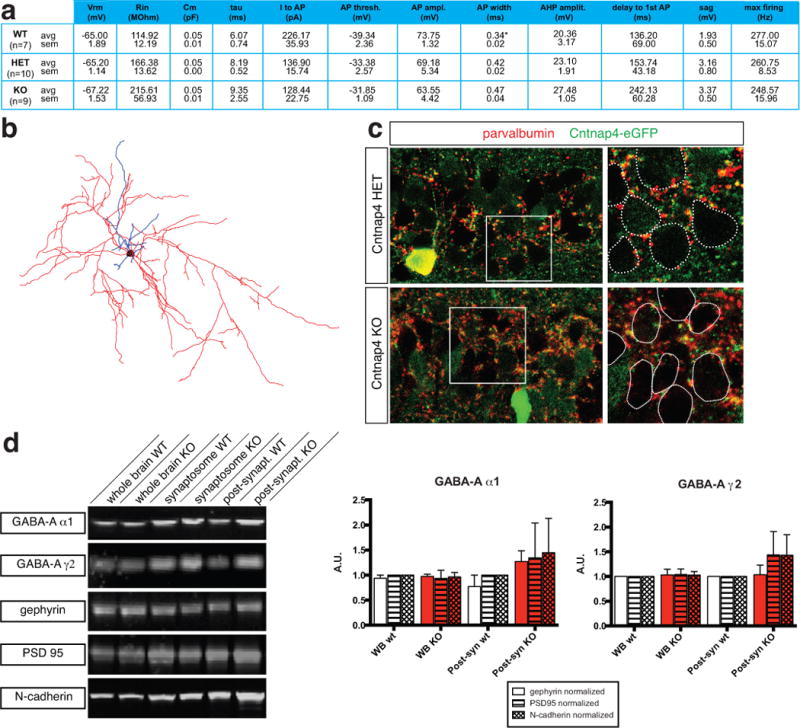
a, No differences were detected in the passive or active membrane properties of fast spiking (FS) basket cells in the Cntnap4 HET versus Cntnap4 KO mice. (WT: n=2 brains, n=7 cells; HET: n=6 brains, n= 10 cells; KO: n=4 brains, n=9 cells; ANOVA with post hoc Tukey’s test used to compare groups statistically). b, Reconstruction of a layer 5 Cntnap4 KO FS cell. Soma in black, dendrites in blue and axon in red. c, Images of hippocampal CA1 pyramidal cell layer from Cntnap4 HET and KO mice, showing normal perisomatic labeling of parvalbumin-positive terminals. The images were also stained for eGFP (Cntnap4) staining. The closed dotted lines show the position of cell somata. d, Representative blots of GABA-A α1, GABA-A γ2, gephyrin, PSD 95 and N-cadherin of various brain fractions. Bar graphs showing GABA-A α1 levels quantified and normalized to gephyrin, PSD 95 and N-cadherin loading controls. Also shown are GABA-A γ2 levels quantified and normalized to gephyrin, PSD 95 and N-cadherin loading controls. (n=3 biological replicates)
Extended Data Figure 5. Ultrastructural analysis of excitatory synapses between WT and KO animals.
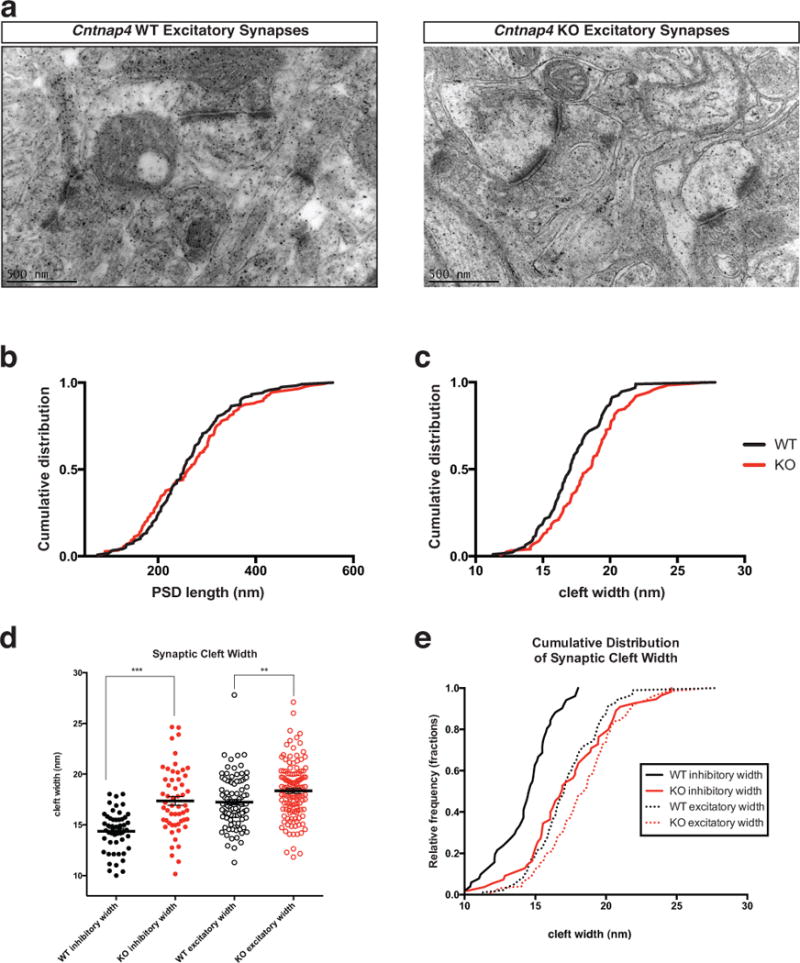
a, Representative electron micrographs of Cntnap4 WT and KO excitatory synapses at 57 000x magnification. b, Post synaptic density length and c, Cleft width of excitatory synapses in the SSBF1 of Cntnap4 WT and KO mice. A statistically significant difference in cleft was observed in Cntnap4 KO compared to the WT mice (p=0.0089). PSD length of excitatory synapses however, was unchanged between KO and WT. d, Dot plot comparison of inhibitory versus excitatory synapses across WT and KO. The relative effect of Cntnap4 loss is much more pronounced in inhbitory synapses. e, This effect is also readily apparent when the datasets are represented by culmulative distribution. (d, e, **p<0.01; *** p< 0.001, Kolmogorov-Smirnov test for width). (B-E: n=2 brains for each genotype; width: WT n=93 synapses; KO n=124 synapses; length: WT n=119 synapses; KO n=143 synapses)
Extended Data Figure 6. Human genetics data implicating CNTNAP4 in neuropsychiatric disorders.
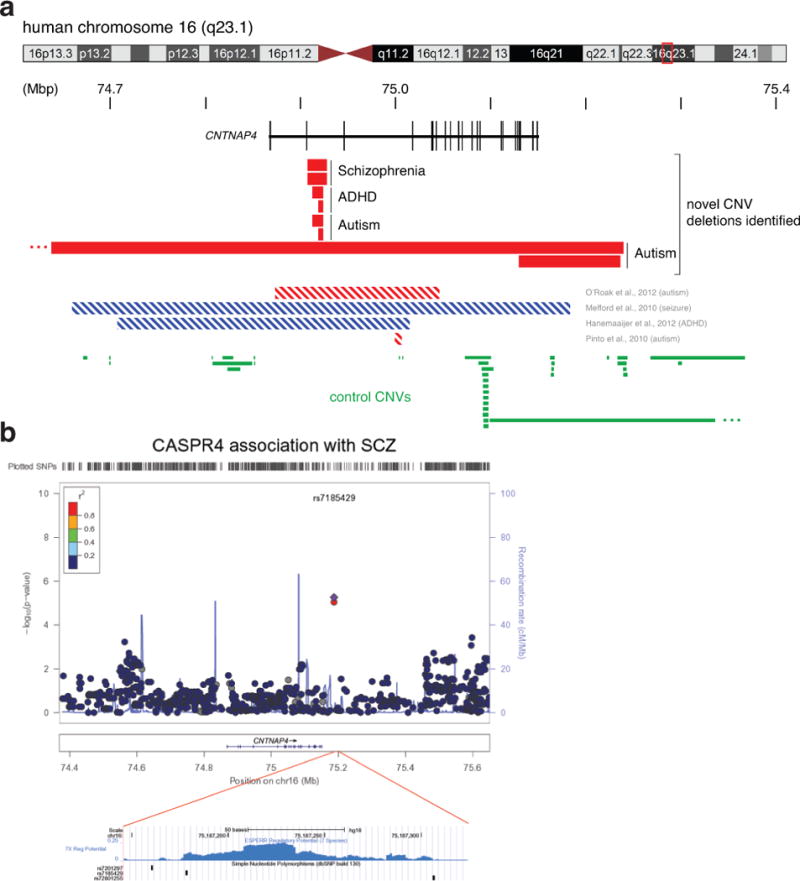
a, Novel and published CNVs present in the CNTNAP4 locus on human chromosome 16. We identified eight new cases of human individuals with neuropsychiatric disorders (2 with schizophrenia, 4 with ASD and 2 with ADHD). Six of these individuals had CNVs in the second intron of the gene (top), whereas two had larger exonic deletions in CNTNAP4 (bottom). Previously reported cases of deletions (red striped) or duplications (blue striped) within the gene are presented underneath. Green bars depict CNVs in the CNTNAP4 gene and proximal regions on either side of it found in control non-afflicted individuals. b, Two CASPR4 (CNTNAP4) SNPs (single nucleotide polymorphisms) associating with schizophrenia (SCZ) were found to have gene-wide significant association (rs7185429 and rs7201297). The region containing the two SNPs is shown below in light blue (Schizophrenia-GWAS-SNP). The plot depicts the association P-values of SNPs within CNTNAP4 in SCZ families (top). Both SNPs reside in a region predicted to be regulatory by the ESPERR Regulatory Potential program (www.genome.ucsc.edu). ESPERR regulatory potential based on 7 species (bottom). See Supplementary Results and Supplementary Table 1 for more detail.
Extended Data Figure 7. Identification of a heterozygous deletion of CNTNAP4.
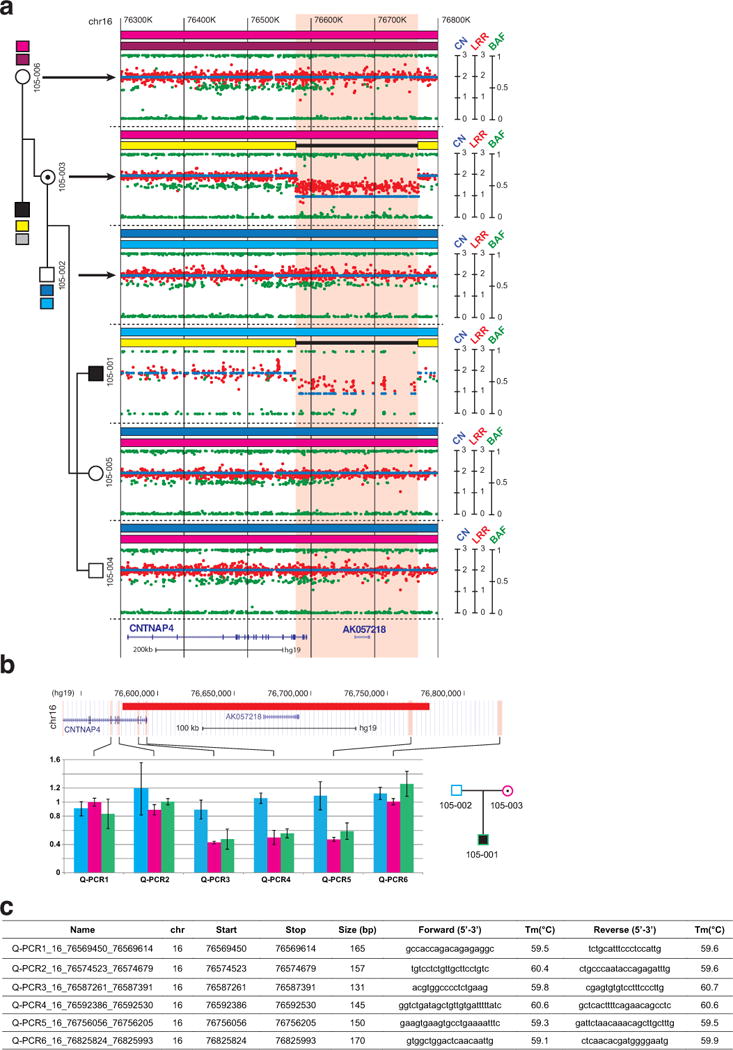
a, All family members, except the father with Asperger syndrome, were genotyped using the Illumina Human Omni 1 SNP array. The patient with Asperger syndrome (105-001) and his mother were carrying a 191 kb deletion on chromosome 16q13.3 including the 3 last exons of CNTNAP4 and the AK057218 gene. Based on informative SNPs located within the deletion, we ascertained that the deletion was on the grand father’s chromosome. This grand father was diagnosed with Asperger syndrome, but DNA was not available to ascertain if he was carrying the deletion or if the deletion appeared de novo in his daughter (105-003). Each dot shows Log R Ratio (LRR; in red), the B allele frequency (BAF; in green) and the copy number (CN; in blue). b, The CNTNAP4 deletion was validated by quantitative PCR. Results obtained on the genomic DNA from the proband (105-001), his parents, and two controls confirmed that the deletion was inherited from the mother and removed the 3 last exons of CNTNAP4. Bars represent mean of RQ ± SEM. c, Primers used for the CNTNAP4 CNV validation by quantitative PCR.
Extended Data Figure 8. Identification and validation of CNTNAP4 intronic and exonic deletions in individuals with neuropsychiatric disorders.
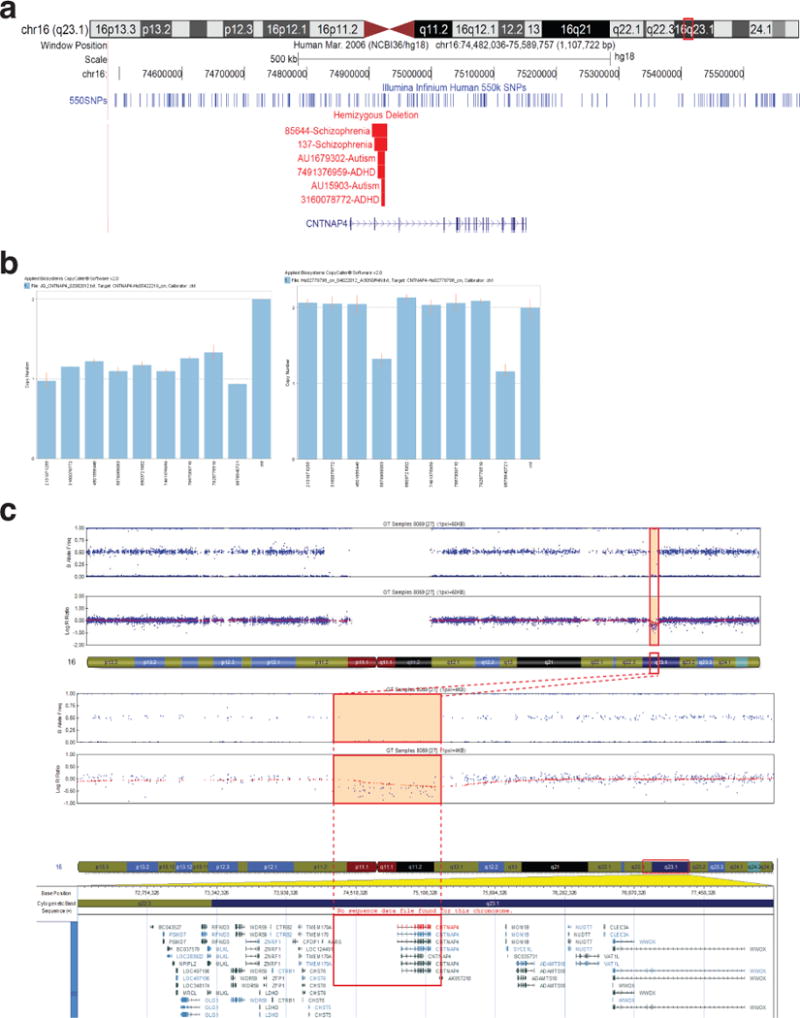
a, CNTNAP4 chromosome 16 (chr16): 74,482,036-75,589,757 with Illumina Infinium Human 550K SNPs coverage displayed as dark blue lines across the top. CNVs are shown in red for hemizygous deletions. All intron II deletions in CNTNAP4 in the six cases are listed first, followed by two larger duplications and two deletions affecting CNTNAP4 previously reported in the literature. b, All CNV calls in cases shown in “a” were positively validated by TaqMan® Copy Number Assay. c, An heterozygous CNTNAP4 deletion was identified with the cytoSNP array from Illumina in family II. An individual diagnosed with autism and mild intellectual disability possesses a heterozygous deletion, inherited from the mother, which spans 916.2 kb on chromosome 16q23.1 (hg19, 75,766,089-76,682,263), and includes all exons of CNTNAP4 (delineated by the orange square). The upper plot shows B allele frequency (in blue) and the lower plot shows Log R Ratio (in red).
Extended Data Figure 9. Behavioral tests in Cntnap4 mice.
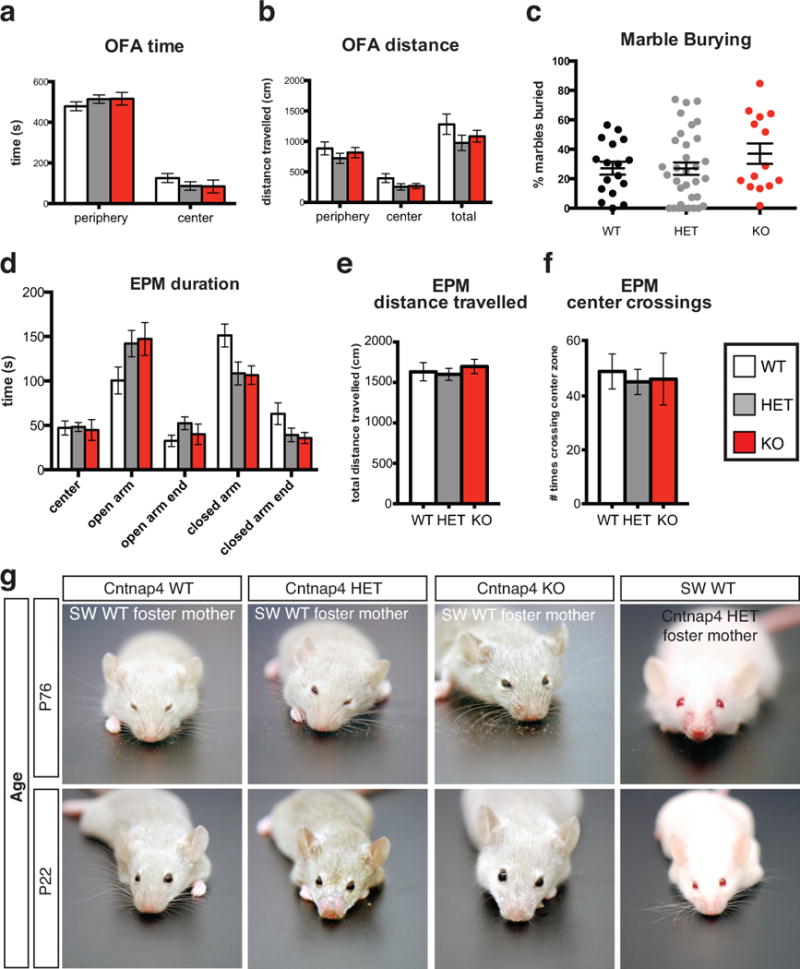
a,b No major changes in anxiety levels were observed in the mutant mice as indicated by time and distance spent in periphery versus center in Open Field Arena (OFA) (n = 14 WT, n = 13 HET, n = 10 KO). c, No major changes observed in extent of marble burying in the mutant versus control mice (n = 17 WT, n = 33 HET, n = 14 KO). d–f, No difference was found in the time spent in the open or closed arms, total distance traveled or center crossings in the Elevated Plus Maze (EPM) between mutants and control animals (n = 14 WT, n = 12 HET, n = 11 KO). g, Grooming tracks with the Cntnap4 mutant allele. A series of representative images of Cntnap4 mutant mice (Het and KO) cross-fostered by Swiss Webster wild type (SW WT) dam or SW WT mice cross-fostered onto Cntnap4 mutant dam. Grooming status documented at two different ages: just after weaning (P22) and at P76. At P22, presence or absence of allo-grooming by the mother is apparent, whereas at P76 the presence or lack of whiskers depends on the mouse’s genotype. See Supplementary Results for more detail.
Extended Data Figure 10. Drug effects on spontaneous IPSCs, as well as PPI and locomotion.
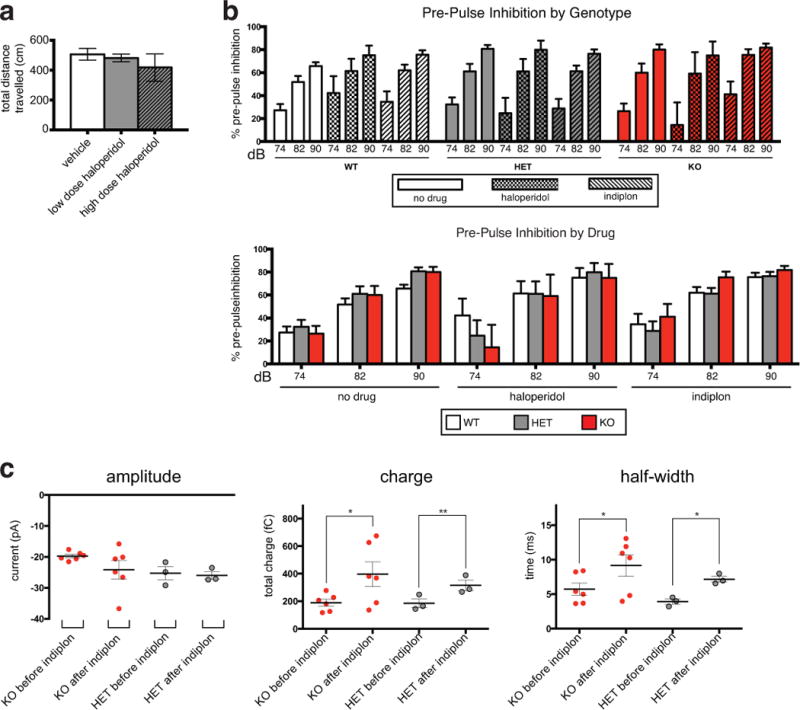
a, Haloperidol administration does not lead to a significant reduction in locomotion in Cntnap4 HET mice as measured by the total distance travelled in an open field arena (OFA) (vehicle n=6 mice; low haloperidol n=6 mice; high haloperidol n=3 mice; ANOVA used for statistical analysis). b, Percentage of Pre-pulse Inhibition (PPI) for each genotype in control and under haloperidol and indiplon administration for a series of pre-pulses (74,82,90 dB). Below, same data re-organized by drugs regimen in each genotype group. c, Effect of indiplon on amplitude, charge and half-width of proximal and perisomatic spontaneous IPSCs recorded from layer 2–3 P23–25 pyramidal cells of KO (n=3 brains, n=6 cells) and HET (n= 1 brain, n=3) mice in vitro, unpaired t-test (*p<0.05; **p<0.01; ***p<0.001).
Supplementary Material
Acknowledgments
The authors are grateful to Robert Froemke for critically reading the manuscript, to Brett Benedetti, Melissa McKenzie-Chang, Lucy Cobbs, Bradley A. Heller, Tim Petros, and Norihiro Yumoto (all NYU) for help with experiments and analysis and to Charles Nicholson (NYU) for providing specialized software to analyze Vmax. Research in the Fishell lab is supported by the NIH (grants R01 NS081297, R01 MH071679, R01 NS074972, P01 NS074972 to B.R and G.F) and the Simons Foundation (94534). The Rice lab is supported by the NIH (grants R01 NS036362 and R01 DA033811) and the Attilio and Olympia Ricciardi Research Fund. The Rudy lab is supported by the NIH (NS30989). The Peles lab is supported by the NIH (grant NS50220) and the Israel Science Foundation. T.K support was provided through post-doctoral fellowships from the Patterson Trust and ROCHE. E.A support was provided by New York State through its NYSTEM initiative (C024326) and fellowship from Canadian Institutes of Health Research. J.C.P support was provided by NYU COE Addiction Seed Grant.
Footnotes
Author contributions
T.K, E.A and G.F designed the study and wrote the manuscript. T.K and E.A performed all the experiments and analysis except for the following: J.C.P performed the in vitro voltammetry experiments and analyzed the data. I.K performed some of the in vitro electrophysiology recordings. M.K, L.R-M and S.M provided the SNP data. J.G and H.H provided the intronic CNV data. D.H, B.K, G.H and T.B provided the exonic CNV data. S.R performed the synaptosome preparation and western blots. D. S and E.P made the Cntnap4 mouse. A.G performed the verification of the Cntnap4 mouse. N.R performed the in vivo electrophysiological experiments. C.H set up and advised on behavioral experiments. J.A.G, R.T, B.R, M.R. advised on experiments and manuscript preparation.
References
- 1.Penagarikano O, et al. Absence of CNTNAP2 leads to epilepsy, neuronal migration abnormalities, and core autism-related deficits. Cell. 2011;147:235–246. doi: 10.1016/j.cell.2011.08.040. [DOI] [PMC free article] [PubMed] [Google Scholar]
- 2.Etherton MR, Blaiss CA, Powell CM, Sudhof TC. Mouse neurexin-1alpha deletion causes correlated electrophysiological and behavioral changes consistent with cognitive impairments. Proc Natl Acad Sci U S A. 2009;106:17998–18003. doi: 10.1073/pnas.0910297106. [DOI] [PMC free article] [PubMed] [Google Scholar]
- 3.Fazzari P, et al. Control of cortical GABA circuitry development by Nrg1 and ErbB4 signalling. Nature. 2010;464:1376–1380. doi: 10.1038/nature08928. [DOI] [PubMed] [Google Scholar]
- 4.Berghuis P, et al. Brain-derived neurotrophic factor controls functional differentiation and microcircuit formation of selectively isolated fast-spiking GABAergic interneurons. Eur J Neurosci. 2004;20:1290–1306. doi: 10.1111/j.1460-9568.2004.03561.x. [DOI] [PubMed] [Google Scholar]
- 5.Lewis DA. Cortical circuit dysfunction and cognitive deficits in schizophrenia – implications for preemptive interventions. Eur J Neurosci. 2012;35:1871–1878. doi: 10.1111/j.1460-9568.2012.08156.x. [DOI] [PMC free article] [PubMed] [Google Scholar]
- 6.Blatt GJ, Fatemi SH. Alterations in GABAergic biomarkers in the autism brain: research findings and clinical implications. Anatomical record. 2011;294:1646–1652. doi: 10.1002/ar.21252. [DOI] [PMC free article] [PubMed] [Google Scholar]
- 7.Ashrafi S, et al. Neuronal Ig/Caspr recognition promotes the formation of axoaxonic synapses in mouse spinal cord. Neuron. 2014;81:120–129. doi: 10.1016/j.neuron.2013.10.060. [DOI] [PMC free article] [PubMed] [Google Scholar]
- 8.Spiegel I, Salomon D, Erne B, Schaeren-Wiemers N, Peles E. Caspr3 and caspr4, two novel members of the caspr family are expressed in the nervous system and interact with PDZ domains. Mol Cell Neurosci. 2002;20:283–297. doi: 10.1006/mcne.2002.1110. [DOI] [PubMed] [Google Scholar]
- 9.Ho A, Morishita W, Hammer RE, Malenka RC, Sudhof TC. A role for Mints in transmitter release: Mint 1 knockout mice exhibit impaired GABAergic synaptic transmission. Proc Natl Acad Sci U S A. 2003;100:1409–1414. doi: 10.1073/pnas.252774899. [DOI] [PMC free article] [PubMed] [Google Scholar]
- 10.Atasoy D, et al. Deletion of CASK in mice is lethal and impairs synaptic function. Proc Natl Acad Sci U S A. 2007;104:2525–2530. doi: 10.1073/pnas.0611003104. [DOI] [PMC free article] [PubMed] [Google Scholar]
- 11.Patel JC, Rice ME. Monitoring axonal and somatodendritic dopamine release using fast-scan cyclic voltammetry in brain slices. Methods Mol Biol. 2013;964:243–273. doi: 10.1007/978-1-62703-251-3_15. [DOI] [PubMed] [Google Scholar]
- 12.Li X, et al. Enhanced striatal dopamine transmission and motor performance with LRRK2 overexpression in mice is eliminated by familial Parkinson’s disease mutation G2019S. J Neurosci. 2010;30:1788–1797. doi: 10.1523/JNEUROSCI.5604-09.2010. [DOI] [PMC free article] [PubMed] [Google Scholar]
- 13.Doischer D, et al. Postnatal differentiation of basket cells from slow to fast signaling devices. J Neurosci. 2008;28:12956–12968. doi: 10.1523/JNEUROSCI.2890-08.2008. [DOI] [PMC free article] [PubMed] [Google Scholar]
- 14.Hefft S, Jonas P. Asynchronous GABA release generates long-lasting inhibition at a hippocampal interneuron-principal neuron synapse. Nat Neurosci. 2005;8:1319–1328. doi: 10.1038/nn1542. [DOI] [PubMed] [Google Scholar]
- 15.Labasque M, Faivre-Sarrailh C. GPI-anchored proteins at the node of Ranvier. FEBS Lett. 2010;584:1787–1792. doi: 10.1016/j.febslet.2009.08.025. [DOI] [PubMed] [Google Scholar]
- 16.Krueger DD, Tuffy LP, Papadopoulos T, Brose N. The role of neurexins and neuroligins in the formation, maturation, and function of vertebrate synapses. Curr Opin Neurobiol. 2012;22:412–422. doi: 10.1016/j.conb.2012.02.012. [DOI] [PubMed] [Google Scholar]
- 17.Chang MC, et al. Narp regulates homeostatic scaling of excitatory synapses on parvalbumin-expressing interneurons. Nat Neurosci. 2010;13:1090–1097. doi: 10.1038/nn.2621. [DOI] [PMC free article] [PubMed] [Google Scholar]
- 18.Sylwestrak EL, Ghosh A. Elfn1 regulates target-specific release probability at CA1-interneuron synapses. Science. 2012;338:536–540. doi: 10.1126/science.1222482. [DOI] [PMC free article] [PubMed] [Google Scholar]
- 19.Cathala L, Holderith NB, Nusser Z, DiGregorio DA, Cull-Candy SG. Changes in synaptic structure underlie the developmental speeding of AMPA receptor-mediated EPSCs. Nat Neurosci. 2005;8:1310–1318. doi: 10.1038/nn1534. [DOI] [PubMed] [Google Scholar]
- 20.Peca J, et al. Shank3 mutant mice display autistic-like behaviours and striatal dysfunction. Nature. 2011;472:437–442. doi: 10.1038/nature09965. [DOI] [PMC free article] [PubMed] [Google Scholar]
- 21.Chao HT, et al. Dysfunction in GABA signalling mediates autism-like stereotypies and Rett syndrome phenotypes. Nature. 2010;468:263–269. doi: 10.1038/nature09582. [DOI] [PMC free article] [PubMed] [Google Scholar]
- 22.Geyer MA, Krebs-Thomson K, Braff DL, Swerdlow NR. Pharmacological studies of prepulse inhibition models of sensorimotor gating deficits in schizophrenia: a decade in review. Psychopharmacology (Berl) 2001;156:117–154. doi: 10.1007/s002130100811. [DOI] [PubMed] [Google Scholar]
- 23.Stark KL, Burt RA, Gogos JA, Karayiorgou M. Analysis of prepulse inhibition in mouse lines overexpressing 22q11.2 orthologues. Int J Neuropsychopharmacol. 2009;12:983–989. doi: 10.1017/S1461145709000492. [DOI] [PubMed] [Google Scholar]
- 24.Champagne FA, et al. Variations in nucleus accumbens dopamine associated with individual differences in maternal behavior in the rat. J Neurosci. 2004;24:4113–4123. doi: 10.1523/JNEUROSCI.5322-03.2004. [DOI] [PMC free article] [PubMed] [Google Scholar]
- 25.Grados MA. The genetics of obsessive-compulsive disorder and Tourette’s syndrome: what are the common factors? Curr Psychiatry Rep. 2009;11:162–166. doi: 10.1007/s11920-009-0025-x. [DOI] [PubMed] [Google Scholar]
- 26.Crowley JJ, et al. Antipsychotic-induced vacuous chewing movements and extrapyramidal side effects are highly heritable in mice. Pharmacogenomics J. 2012;12:147–155. doi: 10.1038/tpj.2010.82. [DOI] [PMC free article] [PubMed] [Google Scholar]
- 27.Foster AC, et al. In vivo pharmacological characterization of indiplon, a novel pyrazolopyrimidine sedative-hypnotic. J Pharmacol Exp Ther. 2004;311:547–559. doi: 10.1124/jpet.103.063487. [DOI] [PubMed] [Google Scholar]
- 28.Petroski RE, et al. Indiplon is a high-affinity positive allosteric modulator with selectivity for alpha1 subunit-containing GABAA receptors. J Pharmacol Exp Ther. 2006;317:369–377. doi: 10.1124/jpet.105.096701. [DOI] [PubMed] [Google Scholar]
- 29.Klausberger T, Roberts JD, Somogyi P. Cell type- and input-specific differences in the number and subtypes of synaptic GABA(A) receptors in the hippocampus. J Neurosci. 2002;22:2513–2521. doi: 10.1523/JNEUROSCI.22-07-02513.2002. doi:20026228. [DOI] [PMC free article] [PubMed] [Google Scholar]
- 30.Castellanos FX, et al. Sensorimotor gating in boys with Tourette’s syndrome and ADHD: preliminary results. Biol Psychiatry. 1996;39:33–41. doi: 10.1016/0006-3223(95)00101-8. [DOI] [PubMed] [Google Scholar]
Methods References
- 1.Glessner JT, et al. Autism genome-wide copy number variation reveals ubiquitin and neuronal genes. Nature. 2009;459:569–573. doi: 10.1038/nature07953. [DOI] [PMC free article] [PubMed] [Google Scholar]
- 2.Elia J, et al. Genome-wide copy number variation study associates metabotropic glutamate receptor gene networks with attention deficit hyperactivity disorder. Nat Genet. 2012;44:78–84. doi: 10.1038/ng.1013. [DOI] [PMC free article] [PubMed] [Google Scholar]
- 3.Glessner JT, et al. Strong synaptic transmission impact by copy number variations in schizophrenia. Proc Natl Acad Sci U S A. 2010;107:10584–10589. doi: 10.1073/pnas.1000274107. [DOI] [PMC free article] [PubMed] [Google Scholar]
- 4.Karayiorgou M, et al. Phenotypic characterization and genealogical tracing in an Afrikaner schizophrenia database. Am J Med Genet B Neuropsychiatr Genet. 2004;124B:20–28. doi: 10.1002/ajmg.b.20090. [DOI] [PubMed] [Google Scholar]
- 5.Abecasis GR, et al. Genomewide scan in families with schizophrenia from the founder population of Afrikaners reveals evidence for linkage and uniparental disomy on chromosome 1. Am J Hum Genet. 2004;74:403–417. doi: 10.1086/381713. [DOI] [PMC free article] [PubMed] [Google Scholar]
- 6.Xu B, et al. Strong association of de novo copy number mutations with sporadic schizophrenia. Nat Genet. 2008;40:880–885. doi: 10.1038/ng.162. [DOI] [PubMed] [Google Scholar]
- 7.Xu B, et al. Elucidating the genetic architecture of familial schizophrenia using rare copy number variant and linkage scans. Proc Natl Acad Sci U S A. 2009;106:16746–16751. doi: 10.1073/pnas.0908584106. [DOI] [PMC free article] [PubMed] [Google Scholar]
- 8.Purcell S, et al. PLINK: a tool set for whole-genome association and population-based linkage analyses. Am J Hum Genet. 2007;81:559–575. doi: 10.1086/519795. [DOI] [PMC free article] [PubMed] [Google Scholar]
- 9.Li Y, Willer CJ, Ding J, Scheet P, Abecasis GR. MaCH: using sequence and genotype data to estimate haplotypes and unobserved genotypes. Genet Epidemiol. 2010;34:816–834. doi: 10.1002/gepi.20533. [DOI] [PMC free article] [PubMed] [Google Scholar]
- 10.Li M, Boehnke M, Abecasis GR. Joint modeling of linkage and association: identifying SNPs responsible for a linkage signal. Am J Hum Genet. 2005;76:934–949. doi: 10.1086/430277. [DOI] [PMC free article] [PubMed] [Google Scholar]
- 11.Li M, Boehnke M, Abecasis GR. Efficient study designs for test of genetic association using sibship data and unrelated cases and controls. Am J Hum Genet. 2006;78:778–792. doi: 10.1086/503711. [DOI] [PMC free article] [PubMed] [Google Scholar]
- 12.Feinberg K, et al. A glial signal consisting of gliomedin and NrCAM clusters axonal Na+ channels during the formation of nodes of Ranvier. Neuron. 2010;65:490–502. doi: 10.1016/j.neuron.2010.02.004. [DOI] [PMC free article] [PubMed] [Google Scholar]
- 13.Spiegel I, et al. A central role for Necl4 (SynCAM4) in Schwann cell-axon interaction and myelination. Nat Neurosci. 2007;10:861–869. doi: 10.1038/nn1915. [DOI] [PMC free article] [PubMed] [Google Scholar]
- 14.Spiegel I, Salomon D, Erne B, Schaeren-Wiemers N, Peles E. Caspr3 and caspr4, two novel members of the caspr family are expressed in the nervous system and interact with PDZ domains. Mol Cell Neurosci. 2002;20:283–297. doi: 10.1006/mcne.2002.1110. [DOI] [PubMed] [Google Scholar]
- 15.Jordan BA, et al. Identification and verification of novel rodent postsynaptic density proteins. Mol Cell Proteomics. 2004;3:857–871. doi: 10.1074/mcp.M400045-MCP200. [DOI] [PubMed] [Google Scholar]
- 16.Phillips GR, et al. The presynaptic particle web: ultrastructure, composition, dissolution, and reconstitution. Neuron. 2001;32:63–77. doi: 10.1016/s0896-6273(01)00450-0. [DOI] [PubMed] [Google Scholar]
- 17.Restituito S, et al. Synaptic autoregulation by metalloproteases and gamma-secretase. J Neurosci. 2011;31:12083–12093. doi: 10.1523/JNEUROSCI.2513-11.2011. [DOI] [PMC free article] [PubMed] [Google Scholar]
- 18.Patel JC, Rice ME. Monitoring axonal and somatodendritic dopamine release using fast-scan cyclic voltammetry in brain slices. Methods Mol Biol. 2013;964:243–273. doi: 10.1007/978-1-62703-251-3_15. [DOI] [PubMed] [Google Scholar]
- 19.Patel JC, Rossignol E, Rice ME, Machold RP. Opposing regulation of dopaminergic activity and exploratory motor behavior by forebrain and brainstem cholinergic circuits. Nat Commun. 2012;3:1172. doi: 10.1038/ncomms2144. [DOI] [PMC free article] [PubMed] [Google Scholar]
- 20.Li X, et al. Enhanced striatal dopamine transmission and motor performance with LRRK2 overexpression in mice is eliminated by familial Parkinson’s disease mutation G2019S. J Neurosci. 2010;30:1788–1797. doi: 10.1523/JNEUROSCI.5604-09.2010. [DOI] [PMC free article] [PubMed] [Google Scholar]
- 21.Nicholson C, Patel JC. A simplified analysis of dopamine uptake by Michaelis-Menten kinetics. Vrije Universiteit; Brussel: 2010. pp. 328–330. [Google Scholar]
- 22.Rice ME, Patel JC, Cragg SJ. Dopamine release in the basal ganglia. Neuroscience. 2011;198:112–137. doi: 10.1016/j.neuroscience.2011.08.066. [DOI] [PMC free article] [PubMed] [Google Scholar]
- 23.Osten P, et al. The AMPA receptor GluR2 C terminus can mediate a reversible, ATP-dependent interaction with NSF and alpha- and beta-SNAPs. Neuron. 1998;21:99–110. doi: 10.1016/s0896-6273(00)80518-8. [DOI] [PubMed] [Google Scholar]
- 24.Macaskill AF, et al. Miro1 is a calcium sensor for glutamate receptor-dependent localization of mitochondria at synapses. Neuron. 2009;61:541–555. doi: 10.1016/j.neuron.2009.01.030. [DOI] [PMC free article] [PubMed] [Google Scholar]
- 25.Nikolaev A, McLaughlin T, O’Leary DD, Tessier-Lavigne M. APP binds DR6 to trigger axon pruning and neuron death via distinct caspases. Nature. 2009;457:981–989. doi: 10.1038/nature07767. [DOI] [PMC free article] [PubMed] [Google Scholar] [Retracted]
- 26.Foster AC, et al. In vivo pharmacological characterization of indiplon, a novel pyrazolopyrimidine sedative-hypnotic. J Pharmacol Exp Ther. 2004;311:547–559. doi: 10.1124/jpet.103.063487. [DOI] [PubMed] [Google Scholar]
- 27.Hoeffer CA, et al. Removal of FKBP12 enhances mTOR-Raptor interactions, LTP, memory, and perseverative/repetitive behavior. Neuron. 2008;60:832–845. doi: 10.1016/j.neuron.2008.09.037. [DOI] [PMC free article] [PubMed] [Google Scholar]
- 28.Thomas A, et al. Marble burying reflects a repetitive and perseverative behavior more than novelty-induced anxiety. Psychopharmacology (Berl) 2009;204:361–373. doi: 10.1007/s00213-009-1466-y. [DOI] [PMC free article] [PubMed] [Google Scholar]
- 29.Miyoshi G, Butt SJ, Takebayashi H, Fishell G. Physiologically distinct temporal cohorts of cortical interneurons arise from telencephalic Olig2-expressing precursors. The Journal of neuroscience: the official journal of the Society for Neuroscience. 2007;27:7786–7798. doi: 10.1523/JNEUROSCI.1807-07.2007. [DOI] [PMC free article] [PubMed] [Google Scholar]
- 30.Spiegel I, Salomon D, Erne B, Schaeren-Wiemers N, Peles E. Caspr3 and caspr4, two novel members of the caspr family are expressed in the nervous system and interact with PDZ domains. Molecular and cellular neurosciences. 2002;20:283–297. doi: 10.1006/mcne.2002.1110. [DOI] [PubMed] [Google Scholar]
- 31.Gonzalez MI, Cruz Del, Angel Y, Brooks-Kayal A. Down-regulation of gephyrin and GABAA receptor subunits during epileptogenesis in the CA1 region of hippocampus. Epilepsia. 2013;54:616–624. doi: 10.1111/epi.12063. [DOI] [PMC free article] [PubMed] [Google Scholar]
- 32.Brandon NJ, et al. A-kinase anchoring protein 79/150 facilitates the phosphorylation of GABA(A) receptors by cAMP-dependent protein kinase via selective interaction with receptor beta subunits. Molecular and cellular neurosciences. 2003;22:87–97. doi: 10.1016/s1044-7431(02)00017-9. [DOI] [PubMed] [Google Scholar]
- 33.Panzanelli P, et al. Distinct mechanisms regulate GABAA receptor and gephyrin clustering at perisomatic and axo-axonic synapses on CA1 pyramidal cells. The Journal of physiology. 2011;589:4959–4980. doi: 10.1113/jphysiol.2011.216028. [DOI] [PMC free article] [PubMed] [Google Scholar]
- 34.Hoon M, et al. Neuroligin 2 controls the maturation of GABAergic synapses and information processing in the retina. The Journal of neuroscience: the official journal of the Society for Neuroscience. 2009;29:8039–8050. doi: 10.1523/JNEUROSCI.0534-09.2009. [DOI] [PMC free article] [PubMed] [Google Scholar]
- 35.Miyoshi G, et al. Genetic fate mapping reveals that the caudal ganglionic eminence produces a large and diverse population of superficial cortical interneurons. The Journal of neuroscience: the official journal of the Society for Neuroscience. 2010;30:1582–1594. doi: 10.1523/JNEUROSCI.4515-09.2010. [DOI] [PMC free article] [PubMed] [Google Scholar]
- 36.Restituito S, et al. Synaptic autoregulation by metalloproteases and gamma-secretase. The Journal of neuroscience: the official journal of the Society for Neuroscience. 2011;31:12083–12093. doi: 10.1523/JNEUROSCI.2513-11.2011. [DOI] [PMC free article] [PubMed] [Google Scholar]
- 37.Batista-Brito R, et al. The cell-intrinsic requirement of Sox6 for cortical interneuron development. Neuron. 2009;63:466–481. doi: 10.1016/j.neuron.2009.08.005. [DOI] [PMC free article] [PubMed] [Google Scholar]
- 38.Conde F, Lund JS, Jacobowitz DM, Baimbridge KG, Lewis DA. Local circuit neurons immunoreactive for calretinin, calbindin D-28k or parvalbumin in monkey prefrontal cortex: distribution and morphology. The Journal of comparative neurology. 1994;341:95–116. doi: 10.1002/cne.903410109. [DOI] [PubMed] [Google Scholar]
- 39.Belzil C, et al. A Ca2+-dependent mechanism of neuronal survival mediated by the microtubule-associated protein p600. The Journal of biological chemistry. 2013;288:24452–24464. doi: 10.1074/jbc.M113.483107. [DOI] [PMC free article] [PubMed] [Google Scholar]
- 40.Miyoshi G, Fishell G. Dynamic FoxG1 expression coordinates the integration of multipolar pyramidal neuron precursors into the cortical plate. Neuron. 2012;74:1045–1058. doi: 10.1016/j.neuron.2012.04.025. [DOI] [PMC free article] [PubMed] [Google Scholar]
- 41.Close J, et al. Satb1 is an activity-modulated transcription factor required for the terminal differentiation and connectivity of medial ganglionic eminence-derived cortical interneurons. The Journal of neuroscience: the official journal of the Society for Neuroscience. 2012;32:17690–17705. doi: 10.1523/JNEUROSCI.3583-12.2012. [DOI] [PMC free article] [PubMed] [Google Scholar]
- 42.Haycock JW. Stimulation-dependent phosphorylation of tyrosine hydroxylase in rat corpus striatum. Brain research bulletin. 1987;19:619–622. doi: 10.1016/0361-9230(87)90046-3. [DOI] [PubMed] [Google Scholar]
Associated Data
This section collects any data citations, data availability statements, or supplementary materials included in this article.


