

Abstract
The contribution of genetic interactions involving three or more loci to complex traits is poorly understood. Because these higher-order genetic interactions (HGIs) are difficult to detect in genetic mapping studies, very few examples of them have been described. However, the lack of data on HGIs should not be misconstrued as proof that this class of genetic effect is unimportant. To the contrary, evidence from model organisms suggests that HGIs frequently influence genetic studies and contribute to many complex traits. Here, we review the growing literature on HGIs and discuss the future of research on this topic.
HGIs merit deeper investigation as a source of complex trait variation
Genetic interactions (sometimes referred to as epistatic interactions) contribute to many complex traits. Despite widespread recognition of this point [1-6], relatively little is known about the specific forms of genetic interactions that are important to heritable phenotypic variation. To date, researchers have mainly reported genetic interactions involving only two loci (e.g., [7-11]). However, this emphasis on gene-gene interactions over higher-order genetic interactions (HGIs) involving three or more loci is rooted in technical issues (Figure 1), rather than biology. As others have noted, conventional genetic mapping methods have generally low statistical power to identify genetic interactions and higher statistical power to detect gene-gene interactions than HGIs [12, 13]. These biases mean that most genetic studies are unlikely to detect HGIs regardless of whether they affect a trait or not, and make it difficult to determine the overall role of HGIs in heritable phenotypes.
Figure 1.
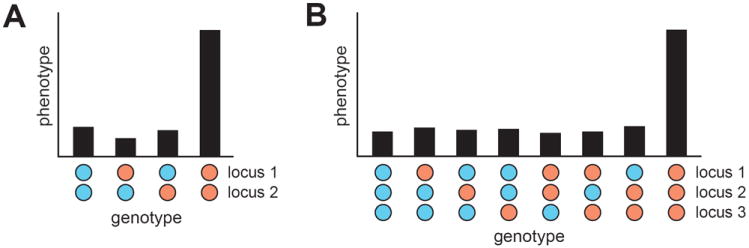
A gene-gene interaction is shown in A, while the simplest form of HGI, a three-locus genetic interaction, is depicted in B. For simplicity, we demonstrate these forms of genetic interactions using haploids. However, we note that HGIs can occur in diploid organisms and can involve more loci. In each plot, different genotypes across the involved loci are shown across the x-axis, while the average phenotype among individuals with a given genotype is presented along the y-axis. An individual’s genotype at a specific locus is depicted as a filled circle. The two alleles of a locus are distinguished with the colors blue and orange. A genetic interaction occurs when an individual possesses the orange allele at each involved locus. We employ this coloring scheme throughout the paper. The numbers used to label interacting loci are arbitrary. Therefore, the labels ‘locus 1’ and ‘locus 2’ in parts A and B do not correspond to the same genomic regions.
In this review, we examine the potential contribution of HGIs to complex traits. We write from the perspective that HGIs merit deeper investigation as a source of ‘missing heritability’ in humans and model systems [14, 15]. This assertion is based upon not only the technical considerations described above, but also multiple recent papers that have shown that HGIs can have major phenotypic effects (e.g., [16-19]). Our goal with the present manuscript is to summarize these studies, which are fairly small in total number, and aggregate them with other research that provides less direct support for HGIs. With the data in hand, readers can then form their own opinions about the potential importance of HGIs. For researchers interested in identifying HGIs in their own systems, we also describe some of the approaches that have successfully detected loci involved in HGIs, and speculate on causal mechanisms that further characterization of these interacting loci might uncover. We conclude the paper by raising some ‘big picture’ questions about HGIs that future research will hopefully address.
Evidence for HGIs
In this section, we summarize some of the strongest evidence that HGIs contribute to complex traits. Support for HGIs falls into two main classes—suggestive and direct. We employ the term ‘suggestive’ to refer to cases where a study’s results indicated that HGIs might contribute to a trait, but the specific loci involved in a HGI were not identified. In contrast, we use the term ‘direct’ to refer to instances where multiple loci involved in a HGI were detected (as summarized in Figure 2). We focus exclusively on results from model organisms, but note that HGIs have also been reported in humans [20, 21].
Figure 2.
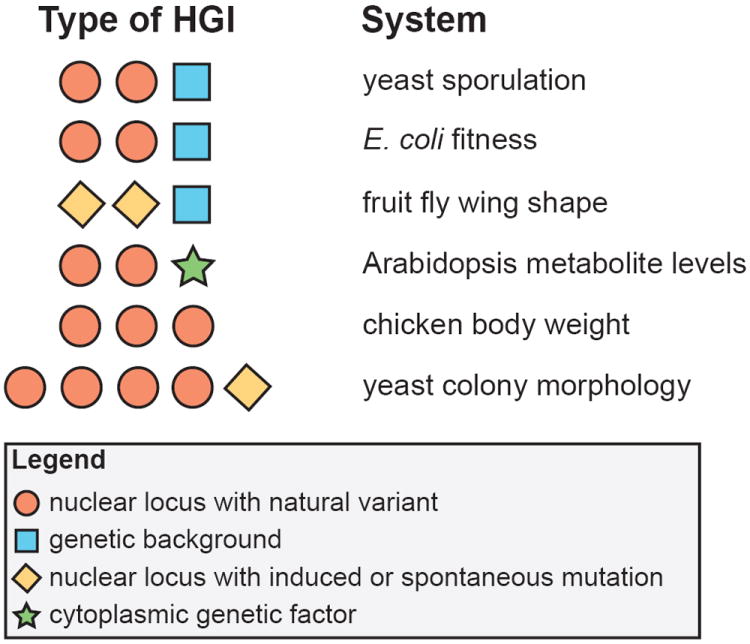
Examples of HGIs from model organism research: Arabidopsis metabolite levels [45], chicken body weight [16], E. coli fitness [34], fruit fly wing shape [18], yeast colony morphology [17], and yeast sporulation [35]. Different types of evidence for HGIs are distinguished by color and shape.
Suggestive evidence
Unexplained epistatic genetic variance in crosses
Under many experimental designs, it is possible to estimate the total contribution of genetic interactions to a trait [22, 23]. However, such estimates of the epistatic genetic variance typically do not distinguish between the effects of gene-gene interactions and HGIs. With a sufficiently large mapping population, one can attempt to separate these effects by scanning for gene-gene interactions and determining what proportion of the epistatic genetic variance they leave unexplained. A recent study focused on a cross of two yeast strains employed this strategy [24]. The authors generated a mapping population of 1,006 haploid segregants, each of which was genotyped throughout the genome. They then measured 46 growth traits in this panel under highly controlled conditions. Due to the large sample size of this study, as well as the precise phenotype data, the authors were able to identify loci that explained nearly all of the additive genetic bases for the examined traits. However, many of these phenotypes also exhibited a sizable non-additive genetic component. Because individuals were grown in a uniform environment, non-additive genetic effects had to be due to genetic interactions. The authors conducted scans for gene-gene interactions and identified a number of two-locus interactions. However, for most traits, these gene-gene interactions explained only a small percentage of the epistatic genetic variance. This result suggests that undetected genetic interactions, in particular gene-gene interactions with very weak effects or HGIs, contribute to some of the phenotypes.
Over-explanation of phenotypic differences using genome-wide chromosome substitution panels
Another source of suggestive information regarding HGIs comes from work on panels of chromosome substitution strains, which consist of individuals that each carry a single chromosome from a ‘donor’ parent and the rest of their chromosomes from a different ‘recipient’ parent [25]. Chromosome substitution panels include one strain for each chromosome, facilitating the measurement of every chromosome’s contribution to a trait. If loci influencing a trait act in a largely additive manner, then effects measured in the chromosome substitution panels should add up to the phenotypic difference between the donor and recipient parents used to generate a population. However, departures from this expectation imply that genetic interactions contribute to a trait. In one of the most comprehensive studies of this type, researchers examined 144 blood, bone, and metabolic traits in mouse and rat genome-wide chromosome substitution panels [26]. They found that the cumulative phenotypic effect of individual chromosome substitutions was often more than 100% of the phenotypic difference between the two parents of a panel, with more than 500% of the difference accounted for in some instances [26]. This finding, which has been replicated in additional chromosome substitution panels [27], suggests that genetic interactions among loci on a number of chromosomes contributed to many of the examined traits. Whether this involved many gene-gene interactions, HGIs, or a mixture of the two has not been determined. We note that another possible explanation for the findings in the chromosome substitution panels is that some of the examined traits are range-bound (i.e., have ‘ceilings’ and ‘floors’ [27]), causing loci to show genetic interactions at the statistical level even though causal alleles might function additively at the physiological level.
Genetic background effects and conditional essential mutations
Work on genetic background effects also suggests that HGIs make a significant contribution to many traits. This phenomenon occurs when mutations or sequence polymorphisms vary in their effects across genetically diverse individuals (e.g., [28-30]). Research in multiple species has shown that genetic background effects are very common (as reviewed in [2, 31, 32]). Recent studies indicate that genetic background effects may arise due to HGIs among natural genetic variants [18, 33]. One of the most detailed studies along these lines was conducted in yeast [33]. Researchers examined the effects of null alleles of nearly every gene in the Saccharomyces cerevisiae genome on viability in two genetically diverged strains. 57 genes were found to be essential for growth in rich glucose medium in only one of the two strains. To determine the architecture of this ‘conditional essentiality’, they measured the frequency at which null alleles caused inviability in crosses of the two strains. Based on these data, the authors estimated that conditional essentiality was often due to two or more interacting loci, suggesting that HGIs occurred among the null alleles and multiple genetic variants present in the two examined strains [33].
Direct evidence
Gene-gene interactions that are influenced by genetic background
Further evidence for HGIs comes from cases in which gene-gene interactions underlying a trait were identified, but only had effects in specific genetic backgrounds. Examples of such work have been described in analyses of both fitness in Escherichia coli [34] and sporulation in yeast [35]. A possible explanation for this finding is that the two initially identified loci participate in HGIs with additional loci. Some of the most detailed work on genetic background-dependent gene-gene interactions comes from the work on yeast sporulation efficiency [35, 36]. In a cross of two isolates, the authors identified four SNPs in the genes IME1, RME1, and RSF1 that together explain nearly all of the heritable variation in sporulation efficiency when cultures are shifted from glucose to acetate [36]. These SNPs largely affect the trait through additive effects and gene-gene interactions. However, a subsequent examination of the 16 different homozygous genotypes involving these 4 nucleotides across both of the parental genetic backgrounds and 8 different conditions revealed a high context-dependence to these gene-gene interactions [37]. Indeed, only a single gene-gene interaction was significant across genetic backgrounds and environments, suggesting that unidentified loci may participate in HGIs with the polymorphisms in IME1, RME1, and RSF1.
Genetic background-dependent interactions between mutations
Similar to gene-gene interactions among naturally occurring genetic variants, interactions between mutations can also be affected by genetic background [31]. This implies that genetic variants among strains may form HGIs with these mutations. Work in Drosophila melanogaster on the scallopedE3 (sdE3) mutation, which influences wing shape, has provided some of the deepest insights into this phenomenon [18, 38]. In a large-scale examination of the effects of modifier mutations on sdE3 in two strains, the authors found that 74% of the modifiers were affected by genetic background [38]. They then used a combination of approaches, including measurement of global gene expression, genetic mapping, and integrative bioinformatics analysis, to determine the genetic basis of variability in the effects of sdE3 modifiers [18]. Their results indicated that these genetic background-dependent effects on interactions between sdE3 and its modifiers were shaped by HGIs involving these mutations and additional segregating loci [18].
Cytonuclear interactions involving three or more nuclear and cytoplasmic factors
An additional source of evidence for HGIs is research on cytonuclear interactions, which arise due to genetic interactions between nuclear loci and cytoplasmic factors [39]. Although the chloroplast and mitochondria are the most frequently studied cytoplasmic factors, plasmids, prions, and viruses can also have heritable phenotypic effects [40, 41]. Work on a number of species has shown that cytonuclear interactions are pervasive [39] and can significantly influence complex traits, such as longevity in flies [42], flowering time, growth, and defense against herbivores and pathogens in plants [43, 44], and the growth effects of gene deletions in yeast [40]. A recent study on heritable variation in metabolism in an Arabidopsis cross is particularly relevant to the discussion of HGIs [45]. The authors showed that many gene-gene interactions among nuclear loci were affected by an individual’s cytoplasmic genotype. Although the relative contributions of the chloroplast and mitochondria to this observation could not be determined, this paper demonstrates that HGIs between two nuclear and at least a single cytoplasmic locus can occur.
Examples of comprehensively dissected HGIs
Arguably the strongest support for HGIs comes from examples in which the specific loci involved in an HGI have been identified. Unfortunately, the number of these examples is small (e.g., [16, 17, 19]). Here, we summarize two of the papers that have most convincingly demonstrated HGIs: one that described three-locus interactions that influence body weight in a cross of two chicken lines [16], and another that showed a pair of genetic interactions involving five or more loci that determine colony morphology in a cross of two yeast strains [17]. The work on chickens was a follow-up study to an artificial selection experiment that identified a set of five loci that each showed a gene-gene interaction with the same central locus [13]. In the subsequent study of these interacting loci, the authors used a large advanced intercross population to replicate the previously identified gene-gene interactions and show that some of the loci participated in three-locus genetic interactions [16]. The HGIs identified in yeast led to a ‘rough’ colony phenotype that unexpectedly segregated at a low frequency in a cross [17]. Although many isolates of S. cerevisiae exhibit unusual colony morphologies (e.g., [46, 47]), the cross employed in this paper involved two parents with the same ‘smooth’ colony morphology [17]. The authors screened thousands of backcross progeny, sequenced the genomes of hundreds of rough progeny, and performed a large number of genetic manipulations to identify alleles at five genes that interact to specify the phenotype. They then conducted additional experiments to show that one of the non-causal alleles can lead to the phenotype through an interaction between it and a specific combination of alleles at two other loci. Of note, both of the genetic architectures underlying rough morphology critically depend on a spontaneous mutation in IRA2, a gene that negatively regulates the Ras pathway.
Identifying loci and genes involved in HGIs
Given the small number of characterized HGIs, dissection of more examples to their underlying loci and genes is needed to significantly improve our understanding of this class of genetic effect. In this section, we summarize strategies that can aid in such research, emphasizing linkage mapping [48] and selective genotyping [49] approaches in strain crosses. We note that HGIs that segregate among isolates can appear as additive effects or gene-gene interactions, or may not even show effects depending on which individuals are crossed (Figure 3). We do not address association mapping in populations of wild isolates (e.g., [50, 51]) because the abundance of low frequency alleles [52] and population structure [53, 54] in these studies complicates the already challenging task of studying HGIs.
Figure 3.
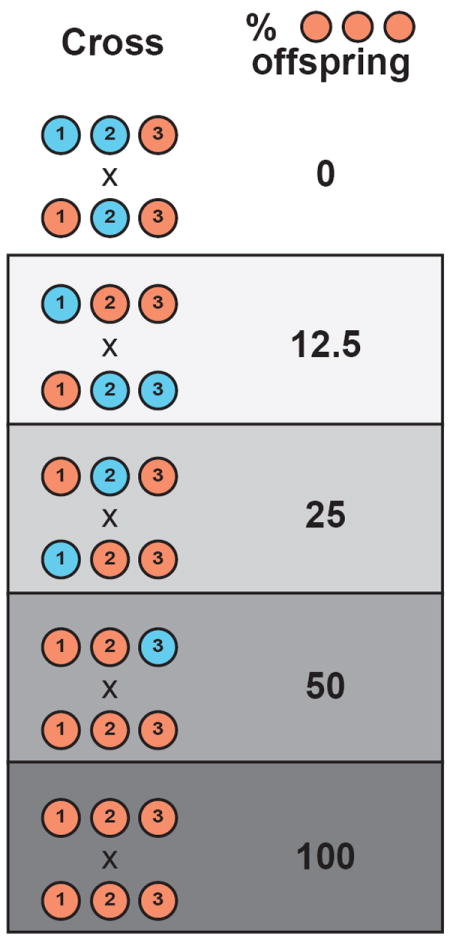
HGIs that occur within species can segregate in a variety of ways in controlled crosses, depending on the genotypes of cross parents at involved loci. Here, we show this phenomenon using haploids and a three-locus HGI. Each individual is illustrated as an unfilled bar with three loci. The order of loci is arbitrary and is not intended to imply linkage.
A number of factors make it difficult to identify the specific loci and genes involved in HGIs in crosses. First, exhaustive searches for HGIs require an extremely large number of statistical tests, resulting in a multiple testing problem and low power [1, 12, 55]. Second, as noted previously with respect to gene-gene interactions [56], scans for HGIs involving larger numbers of loci suffer from an added statistical power issue: multi-locus genotype classes that are critical for detecting a HGI may be represented by only a very small number of individuals in a typically sized mapping population and consequently the effect of a HGI might be missed. Third, HGIs may be ‘synthetic’ or ‘compositional’; in other words, loci involved in a HGI may not individually exhibit phenotypic effects (e.g., [17]). Fourth, efforts to clone genes involved in HGIs using complementation [57] and genetic engineering techniques [58, 59] may only succeed in specific genetic backgrounds that possess the requisite alleles at interacting loci [60] (Figure 4).
Figure 4.
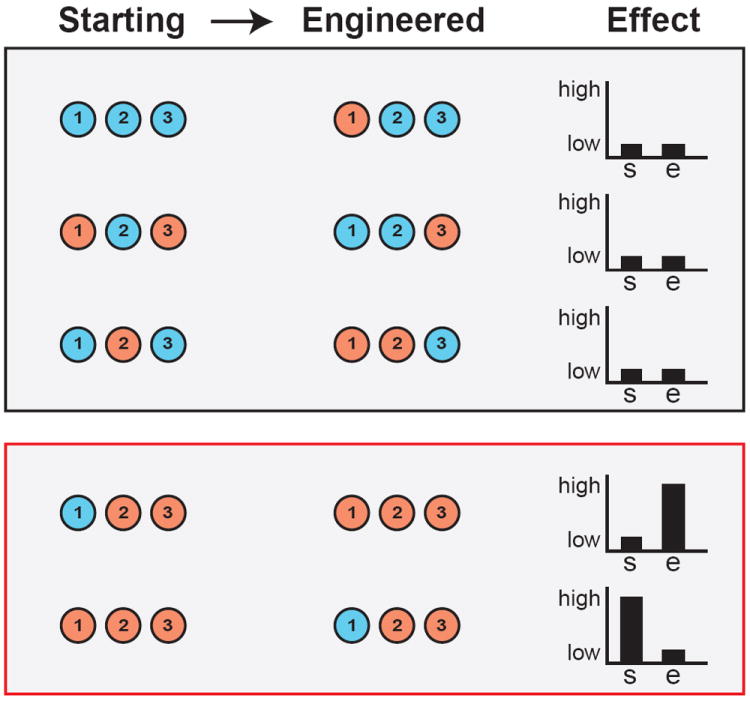
Cloning genes underlying HGIs requires using appropriate genetic backgrounds for engineering or complementation testing. Here, we focus on allele replacement strategies. The top panel (black border) shows examples that will fail to validate a gene’s effect, whereas the bottom panel (red border) shows examples that will succeed in validating a gene’s effect. In the plots illustrating phenotypic effects, ‘s’ refers to the starting genotype, while ‘e’ refers to the engineered genotype.
Despite these challenges, it is possible to identify HGIs and dissect them to their underlying components. One way to determine that a HGI might contribute to a trait is by examining the phenotypic distribution shown by a mapping population. As others have noted, genetic interactions that affect a continuous phenotype may shift the average trait value among cross progeny relative to the average trait value shown by their parents [23, 61]. However, assessing whether this effect is due to HGIs, gene-gene interactions, or a combination of the two typically requires downstream experiments. Further, HGIs that play a role in qualitative traits may cause these phenotypes to segregate at low frequencies in genetic mapping populations, as was recently shown [17]. This is because only a small fraction of individuals in a mapping population may carry the combination of alleles that interact and cause expression of a qualitative trait.
At the genetic level, a number of strategies have been developed to enable detection of interacting loci by linkage analysis without performing exhaustive searches (e.g., [55, 62-65]). Extensions of these approaches might be applicable to HGIs, in particular when large genetic mapping populations are examined. A particularly promising technique is analysis of ‘variance heterogeneity’ [63, 64, 66]. The idea underlying this method is that individuals that share the same allele at a locus and exhibit high phenotypic variance may do so because they differ in their genotypes at other interacting loci (Figure 5). Evidence suggests this strategy can identify loci involved in HGIs [66]; however, it is important to rule out that such variance heterogeneity is not simply due to alleles that cause increased stochasticity in a trait (e.g., [67, 68]). Beyond more conventional linkage approaches, genetic mapping techniques that employ phenotypic selection (e.g., [37, 49, 69]) will also likely prove valuable in studying HGIs. Unlike linkage mapping approaches, these methods identify alleles that are enriched among or retained by individuals that share a phenotype, and can detect both additive and interacting loci.
Figure 5.
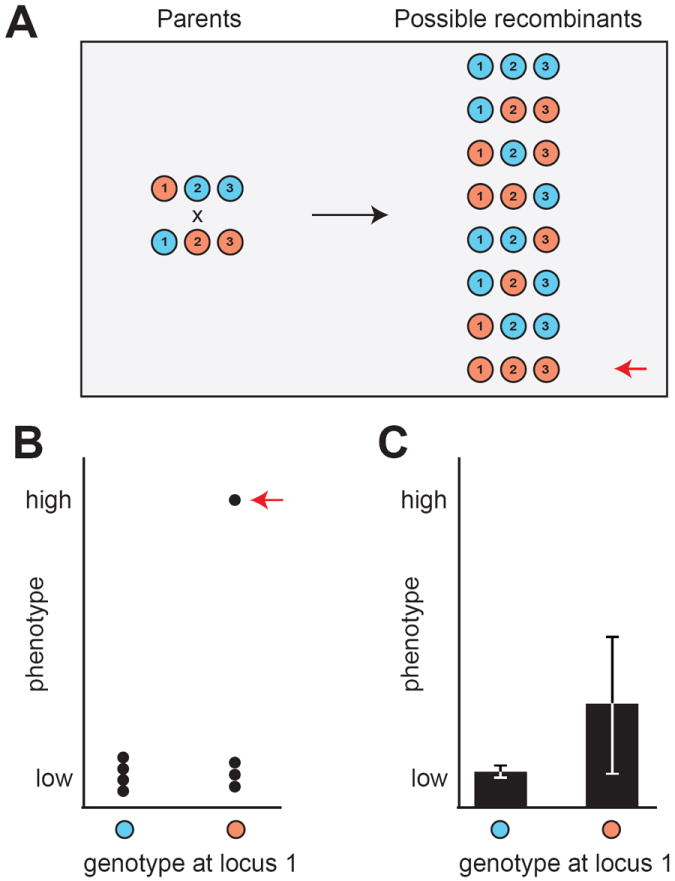
HGIs can cause differences in the phenotypic variance of the two alleles at a locus. (A) Two parents that differ at three interacting loci are crossed. Only one of the eight haploid recombinant genotypes possesses the alleles required for the HGI (denoted with a red arrow). (B) Phenotypes of the eight possible haploid recombinants are plotted by their allele at locus 1. The individual carrying the interacting combination of alleles denoted with a red arrow and has a higher phenotypic value than the other genotypes. (C) Potential effect of the HGI on the phenotypic variance associated with the two alleles at locus 1. The orange allele shows an appreciably higher phenotypic variance than the blue allele due to some individuals possessing the interacting combination of alleles. The bars depict confidence intervals of an arbitrary level (e.g., 95%).
The work described in the previous section [16-19] also provides valuable insights into strategies for effectively studying HGIs. For example, identifying HGIs may be easiest in crosses of two strains (e.g., [16-18, 33]). This is because they possess less genetic diversity and fewer possible allele combinations than natural populations or intercrosses involving a larger number of parents (e.g., [70-72]). Additionally, the previous work shows that examining a very large number of cross progeny can provide the statistical power necessary to detect loci involved in HGIs [16, 17]. A final noteworthy result of some of the above studies is that mutations and ‘cryptic’ genetic variants that segregate in natural populations can participate together in HGIs [17, 18]. Cryptic variants normally do not have phenotypic effects, but can influence traits when perturbed either by their genetic background or environment [73-75]. This finding shows that induced and spontaneous mutations can aid in the search for HGIs.
Mechanistic basis of HGIs
To this point, we have mainly explored the evidence for HGIs, as well as techniques that can aid in finding loci involved in HGIs. However, determining the mechanisms that cause HGIs is also important. Such knowledge will improve our basic understanding of how an individual’s genotype specifies their phenotype and might also facilitate the development of new methods for detecting HGIs.
Even though present data on mechanisms underlying HGIs is limited, past work on gene-gene interactions (as reviewed in [76, 77]) is likely relevant. Gene-gene interactions can occur due to loss-of-function mutations in two genes that act in the same or redundant pathways or protein complexes [78, 79]. Given that putatively null alleles and incomplete loss-of-function alleles are fairly common in natural populations [80-83], it is possible that sets of three or more of these variants might lead to HGIs if they occur in the ‘right’ genes. Further, hundreds of protein complexes possess more than two protein subunits [84]. It is possible that genetic variants in three or more of these subunits might collectively destabilize a protein complex or even induce new protein complexes to form.
There are a number of other potential causes of HGIs, one of the most likely being genetic variation perturbing multiple components of a gene regulatory network [85, 86]. If sets of transcription factors and their upstream regulators possess functional variants, specific combinations of these alleles might collectively alter the levels of phenotypically important transcripts and proteins. Supporting such a possibility, it is well established that species harbor extensive heritable variation in gene regulation (e.g., [87-91]). Further, recent work in yeast has shown that polymorphisms in transcription factors, as well as a polymorphism that might impact translation, contribute to HGIs [17, 36]. Other mechanisms that have been hypothesized for gene-gene interactions may also extend to HGIs. These include changes in the levels of critical ‘threshold’ molecules and loss of genetic buffering [77, 92].
Although we have focused on individual mechanisms that can result in HGIs, the mechanisms described in this section are not mutually exclusive. Indeed, combinations of these mechanisms, as well as other unforeseen causes, might result in HGIs. Comprehensive genetic and molecular dissection of example HGIs is therefore critical to advancing our understanding of this subject, as present data do not allow any definitive claims.
Concluding remarks
As we have shown, evidence suggests that HGIs contribute to a number of complex traits. However, as a general class of genetic effects, HGIs are poorly understood. Thus, it is likely that research in the near future will play a crucial role in developing our basic knowledge of HGIs (see Outstanding Questions). In summary, although research on HGIs is in its infancy, this line of enquiry has great potential to improve our basic understanding of how heritable traits are specified at the genetic level.
Outstanding Questions.
What is the typical architecture, effect size distribution, and prevalence of HGIs? Much of the direct evidence for HGIs comes from examples involving a relatively small number of loci that collectively exhibit a large effect. Additional research is needed to determine whether HGIs often involve even more loci or make more subtle contributions to traits, and to assess the general contribution of HGIs to the total phenotypic variance within populations. Further, as noted by others [2], alleles involved in gene-gene interactions can generate apparent additive genetic variance in natural populations. It is worthwhile to examine the extent to which alleles that participate in HGIs also contribute to this problem. Lastly, most work on HGIs to date has focused on haploid organisms or homozygous inbred lines from diploid species. Future work should explore the general prevalence of HGIs across traits and organisms, and should also examine the importance of HGIs in populations that exhibit heterozygosity.
Are there general mechanisms that result in HGIs? Identifying loci involved in HGIs is difficult with current approaches and cloning the genes underlying these loci is arguably even more challenging. However, characterizing how HGIs arise at the molecular level is imperative. Such work may identify mechanisms that generate complex trait variation that are distinct from those found in studies of additive loci or gene-gene interactions. Additionally, discovering any general mechanisms that contribute to HGIs may aid in the development of new analytical approaches for detecting loci that participate in HGIs. Such methods may be necessary for identifying HGIs in humans and other species that are not amenable to the experimental techniques described in this review.
What is the relationship between evolution and HGIs? Evolutionary geneticists have begun to recognize the potential importance of HGIs [93]. Within the context of complex traits, many evolutionary processes, including genetic drift, natural selection, demography, and genome duplication, influence the genetic architectures of heritable phenotypes [52]. Determining the extent to which these different processes affect the prevalence of HGIs can help in assessing whether HGIs might contribute to heritable phenotypic variation in a particular population or species. Lastly, given that cryptic genetic variants can participate in HGIs, it is worthwhile to examine the broader role of HGIs in facilitating phenotypic novelty and evolutionary adaptation in natural populations [94, 95].
Highlights.
Most work on genetic interactions focuses on relatively simple cases involving only two loci.
Higher-order genetics interactions (HGIs) involving three or more loci also occur and can have major phenotypic effects.
Crossing experiments in model organisms are starting to provide crucial insights into the architecture, prevalence, and mechanisms of HGIs.
Continued work on HGIs will improve our basic understanding of the relationship between genotype and phenotype.
Acknowledgments
We thank Jonathan Lee, Robert Linder, Takeshi Matsui, Joann Phan, Nicole Ratib, and Fabian Seidl, as well as our reviewers, for critically reviewing a draft of this paper. Our work was supported by grants from the National Institutes of Health (R01GM110255 and R21AI108939), National Science Foundation (MCB1330874), and Rose Hills Foundation to I.M.E.
Glossary
- Complex trait
A phenotype that is influenced by multiple genetic loci.
- Additive locus
A locus that affects a phenotype independent of an individual’s genetic background.
- Genetic interaction (epistasis)
When two or more loci influence a phenotype in a dependent manner. These loci may or may not individually show additive effects. If they show additive effects, their interaction may result in higher or lower trait values than expected under an additive model.
- Higher-order genetic interaction
A genetic interaction involving alleles at three or more loci.
- Genetic background effect
When the effect of a genetic variant depends on the strain background in which it occurs.
Footnotes
Publisher's Disclaimer: This is a PDF file of an unedited manuscript that has been accepted for publication. As a service to our customers we are providing this early version of the manuscript. The manuscript will undergo copyediting, typesetting, and review of the resulting proof before it is published in its final citable form. Please note that during the production process errors may be discovered which could affect the content, and all legal disclaimers that apply to the journal pertain.
References
- 1.Phillips PC. Epistasis--the essential role of gene interactions in the structure and evolution of genetic systems. Nature reviews Genetics. 2008;9:855–867. doi: 10.1038/nrg2452. [DOI] [PMC free article] [PubMed] [Google Scholar]
- 2.Mackay TF. Epistasis and quantitative traits: using model organisms to study gene-gene interactions. Nature reviews Genetics. 2014;15:22–33. doi: 10.1038/nrg3627. [DOI] [PMC free article] [PubMed] [Google Scholar]
- 3.Carlborg O, Haley CS. Epistasis: too often neglected in complex trait studies? Nature reviews Genetics. 2004;5:618–625. doi: 10.1038/nrg1407. [DOI] [PubMed] [Google Scholar]
- 4.Huang W, et al. Epistasis dominates the genetic architecture of Drosophila quantitative traits. Proceedings of the National Academy of Sciences of the United States of America. 2012;109:15553–15559. doi: 10.1073/pnas.1213423109. [DOI] [PMC free article] [PubMed] [Google Scholar]
- 5.Frankel WN, Schork NJ. Who’s afraid of epistasis? Nature genetics. 1996;14:371–373. doi: 10.1038/ng1296-371. [DOI] [PubMed] [Google Scholar]
- 6.Nelson RM, et al. A century after Fisher: time for a new paradigm in quantitative genetics. Trends in genetics : TIG. 2013;29:669–676. doi: 10.1016/j.tig.2013.09.006. [DOI] [PubMed] [Google Scholar]
- 7.Caicedo AL, et al. Epistatic interaction between Arabidopsis FRI and FLC flowering time genes generates a latitudinal cline in a life history trait. Proceedings of the National Academy of Sciences of the United States of America. 2004;101:15670–15675. doi: 10.1073/pnas.0406232101. [DOI] [PMC free article] [PubMed] [Google Scholar]
- 8.Brem RB, et al. Genetic interactions between polymorphisms that affect gene expression in yeast. Nature. 2005;436:701–703. doi: 10.1038/nature03865. [DOI] [PMC free article] [PubMed] [Google Scholar]
- 9.Gaertner BE, et al. More than the sum of its parts: a complex epistatic network underlies natural variation in thermal preference behavior in Caenorhabditis elegans. Genetics. 2012;192:1533–1542. doi: 10.1534/genetics.112.142877. [DOI] [PMC free article] [PubMed] [Google Scholar]
- 10.Rowe HC, et al. Biochemical networks and epistasis shape the Arabidopsis thaliana metabolome. The Plant cell. 2008;20:1199–1216. doi: 10.1105/tpc.108.058131. [DOI] [PMC free article] [PubMed] [Google Scholar]
- 11.Jarvis JP, Cheverud JM. Mapping the epistatic network underlying murine reproductive fatpad variation. Genetics. 2011;187:597–610. doi: 10.1534/genetics.110.123505. [DOI] [PMC free article] [PubMed] [Google Scholar]
- 12.Cordell HJ. Detecting gene-gene interactions that underlie human diseases. Nature reviews Genetics. 2009;10:392–404. doi: 10.1038/nrg2579. [DOI] [PMC free article] [PubMed] [Google Scholar]
- 13.Carlborg O, et al. Epistasis and the release of genetic variation during long-term selection. Nature genetics. 2006;38:418–420. doi: 10.1038/ng1761. [DOI] [PubMed] [Google Scholar]
- 14.Manolio TA, et al. Finding the missing heritability of complex diseases. Nature. 2009;461:747–753. doi: 10.1038/nature08494. [DOI] [PMC free article] [PubMed] [Google Scholar]
- 15.Zuk O, et al. The mystery of missing heritability: Genetic interactions create phantom heritability. Proceedings of the National Academy of Sciences of the United States of America. 2012;109:1193–1198. doi: 10.1073/pnas.1119675109. [DOI] [PMC free article] [PubMed] [Google Scholar]
- 16.Pettersson M, et al. Replication and explorations of high-order epistasis using a large advanced intercross line pedigree. PLoS genetics. 2011;7:e1002180. doi: 10.1371/journal.pgen.1002180. [DOI] [PMC free article] [PubMed] [Google Scholar]
- 17.Taylor MB, Ehrenreich IM. Genetic interactions involving five or more genes contribute to a complex trait in yeast. PLoS genetics. 2014;10:e1004324. doi: 10.1371/journal.pgen.1004324. [DOI] [PMC free article] [PubMed] [Google Scholar]
- 18.Chandler CH, et al. Causes and consequences of genetic background effects illuminated by integrative genomic analysis. Genetics. 2014;196:1321–1336. doi: 10.1534/genetics.113.159426. [DOI] [PMC free article] [PubMed] [Google Scholar]
- 19.Hanlon P, et al. Three-locus and four-locus QTL interactions influence mouse insulin-like growth factor-I. Physiological genomics. 2006;26:46–54. doi: 10.1152/physiolgenomics.00247.2005. [DOI] [PMC free article] [PubMed] [Google Scholar]
- 20.Ritchie MD, et al. Multifactor-dimensionality reduction reveals high-order interactions among estrogen-metabolism genes in sporadic breast cancer. American journal of human genetics. 2001;69:138–147. doi: 10.1086/321276. [DOI] [PMC free article] [PubMed] [Google Scholar]
- 21.Collins RL, et al. Multifactor dimensionality reduction reveals a three-locus epistatic interaction associated with susceptibility to pulmonary tuberculosis. BioData mining. 2013;6:4. doi: 10.1186/1756-0381-6-4. [DOI] [PMC free article] [PubMed] [Google Scholar]
- 22.Falconer DS, Mackay TF. Introduction to quantitative genetics. Pearson Education Limited; 1996. [Google Scholar]
- 23.Lynch M, Walsh B. Genetics and analysis of quantitative traits. Sinauer Associates, Inc; 1998. [Google Scholar]
- 24.Bloom JS, et al. Finding the sources of missing heritability in a yeast cross. Nature. 2013;494:234–237. doi: 10.1038/nature11867. [DOI] [PMC free article] [PubMed] [Google Scholar]
- 25.Nadeau JH, et al. Analysing complex genetic traits with chromosome substitution strains. Nature genetics. 2000;24:221–225. doi: 10.1038/73427. [DOI] [PubMed] [Google Scholar]
- 26.Shao H, et al. Genetic architecture of complex traits: large phenotypic effects and pervasive epistasis. Proceedings of the National Academy of Sciences of the United States of America. 2008;105:19910–19914. doi: 10.1073/pnas.0810388105. [DOI] [PMC free article] [PubMed] [Google Scholar]
- 27.Spiezio SH, et al. Genetic divergence and the genetic architecture of complex traits in chromosome substitution strains of mice. BMC genetics. 2012;13:38. doi: 10.1186/1471-2156-13-38. [DOI] [PMC free article] [PubMed] [Google Scholar]
- 28.Threadgill DW, et al. Targeted disruption of mouse EGF receptor: effect of genetic background on mutant phenotype. Science. 1995;269:230–234. doi: 10.1126/science.7618084. [DOI] [PubMed] [Google Scholar]
- 29.Sinha H, et al. Complex genetic interactions in a quantitative trait locus. PLoS genetics. 2006;2:e13. doi: 10.1371/journal.pgen.0020013. [DOI] [PMC free article] [PubMed] [Google Scholar]
- 30.Swarup S, et al. Extensive epistasis for olfactory behaviour, sleep and waking activity in Drosophila melanogaster. Genetics research. 2012;94:9–20. doi: 10.1017/S001667231200002X. [DOI] [PMC free article] [PubMed] [Google Scholar]
- 31.Chandler CH, et al. Does your gene need a background check? How genetic background impacts the analysis of mutations, genes, and evolution. Trends in genetics : TIG. 2013;29:358–366. doi: 10.1016/j.tig.2013.01.009. [DOI] [PMC free article] [PubMed] [Google Scholar]
- 32.Nadeau JH. Modifier genes in mice and humans. Nature reviews Genetics. 2001;2:165–174. doi: 10.1038/35056009. [DOI] [PubMed] [Google Scholar]
- 33.Dowell RD, et al. Genotype to phenotype: a complex problem. Science. 2010;328:469. doi: 10.1126/science.1189015. [DOI] [PMC free article] [PubMed] [Google Scholar]
- 34.Wang Y, et al. Genetic background affects epistatic interactions between two beneficial mutations. Biology letters. 2013;9:20120328. doi: 10.1098/rsbl.2012.0328. [DOI] [PMC free article] [PubMed] [Google Scholar]
- 35.Gerke J, et al. Gene-environment interactions at nucleotide resolution. PLoS genetics. 2010;6:e1001144. doi: 10.1371/journal.pgen.1001144. [DOI] [PMC free article] [PubMed] [Google Scholar]
- 36.Gerke J, et al. Genetic interactions between transcription factors cause natural variation in yeast. Science. 2009;323:498–501. doi: 10.1126/science.1166426. [DOI] [PMC free article] [PubMed] [Google Scholar]
- 37.Ehrenreich IM, et al. Dissection of genetically complex traits with extremely large pools of yeast segregants. Nature. 2010;464:1039–1042. doi: 10.1038/nature08923. [DOI] [PMC free article] [PubMed] [Google Scholar]
- 38.Chari S, Dworkin I. The conditional nature of genetic interactions: the consequences of wild-type backgrounds on mutational interactions in a genome-wide modifier screen. PLoS genetics. 2013;9:e1003661. doi: 10.1371/journal.pgen.1003661. [DOI] [PMC free article] [PubMed] [Google Scholar]
- 39.Rand DM, et al. Cytonuclear coevolution: the genomics of cooperation. Trends in ecology & evolution. 2004;19:645–653. doi: 10.1016/j.tree.2004.10.003. [DOI] [PubMed] [Google Scholar]
- 40.Edwards MD, et al. Interactions between chromosomal and nonchromosomal elements reveal missing heritability. Proceedings of the National Academy of Sciences of the United States of America. 2014;111:7719–7722. doi: 10.1073/pnas.1407126111. [DOI] [PMC free article] [PubMed] [Google Scholar]
- 41.Halfmann R, et al. Prions are a common mechanism for phenotypic inheritance in wild yeasts. Nature. 2012;482:363–368. doi: 10.1038/nature10875. [DOI] [PMC free article] [PubMed] [Google Scholar]
- 42.Zhu CT, et al. GxGxE for lifespan in Drosophila: mitochondrial, nuclear, and dietary interactions that modify longevity. PLoS genetics. 2014;10:e1004354. doi: 10.1371/journal.pgen.1004354. [DOI] [PMC free article] [PubMed] [Google Scholar]
- 43.Leinonen PH, et al. Genetic basis of local adaptation and flowering time variation in Arabidopsis lyrata. Molecular ecology. 2013;22:709–723. doi: 10.1111/j.1365-294X.2012.05678.x. [DOI] [PubMed] [Google Scholar]
- 44.Joseph B, et al. Hierarchical nuclear and cytoplasmic genetic architectures for plant growth and defense within Arabidopsis. The Plant cell. 2013;25:1929–1945. doi: 10.1105/tpc.113.112615. [DOI] [PMC free article] [PubMed] [Google Scholar]
- 45.Joseph B, et al. Cytoplasmic genetic variation and extensive cytonuclear interactions influence natural variation in the metabolome. eLife. 2013;2:e00776. doi: 10.7554/eLife.00776. [DOI] [PMC free article] [PubMed] [Google Scholar]
- 46.Granek JA, Magwene PM. Environmental and genetic determinants of colony morphology in yeast. PLoS genetics. 2010;6:e1000823. doi: 10.1371/journal.pgen.1000823. [DOI] [PMC free article] [PubMed] [Google Scholar]
- 47.Ryan O, et al. Global gene deletion analysis exploring yeast filamentous growth. Science. 2012;337:1353–1356. doi: 10.1126/science.1224339. [DOI] [PubMed] [Google Scholar]
- 48.Lander ES, Botstein D. Mapping mendelian factors underlying quantitative traits using RFLP linkage maps. Genetics. 1989;121:185–199. doi: 10.1093/genetics/121.1.185. [DOI] [PMC free article] [PubMed] [Google Scholar]
- 49.Michelmore RW, et al. Identification of markers linked to disease-resistance genes by bulked segregant analysis: a rapid method to detect markers in specific genomic regions by using segregating populations. Proceedings of the National Academy of Sciences of the United States of America. 1991;88:9828–9832. doi: 10.1073/pnas.88.21.9828. [DOI] [PMC free article] [PubMed] [Google Scholar]
- 50.Atwell S, et al. Genome-wide association study of 107 phenotypes in Arabidopsis thaliana inbred lines. Nature. 2010;465:627–631. doi: 10.1038/nature08800. [DOI] [PMC free article] [PubMed] [Google Scholar]
- 51.Andersen EC, et al. Chromosome-scale selective sweeps shape Caenorhabditis elegans genomic diversity. Nature genetics. 2012;44:285–290. doi: 10.1038/ng.1050. [DOI] [PMC free article] [PubMed] [Google Scholar]
- 52.Hartl DL, Clark AG. Principles of population genetics. Sinauer Associates, Inc; 2006. [Google Scholar]
- 53.Pritchard JK, et al. Association mapping in structured populations. American journal of human genetics. 2000;67:170–181. doi: 10.1086/302959. [DOI] [PMC free article] [PubMed] [Google Scholar]
- 54.Kang HM, et al. Variance component model to account for sample structure in genome-wide association studies. Nature genetics. 2010;42:348–354. doi: 10.1038/ng.548. [DOI] [PMC free article] [PubMed] [Google Scholar]
- 55.Storey JD, et al. Multiple locus linkage analysis of genomewide expression in yeast. PLoS biology. 2005;3:e267. doi: 10.1371/journal.pbio.0030267. [DOI] [PMC free article] [PubMed] [Google Scholar]
- 56.Turner LM, et al. Genomic networks of hybrid sterility. PLoS genetics. 2014;10:e1004162. doi: 10.1371/journal.pgen.1004162. [DOI] [PMC free article] [PubMed] [Google Scholar]
- 57.Turner TL. Fine-mapping natural alleles: quantitative complementation to the rescue. Molecular ecology. 2014;23:2377–2382. doi: 10.1111/mec.12719. [DOI] [PMC free article] [PubMed] [Google Scholar]
- 58.Wilkinson R, Wiedenheft B. A CRISPR method for genome engineering. F1000prime reports. 2014;6:3. doi: 10.12703/P6-3. [DOI] [PMC free article] [PubMed] [Google Scholar]
- 59.Storici F, et al. In vivo site-directed mutagenesis using oligonucleotides. Nature biotechnology. 2001;19:773–776. doi: 10.1038/90837. [DOI] [PubMed] [Google Scholar]
- 60.Service PM. How good are quantitative complementation tests? Science of aging knowledge environment : SAGE KE. 2004;2004:pe13. doi: 10.1126/sageke.2004.12.pe13. [DOI] [PubMed] [Google Scholar]
- 61.Brem RB, Kruglyak L. The landscape of genetic complexity across 5,700 gene expression traits in yeast. Proceedings of the National Academy of Sciences of the United States of America. 2005;102:1572–1577. doi: 10.1073/pnas.0408709102. [DOI] [PMC free article] [PubMed] [Google Scholar]
- 62.Carlborg O, et al. The use of a genetic algorithm for simultaneous mapping of multiple interacting quantitative trait loci. Genetics. 2000;155:2003–2010. doi: 10.1093/genetics/155.4.2003. [DOI] [PMC free article] [PubMed] [Google Scholar]
- 63.Pare G, et al. On the use of variance per genotype as a tool to identify quantitative trait interaction effects: a report from the Women’s Genome Health Study. PLoS genetics. 2010;6:e1000981. doi: 10.1371/journal.pgen.1000981. [DOI] [PMC free article] [PubMed] [Google Scholar]
- 64.Struchalin MV, et al. Variance heterogeneity analysis for detection of potentially interacting genetic loci: method and its limitations. BMC genetics. 2010;11:92. doi: 10.1186/1471-2156-11-92. [DOI] [PMC free article] [PubMed] [Google Scholar]
- 65.Kao CH, et al. Multiple interval mapping for quantitative trait loci. Genetics. 1999;152:1203–1216. doi: 10.1093/genetics/152.3.1203. [DOI] [PMC free article] [PubMed] [Google Scholar]
- 66.Nelson RM, et al. Variance heterogeneity in Saccharomyces cerevisiae expression data: trans-regulation and epistasis. PloS one. 2013;8:e79507. doi: 10.1371/journal.pone.0079507. [DOI] [PMC free article] [PubMed] [Google Scholar]
- 67.Ansel J, et al. Cell-to-cell stochastic variation in gene expression is a complex genetic trait. PLoS genetics. 2008;4:e1000049. doi: 10.1371/journal.pgen.1000049. [DOI] [PMC free article] [PubMed] [Google Scholar]
- 68.Jimenez-Gomez JM, et al. Genomic analysis of QTLs and genes altering natural variation in stochastic noise. PLoS genetics. 2011;7:e1002295. doi: 10.1371/journal.pgen.1002295. [DOI] [PMC free article] [PubMed] [Google Scholar]
- 69.Earley EJ, Jones CD. Next-generation mapping of complex traits with phenotype-based selection and introgression. Genetics. 2011;189:1203–1209. doi: 10.1534/genetics.111.129445. [DOI] [PMC free article] [PubMed] [Google Scholar]
- 70.King EG, et al. Genetic dissection of a model complex trait using the Drosophila Synthetic Population Resource. Genome research. 2012;22:1558–1566. doi: 10.1101/gr.134031.111. [DOI] [PMC free article] [PubMed] [Google Scholar]
- 71.Aylor DL, et al. Genetic analysis of complex traits in the emerging Collaborative Cross. Genome research. 2011;21:1213–1222. doi: 10.1101/gr.111310.110. [DOI] [PMC free article] [PubMed] [Google Scholar]
- 72.Kover PX, et al. A Multiparent Advanced Generation Inter-Cross to fine-map quantitative traits in Arabidopsis thaliana. PLoS genetics. 2009;5:e1000551. doi: 10.1371/journal.pgen.1000551. [DOI] [PMC free article] [PubMed] [Google Scholar]
- 73.Gibson G, Dworkin I. Uncovering cryptic genetic variation. Nature reviews Genetics. 2004;5:681–690. doi: 10.1038/nrg1426. [DOI] [PubMed] [Google Scholar]
- 74.Paaby AB, Rockman MV. Cryptic genetic variation: evolution’s hidden substrate. Nature reviews Genetics. 2014;15:247–258. doi: 10.1038/nrg3688. [DOI] [PMC free article] [PubMed] [Google Scholar]
- 75.Gibson G. Decanalization and the origin of complex disease. Nature reviews Genetics. 2009;10:134–140. doi: 10.1038/nrg2502. [DOI] [PubMed] [Google Scholar]
- 76.Boone C, et al. Exploring genetic interactions and networks with yeast. Nature reviews Genetics. 2007;8:437–449. doi: 10.1038/nrg2085. [DOI] [PubMed] [Google Scholar]
- 77.Lehner B. Molecular mechanisms of epistasis within and between genes. Trends in genetics : TIG. 2011;27:323–331. doi: 10.1016/j.tig.2011.05.007. [DOI] [PubMed] [Google Scholar]
- 78.Costanzo M, et al. The genetic landscape of a cell. Science. 2010;327:425–431. doi: 10.1126/science.1180823. [DOI] [PMC free article] [PubMed] [Google Scholar]
- 79.Tong AH, et al. Systematic genetic analysis with ordered arrays of yeast deletion mutants. Science. 2001;294:2364–2368. doi: 10.1126/science.1065810. [DOI] [PubMed] [Google Scholar]
- 80.Mackay TF, et al. The Drosophila melanogaster Genetic Reference Panel. Nature. 2012;482:173–178. doi: 10.1038/nature10811. [DOI] [PMC free article] [PubMed] [Google Scholar]
- 81.Clark RM, et al. Common sequence polymorphisms shaping genetic diversity in Arabidopsis thaliana. Science. 2007;317:338–342. doi: 10.1126/science.1138632. [DOI] [PubMed] [Google Scholar]
- 82.Genomes Project C, et al. An integrated map of genetic variation from 1,092 human genomes. Nature. 2012;491:56–65. doi: 10.1038/nature11632. [DOI] [PMC free article] [PubMed] [Google Scholar]
- 83.Liti G, et al. Population genomics of domestic and wild yeasts. Nature. 2009;458:337–341. doi: 10.1038/nature07743. [DOI] [PMC free article] [PubMed] [Google Scholar]
- 84.Gavin AC, et al. Proteome survey reveals modularity of the yeast cell machinery. Nature. 2006;440:631–636. doi: 10.1038/nature04532. [DOI] [PubMed] [Google Scholar]
- 85.Nuzhdin SV, et al. Genotype-phenotype mapping in a post-GWAS world. Trends in genetics : TIG. 2012;28:421–426. doi: 10.1016/j.tig.2012.06.003. [DOI] [PMC free article] [PubMed] [Google Scholar]
- 86.Gjuvsland AB, et al. Statistical epistasis is a generic feature of gene regulatory networks. Genetics. 2007;175:411–420. doi: 10.1534/genetics.106.058859. [DOI] [PMC free article] [PubMed] [Google Scholar]
- 87.Brem RB, et al. Genetic dissection of transcriptional regulation in budding yeast. Science. 2002;296:752–755. doi: 10.1126/science.1069516. [DOI] [PubMed] [Google Scholar]
- 88.Wray GA, et al. The evolution of transcriptional regulation in eukaryotes. Molecular biology and evolution. 2003;20:1377–1419. doi: 10.1093/molbev/msg140. [DOI] [PubMed] [Google Scholar]
- 89.McVicker G, et al. Identification of genetic variants that affect histone modifications in human cells. Science. 2013;342:747–749. doi: 10.1126/science.1242429. [DOI] [PMC free article] [PubMed] [Google Scholar]
- 90.Zheng W, et al. Genetic analysis of variation in transcription factor binding in yeast. Nature. 2010;464:1187–1191. doi: 10.1038/nature08934. [DOI] [PMC free article] [PubMed] [Google Scholar]
- 91.Pickrell JK, et al. Understanding mechanisms underlying human gene expression variation with RNA sequencing. Nature. 2010;464:768–772. doi: 10.1038/nature08872. [DOI] [PMC free article] [PubMed] [Google Scholar]
- 92.Hartman JLt, et al. Principles for the buffering of genetic variation. Science. 2001;291:1001–1004. doi: 10.1126/science.1056072. [DOI] [PubMed] [Google Scholar]
- 93.Weinreich DM, et al. Should evolutionary geneticists worry about higher-order epistasis? Current opinion in genetics & development. 2013;23:700–707. doi: 10.1016/j.gde.2013.10.007. [DOI] [PMC free article] [PubMed] [Google Scholar]
- 94.Hansen TF. Why epistasis is important for selection and adaptation. Evolution; international journal of organic evolution. 2013;67:3501–3511. doi: 10.1111/evo.12214. [DOI] [PubMed] [Google Scholar]
- 95.Wolf JB, et al., editors. Epistasis and the evolutionary process. Oxford University Press; 2000. [Google Scholar]